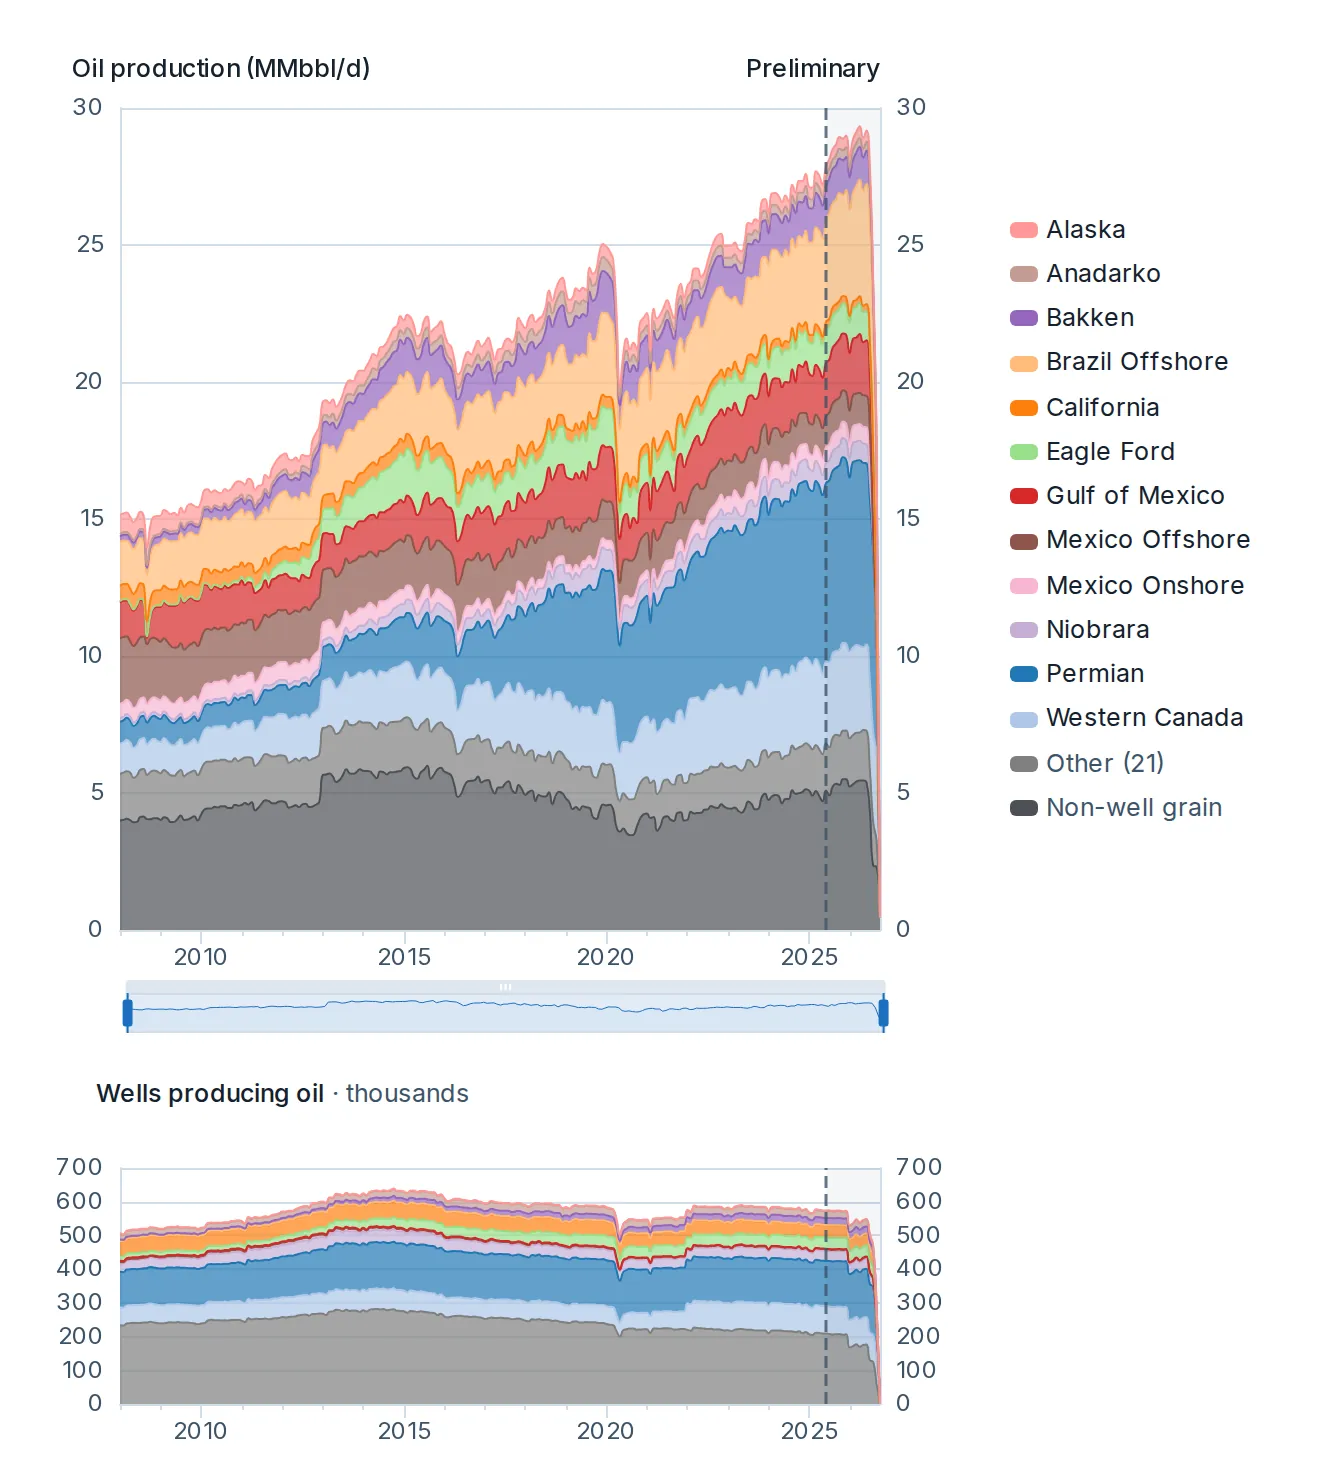
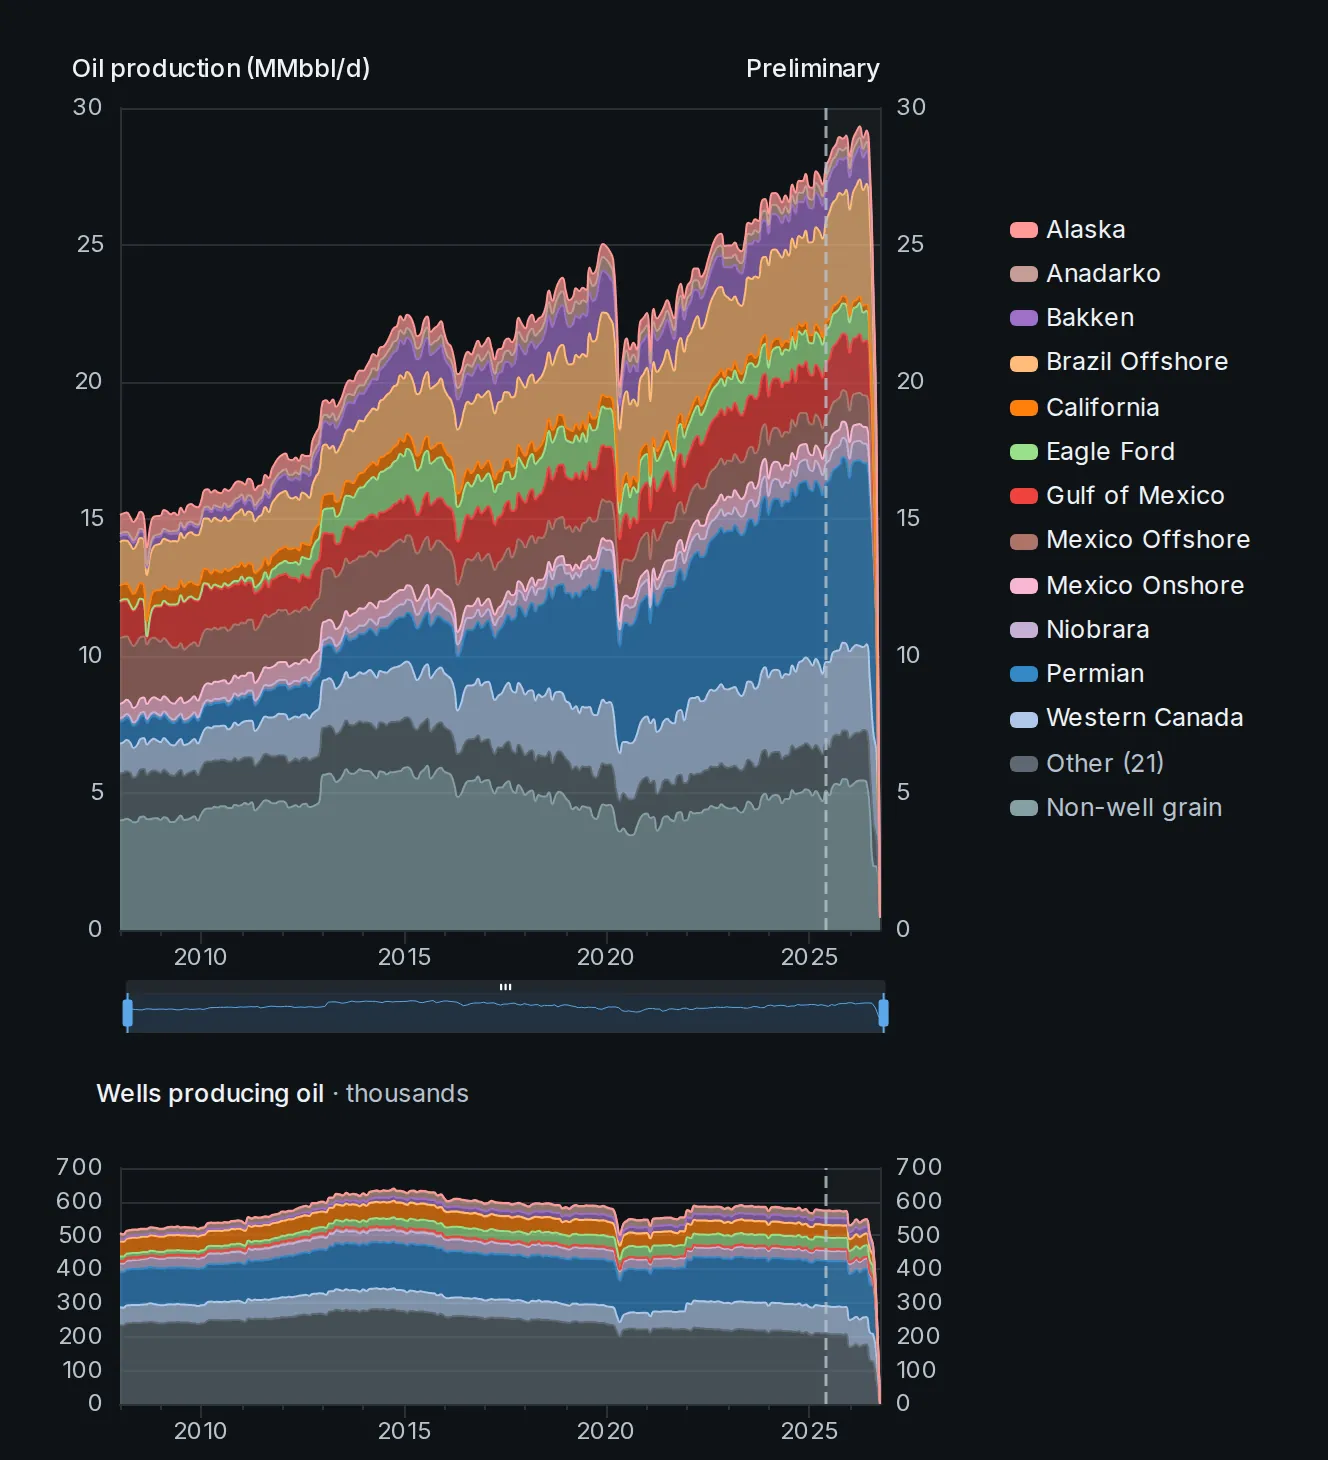
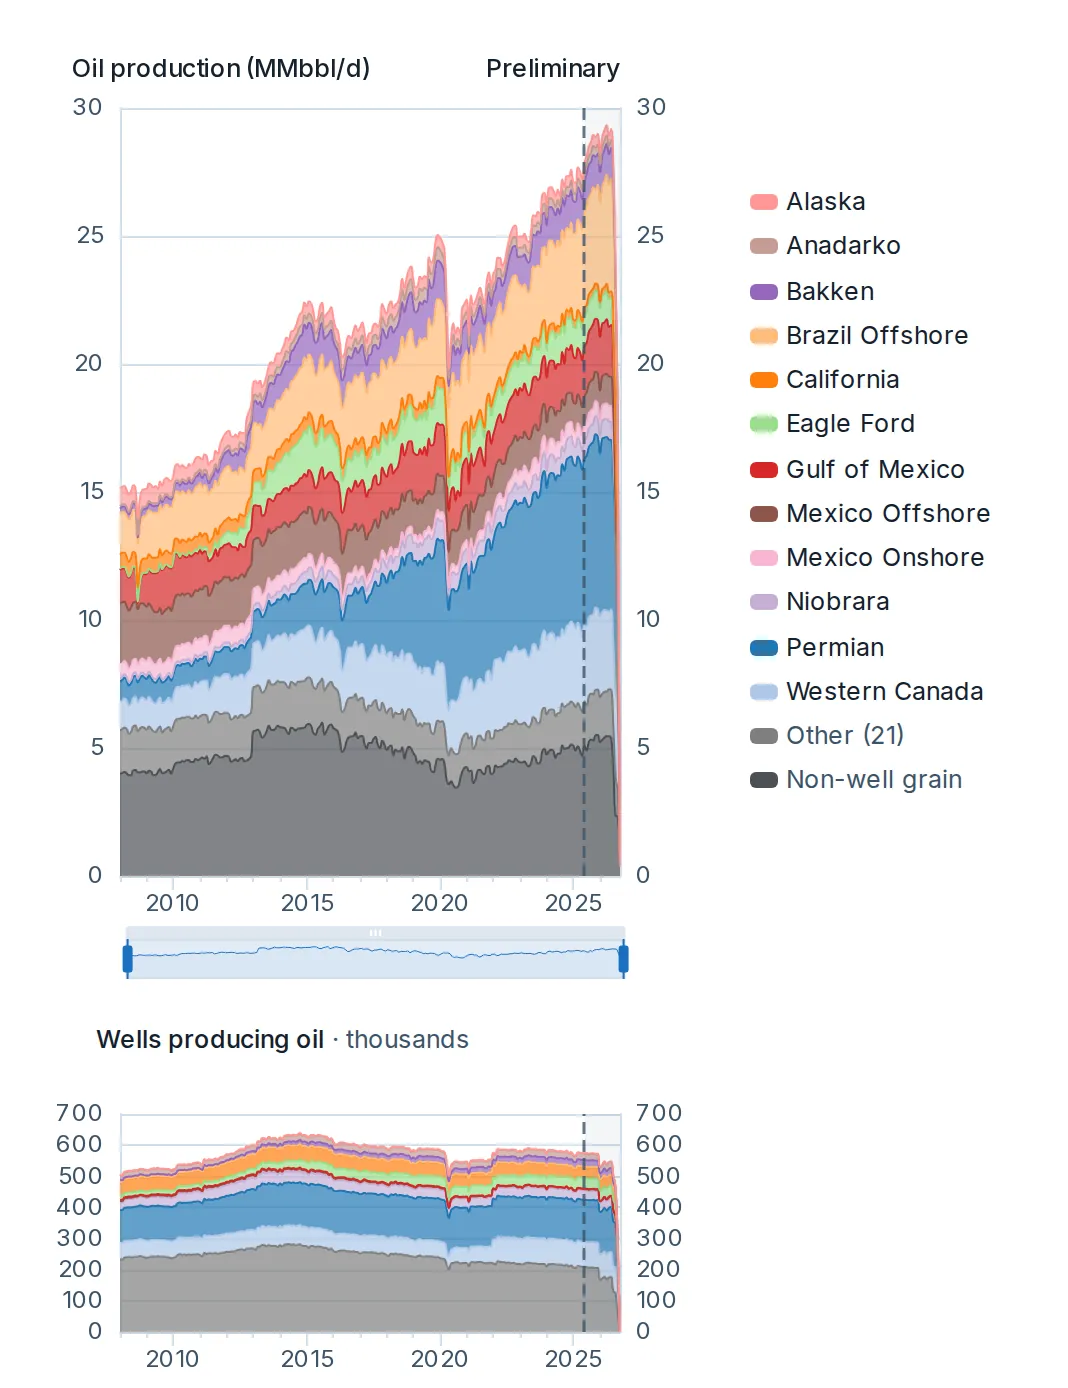
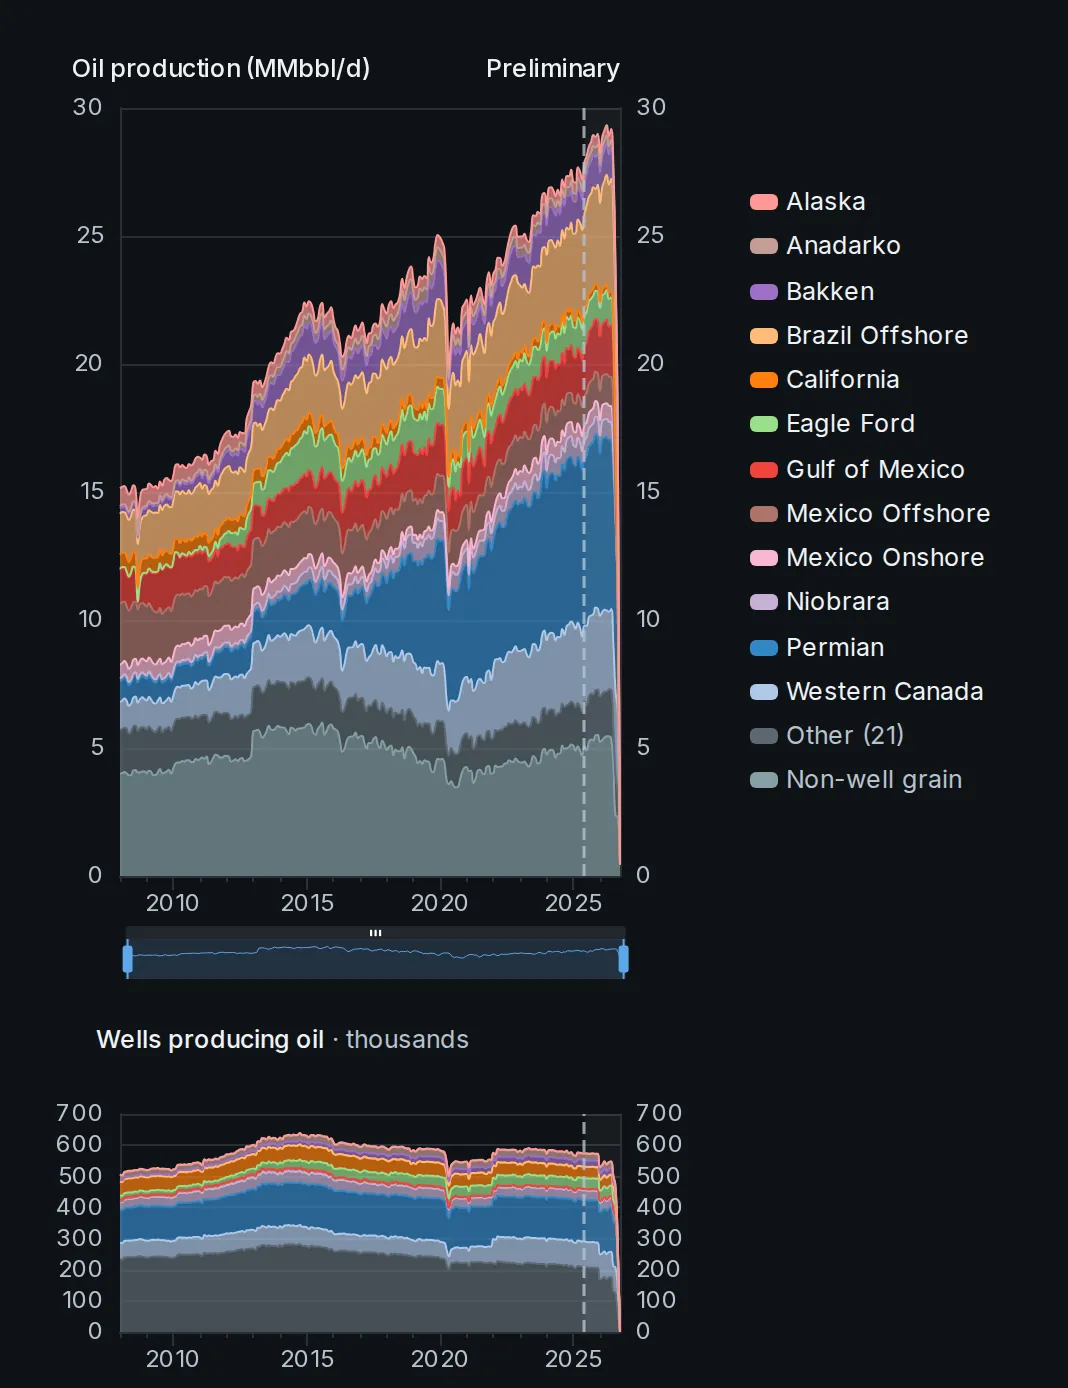
Monthly oil or gas for any selection, stacked by the grouping you pick.
More about Total production
Show it as reported, with the part not yet filed estimated, or with existing wells carried forward. A companion chart counts the wells producing.

See the future in real time
Two products, one data model. The API and MCP are live: they carry the data into your models, notebooks and AI tools, from well grain up. The Portal is open: the working view of the data, with dashboards, an interactive well map and each well’s full history. The aggregate picture is free on this site.
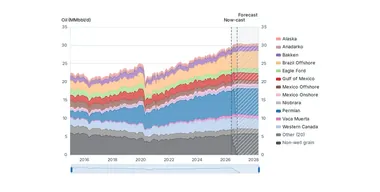
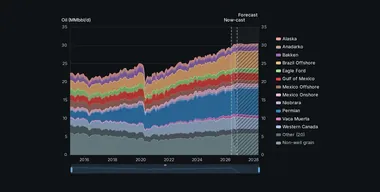
Where supply goes from here: reported production, the now-cast of the months still filling in, the decline of existing wells and the new wells expected to come online. By country, state or province, supply area, basin or county.
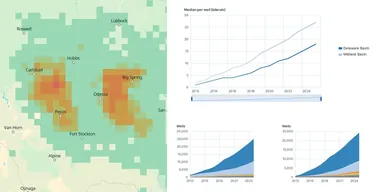
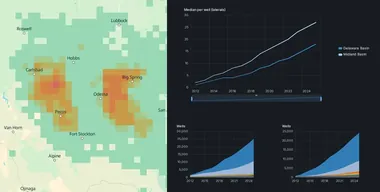
Spacing between neighboring laterals, measured from as-drilled survey paths: the typical gap by the year production started and over time, how many benches hold laterals nearby, and productivity by bench, in the regions where spacing is measured.
Built for commodity traders and supply analysts, and for equity and credit analysts.
The API and the MCP server are the core of the product. One request returns JSON or CSV, from a single well’s monthly history up to country totals across the Americas. Bulk extracts download whole tables, a change feed keeps a mirror current, and a freshness endpoint reports how current each data set is. The MCP server answers AI tools with the same data and the same key. Keys are created in the Portal; what a key may read comes from your plan.
pip install commovision, with optional DataFrame loading for polars and pandas.{
"data": [{
"well_id": "…",
"name": "…",
"operator": "…",
"state_province": "Texas",
"county": "Midland (TX)",
"basin": "Permian Basin",
"sub_basin": "Midland Basin",
"trajectory": "horizontal",
"primary_product": "oil",
"well_status": "producing",
"first_production_date": "…",
"latitude": …,
"longitude": …
}],
"page": { "limit": 1, "has_more": true, "next_cursor": "…" },
"meta": { "request_id": "…", "as_of": "…", "data_through": "…" }
}
26 tables behind the product, from well headers and monthly volumes to directional surveys, frac treatments, formation tops and per-well forecasts, every one of them on the API today. Open a table for what it holds and its key fields.
Each table’s endpoints serve its core fields. Wells, monthly production and companies also come as bulk extracts; together their files carry every stored column of those tables, and the change feed serves the same columns.
wells · well_production · producing_units · unit_production · well_injection · well_disposition · unit_disposition · well_operator_transfers · well_transporter
wellsThe master well register: one row per well, from the moment a drilling permit is on file through plugging.Where a regulator distinguishes a filed application from an approved permit, wells enter at the filing; elsewhere they enter at approval. Carries identity, operators (the operator as the source records it, the operator we attribute where the winning evidence is not the well record, and the original driller; the current owner is computed from our merger history at read time, so an ownership change reaches every well without a rewrite), surface and bottom-hole location, key lifecycle dates (permit, spud, completion, first production, plugged), wellbore geometry (trajectory, depths, lateral length), formation, and status. Many attributes carry a paired _source column telling you where the value came from (reported by the source, measured from a directional survey, or derived). Regional columns add each jurisdiction's own subdivisions (county, district, municipal district, ...).
Key fields: well_id, well_name (served as name), reported_operator_entity, state_province, basin, trajectory, first_production_date, well_status
· 146 fields in all
· Full reference
well_productionMonthly production volumes for every well, one row per well per month.The series runs from first production to the well's reporting frontier: alongside volumes exactly as reported, it includes reliably-inferred rows (interior gap fills, lease-to-well allocations, period-to-month splits), each labeled in record_origin so you can always filter to the raw reported subset. Where a well's operator filed nothing at all in a month, that month may be omitted rather than zero-filled. Volumes are monthly totals; per-day rates, cumulatives, and month counts are intentionally not stored. They derive from this table in one SQL expression (see the derived-fields section). Operator columns carry who filed each record, exactly as the source reported it, plus the operator we attribute where the source filed none; the owner at any date is computed from our merger history at read time, so an ownership correction reaches every month without a rewrite.
Key fields: well_id, date (served as month), year (in the bulk extracts and the change feed), oil_per_month (served as oil), gas_per_month (served as gas), water_per_month (served as water), producing_days, reported_operator (in the bulk extracts and the change feed)
· 23 fields in all
· Full reference
The monthly operator columns are in the bulk extracts; each well’s operator history is served at /oil-gas/v1/wells/{well_id}/operators.
producing_unitsThe register of producing units coarser than a single well (an FPSO, an oil-sands project, a field, or a whole country), used where a source reports production at that level rather than per well.Each unit carries its grain, jurisdiction, and operator. Volumes live in the monthly unit-production table; well-grain and unit-grain series are unified into one all-grain production surface.
Key fields: producing_unit_id, grain, name, country, region (served as state_province), parent_unit_id, operator, operator_id
· 16 fields in all
· Full reference
unit_productionMonthly production volumes for producing units coarser than a single well (an FPSO, a project, a field, or a whole country), one row per unit per month.This is the companion of the well-grain production table for sources that report at coarser grain; the unit's name, grain, and jurisdiction live on the producing-units register. A volume is NULL when that stream isn't reported at this unit's grain (e.g. gas metered nationally while oil is per-facility): NULL means no series at this grain, never zero. This table is unified with well-grain production into one all-grain surface.
Key fields: producing_unit_id, date, period_days, oil_per_month, gas_per_month, water_per_month, producing_days, operator
· 14 fields in all
· Full reference
well_injectionMonthly volumes injected INTO disposal, enhanced-recovery and storage wells: water (BBL) and gas (MCF), one row per injection well per month, with the injection type.This is fluid going down the hole; produced water lives on the production table. NULL means not reported, never zero.
Key fields: well_id (in the route path), date (served as month), year (not served), water_injected, gas_injected, injection_type, record_origin
· 7 fields in all
· Full reference
well_dispositionMonthly gas and oil disposition per well: where the produced volume went (sold, flared, vented, reinjected, used as lease or plant fuel), one row per well per month.NULL means the source didn't report that split; 0 is a reported zero. Each disposition column carries its own paired _origin column (reported at well grain vs allocated from lease-level filings). Together with monthly production this gives gross-to-marketed reconciliation and flaring intensity at well grain.
Key fields: well_id (in the route path), date (served as month), year (not served), gas_sold, gas_flared, gas_vented, gas_flared_vented, gas_reinjected
· 19 fields in all
· Full reference
unit_dispositionMonthly gas and oil disposition for producing units coarser than a single well (an FPSO, a project, a field, or a whole country), one row per unit per month.This is the companion of the well-grain disposition table for sources that report at coarser grain: where the produced volume went, split into sold, flared, vented, reinjected, and fuel. The unit's name, grain, and jurisdiction live on the producing-units register; join monthly unit production for the produced denominator. NULL means the source didn't report that split; 0 is a reported zero. Each disposition column carries its own paired _origin column.
Key fields: producing_unit_id, date, gas_sold, gas_flared, gas_vented, gas_flared_vented, gas_reinjected, gas_lease_fuel
· 18 fields in all
· Full reference
well_operator_transfersOperator transfer events for a well, as filed with the regulator.
Key fields: well_id, transfer_date, operator_from, operator_to, transfer_date_basis, effective_date, operator_from_id, operator_to_id
· 8 fields in all
· Full reference
well_transporterWho moves and buys each well's production: one row per (well, product, role, counterparty, effective interval) linking wells to their gatherer, purchaser, or off-taker, with each counterparty's share of take where reported.Sourced from designation filings (Texas, Colorado, Louisiana) and realized off-take reports (New Mexico).
Key fields: well_id, product, role, transporter_reg_id, effective_from, transporter_entity_id, transporter_name, effective_to
· 10 fields in all
· Full reference
well_forecast_months · cohort_type_curves
well_forecast_monthsOur deployed production forecast: one row per well per future month, oil and gas, starting the month after the well's last reported month and running at most 120 months or to the forecast horizon's calendar end (currently December 2035), whichever comes first.Most series today end at the calendar end, so a sum over a well's series is projected production through the series end, not ultimate recovery. oil_per_month and gas_per_month are expected values: additive across wells, so portfolio sums are portfolio forecasts. p10/p50/p90 bands appear where an uncertainty model backs them (petroleum convention: P10 optimistic).
Key fields: well_id (in the route path), forecast_month (served as month), year (not served), oil_per_month (served as oil), oil_per_month_p10 (held back), oil_per_month_p50 (held back), oil_per_month_p90 (held back), gas_per_month (served as gas)
· 11 fields in all
· Full reference
cohort_type_curvesStored type curves: for each cohort (basin-by-formation, plus coarser analog pools), the peak-normalized median decline shape by month-on-production with a p10/p90 donor-dispersion band.Scale a curve by a well's own peak to get that well's expected profile. The basin and region-analog curves are the ones that drive our new-well and total-supply projections; the two sub_region grains (model and descriptive) describe an area's own wells without feeding any projection. curve_grain, n_donors and is_extrapolated tell you the cohort grain, how many wells back the curve, and where the tail is extrapolated rather than donor-backed.
Key fields: curve_grain, stream, mop, norm_rate, norm_rate_p10, norm_rate_p90
· 18 fields in all
· Full reference
well_permits · well_completions · well_fracs · well_tests · directional_surveys · rig_activity
well_permitsOne row per drilling permit, covering every permit on file (pending, approved, rejected, expired, cancelled, and drilled), so the table reads as the forward-looking activity pipeline.Amendments update the permit's row (last_amended_date marks them) rather than creating duplicates. Carries the permitted well's identity and proposed location (including bottom-hole for horizontals), the operator at filing and today, and proposed depth, formation, and purpose. well_id is NULL until a well exists.
Key fields: permit_id, well_id, permit_number, country, state_province, state_province_code, well_name, permit_type
· 70 fields in all
· Full reference
well_completionsOne row per completion event (the initial completion and each later recompletion) as filed with the official source.A source that registers one physical completion under multiple registration identities carries one row per registration. Carries the completion date, the wellbore configuration produced by the event (formation, depths, lateral length, trajectory), and interval details. Plug-and-abandon events are not completions; they live on the well register (plugged_date).
Key fields: completion_id, well_id, completion_date, event_type, formation, lateral_length
· 52 fields in all
· Full reference
well_fracsOne row per hydraulic-fracturing job, reconciled across FracFocus and state filings so one physical treatment appears exactly once.Carries treatment dates, total proppant and water volumes, fluid-system classification, and stage count. Where FracFocus and the state disagree, we keep the better value and say which source supplied it: each key measurement carries its own paired _source column (proppant_lbs_source, total_water_gal_source, frac_stages_source).
Key fields: frac_id, well_id, completion_id, frac_start_date, frac_end_date, total_water_gal, proppant_lbs, proppant_type
· 16 fields in all
· Full reference
well_testsOne row per well test - initial potential, deliverability, surveys and retests - with tested oil, gas and water rates, gas-oil ratio as reported, flowing and shut-in pressures, and test duration.Test rates are short-duration measurements; monthly production is the sustained record.
Key fields: test_id, well_id, test_date, test_type, oil_per_day, gas_per_day, water_per_day, gor
· 33 fields in all
· Full reference
directional_surveysFull wellbore trajectories: one row per survey station (a measured-depth reading along a wellbore leg), with inclination, azimuth, true vertical depth, and position in WGS84.Every filed reading is kept: planned (proposed) surveys as well as as-drilled, and superseded filings alongside the latest, so you can compare plan against actual. For the current as-drilled trajectory, filter is_proposed = false and is_latest_version = true. This is the table for accurate lateral placement, well spacing, and landing-zone work.
Key fields: station_id, well_id, completion_id, station_sequence, leg, leg_type, leg_sequence, md
· 26 fields in all
· Full reference
rig_activityActive drilling-rig counts, a leading indicator of upcoming supply.Parallel series from independent published sources, each at its native breakdown: the Baker Hughes weekly North America count, the Baker Hughes monthly international count by country, and Mexico's monthly regulator series. Series are never mixed or reconciled, so each row matches the figure its source publishes. Where a source does not break down an axis, that column carries `all`: aggregate only within one source and one period type.
Key fields: source, date, country, state_province_code, area, basin, environment, rig_purpose
· 17 fields in all
· Full reference
formations · formation_surfaces · well_formation_tops · formation_name_mappings
formationsCanonical registry of geological formations: the named rock units wells target and produce from.One row per stratigraphic unit (group, formation, member, or bed, plus broad age buckets where a source reports only a geological age), with its place in the hierarchy and stable links into public stratigraphic references. formation_id columns across our well, completion, and formation-top tables reference this registry, so a name like Wolfcamp means the same unit everywhere.
Key fields: formation_id, canonical_name, rank, parent_formation_id, strat_order_base, strat_order_top, strat_order_withheld_reason, macrostrat_strat_name_id
· 13 fields in all
· Full reference
formation_surfacesGridded formation-top surfaces: one row per (basin, formation, grid point) with the interpolated subsea top depth, its uncertainty, and formation thickness (isopach).Built from our formation-top picks; combine with directional surveys to determine where a wellbore landed.
Key fields: basin, formation, grid_lat, grid_lon, formation_id, predicted_tvdss, predicted_tvdss_stddev, isopach_ft
· 9 fields in all
· Full reference
well_formation_topsFormation top picks: one row per well per geologic formation penetrated, with the measured top depth (TVD and subsea).Sourced from completion reports, well logs and scout tickets; this is the input data behind our gridded formation surfaces.
Key fields: well_id, formation, zone, formation_id, top_tvd, top_md, top_tvdss, top_tvd_source
· 18 fields in all
· Full reference
formation_name_mappingsHow reported formation names resolve to registry units.The same rock is reported under many names and spellings; each row maps one normalized reported name, within one basin, to its formation_id: the basin scope keeps same-named units in different basins apart. Apply it to your own data to get the same formation resolution we use.
Key fields: normalized_raw_name, basin, formation_id, zone, confidence, source
· 6 fields in all
· Full reference
companies · company_events · company_event_wells · company_name_mappings · company_registrations
companiesMaster register of the companies behind the wells: operators, service companies, midstream, integrated and downstream groups.One row per organization, deduplicated across regions and name variants; operator id columns across the well, production, and permit tables reference it by organization_id. Where a company was acquired, merged, or renamed, successor_id points to the organization that carries on.
Key fields: organization_id, name, short_name, organization_type, is_public, is_state_controlled, ticker, exchange
· 15 fields in all
· Full reference
company_eventsCorporate events that change who owns or operates assets: acquisitions, mergers, name changes, scoped asset transfers, and identity corrections.One row per event with the organizations involved and the date it took effect. This drives ownership-over-time attribution: activity before the effective date stays with the original company, after it with the successor.
Key fields: event_id, event_type, effective_date, announced_date, source_org_id (served as source_organization_id), target_org_id (served as target_organization_id), description (held back), source
· 9 fields in all
· Full reference
company_event_wellsThe specific wells covered by a scoped organization event.When an asset transfer moves only part of a company's assets, this holds the frozen set of wells the deal covered as of its effective date. Most events apply to whole organizations and need no well list, so this table is small and may be empty.
Key fields: event_id, well_id, source
· 3 fields in all
· Full reference
company_name_mappingsHow reported operator names resolve to organizations.Regulators publish the same company under many spellings; each row maps one normalized reported name, within one region, to its organization_id. This is the exact lookup our own attribution uses. Apply it to your raw data to get the same resolution.
Key fields: normalized_name, region, raw_example, organization_id, source (held back), is_auto (held back), created_date (held back)
· 7 fields in all
· Full reference
company_registrationsThe bridge between official-source operator IDs (Texas P-5, New Mexico OGRID, and each region's equivalent) and our canonical company register: normally one row per (region, registration ID), carrying the name as registered, registration status, role flags (operator / gatherer / midstream), and headquarters as filed.organization_id links to the company register once the operator is resolved. Where the company behind an ID was renamed, the ID carries one row per period instead (see valid_from / valid_to) so that filings made before and after the rename are attributed to the right company. Some IDs that were transferred to an acquiring company in the regulator's own records are split the same way. A few IDs created for a buyer at an acquisition, where the regulator recorded production from before it under the new ID, are split the same way.
Key fields: region, registration_id, registered_name, status, organization_id
· 19 fields in all
· Full reference
Group a timeline by state, supply area, county or company. Company leaderboards rank your selection and carry each row’s source-published share, so provenance stays visible. A benchmark endpoint serves our monthly totals beside the EIA’s, for the United States or the states you select.
Typical and high publication-to-live times, with the evidence basis stated on each row. Every data response also carries its own as-of date.
The catalog lists each extract’s region, table, row count, size and data version. Issuing a download counts the extract’s rows once: against the monthly records allowance on a plan that includes one, and against the rolling 24-hour ceiling on a plan that does not.
Load an extract once, then apply upserts and deletes at the table’s own grain. A batch collapses each record to its latest state, so a mirror stays current without re-downloading.
A renamed company’s old id keeps working. Leaderboards fold what a company has absorbed into it as the register stands today, and every company-resolved response names the register version it read.
Point your AI tool at api.commovision.com/mcp and it can list wells and pull production. The reference is also published as plain markdown, so an AI tool can read the docs directly.
On a trial, well-level data answers inside your trial’s areas and the aggregate views answer everywhere; bulk extracts and the change feed come with the paid API plans.
The Portal is open: filters, map and charts in one window, with dashboards from total production down to single-well cards. A well card shows a well’s full history and its forecast where it has one, and can show the wells around it. The Portal also carries saved views, watchlists, arrival alerts and CSV downloads.
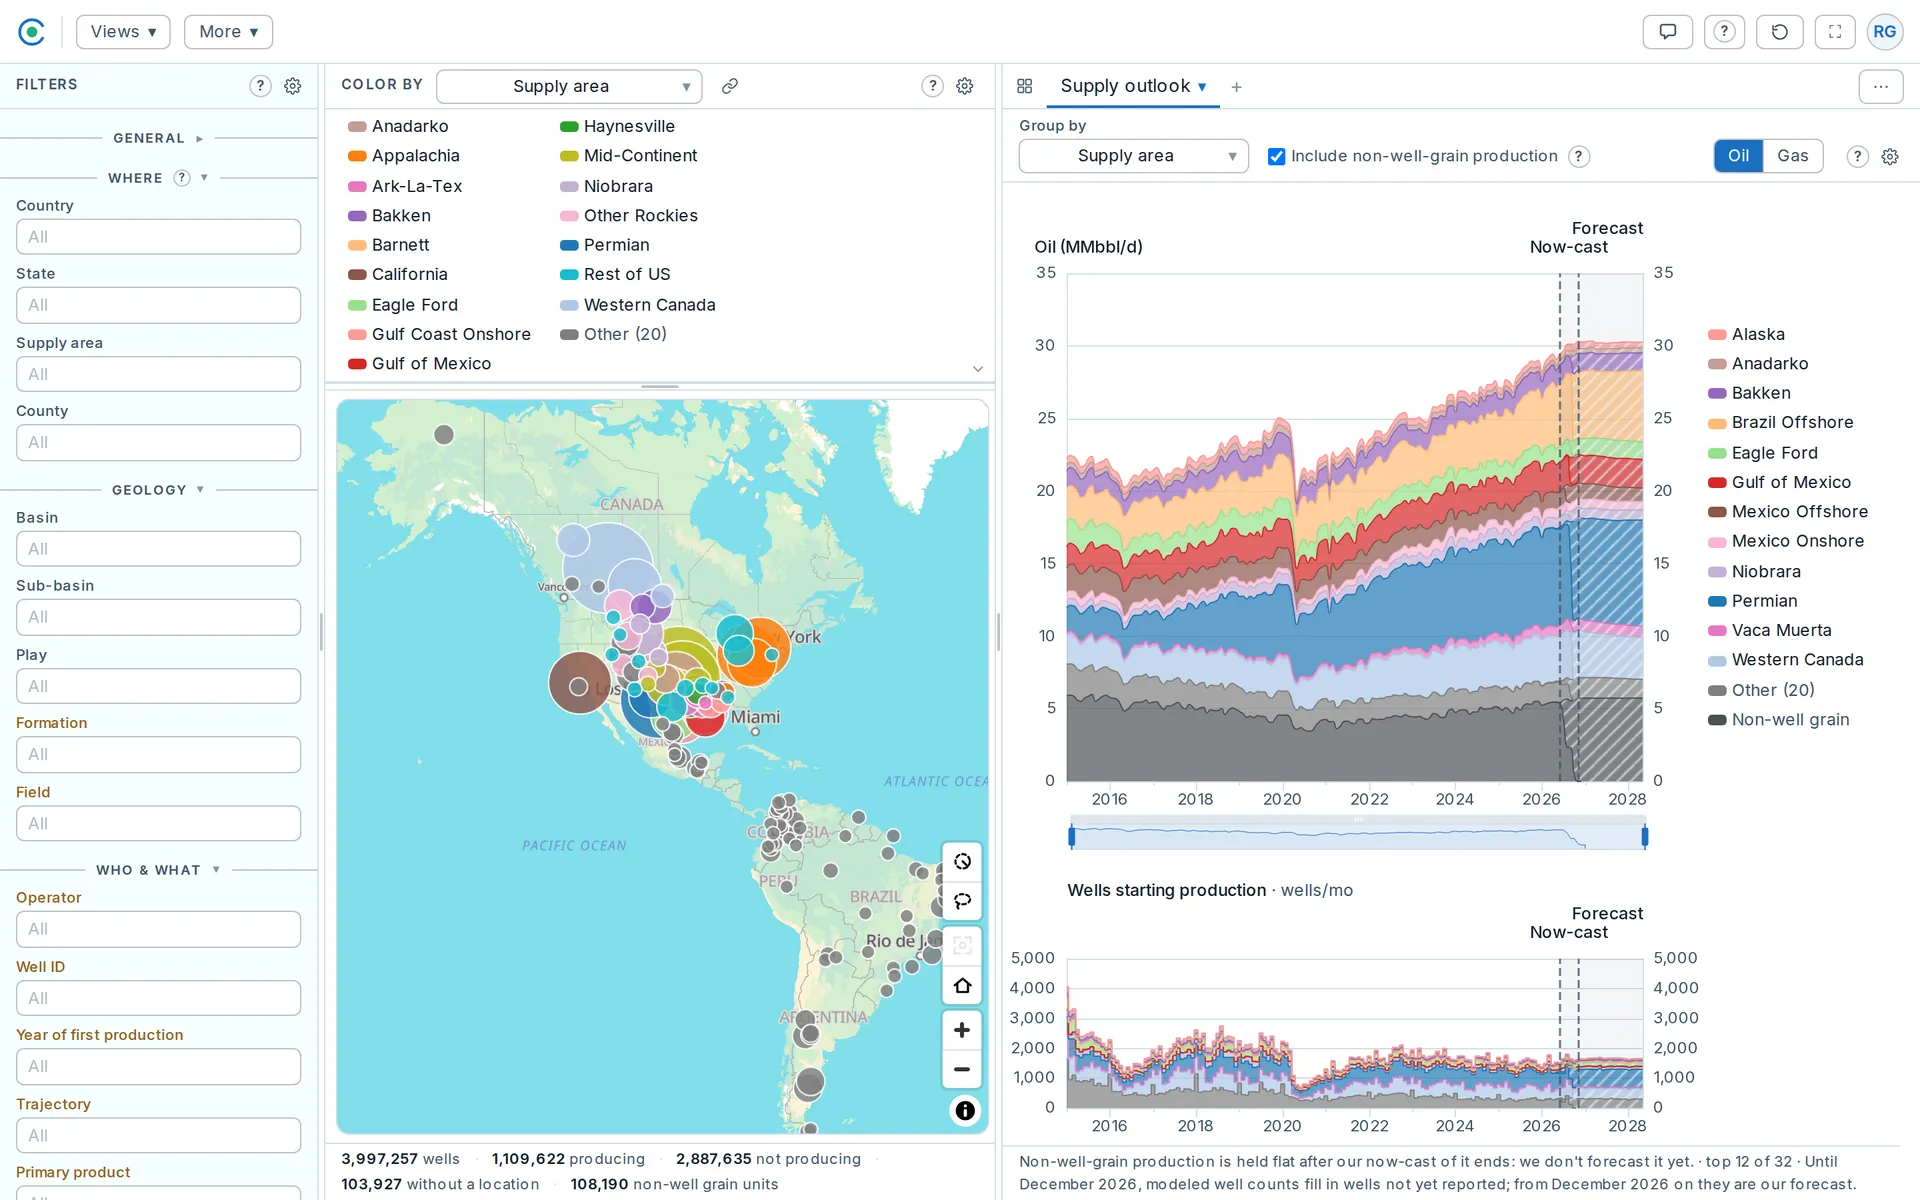
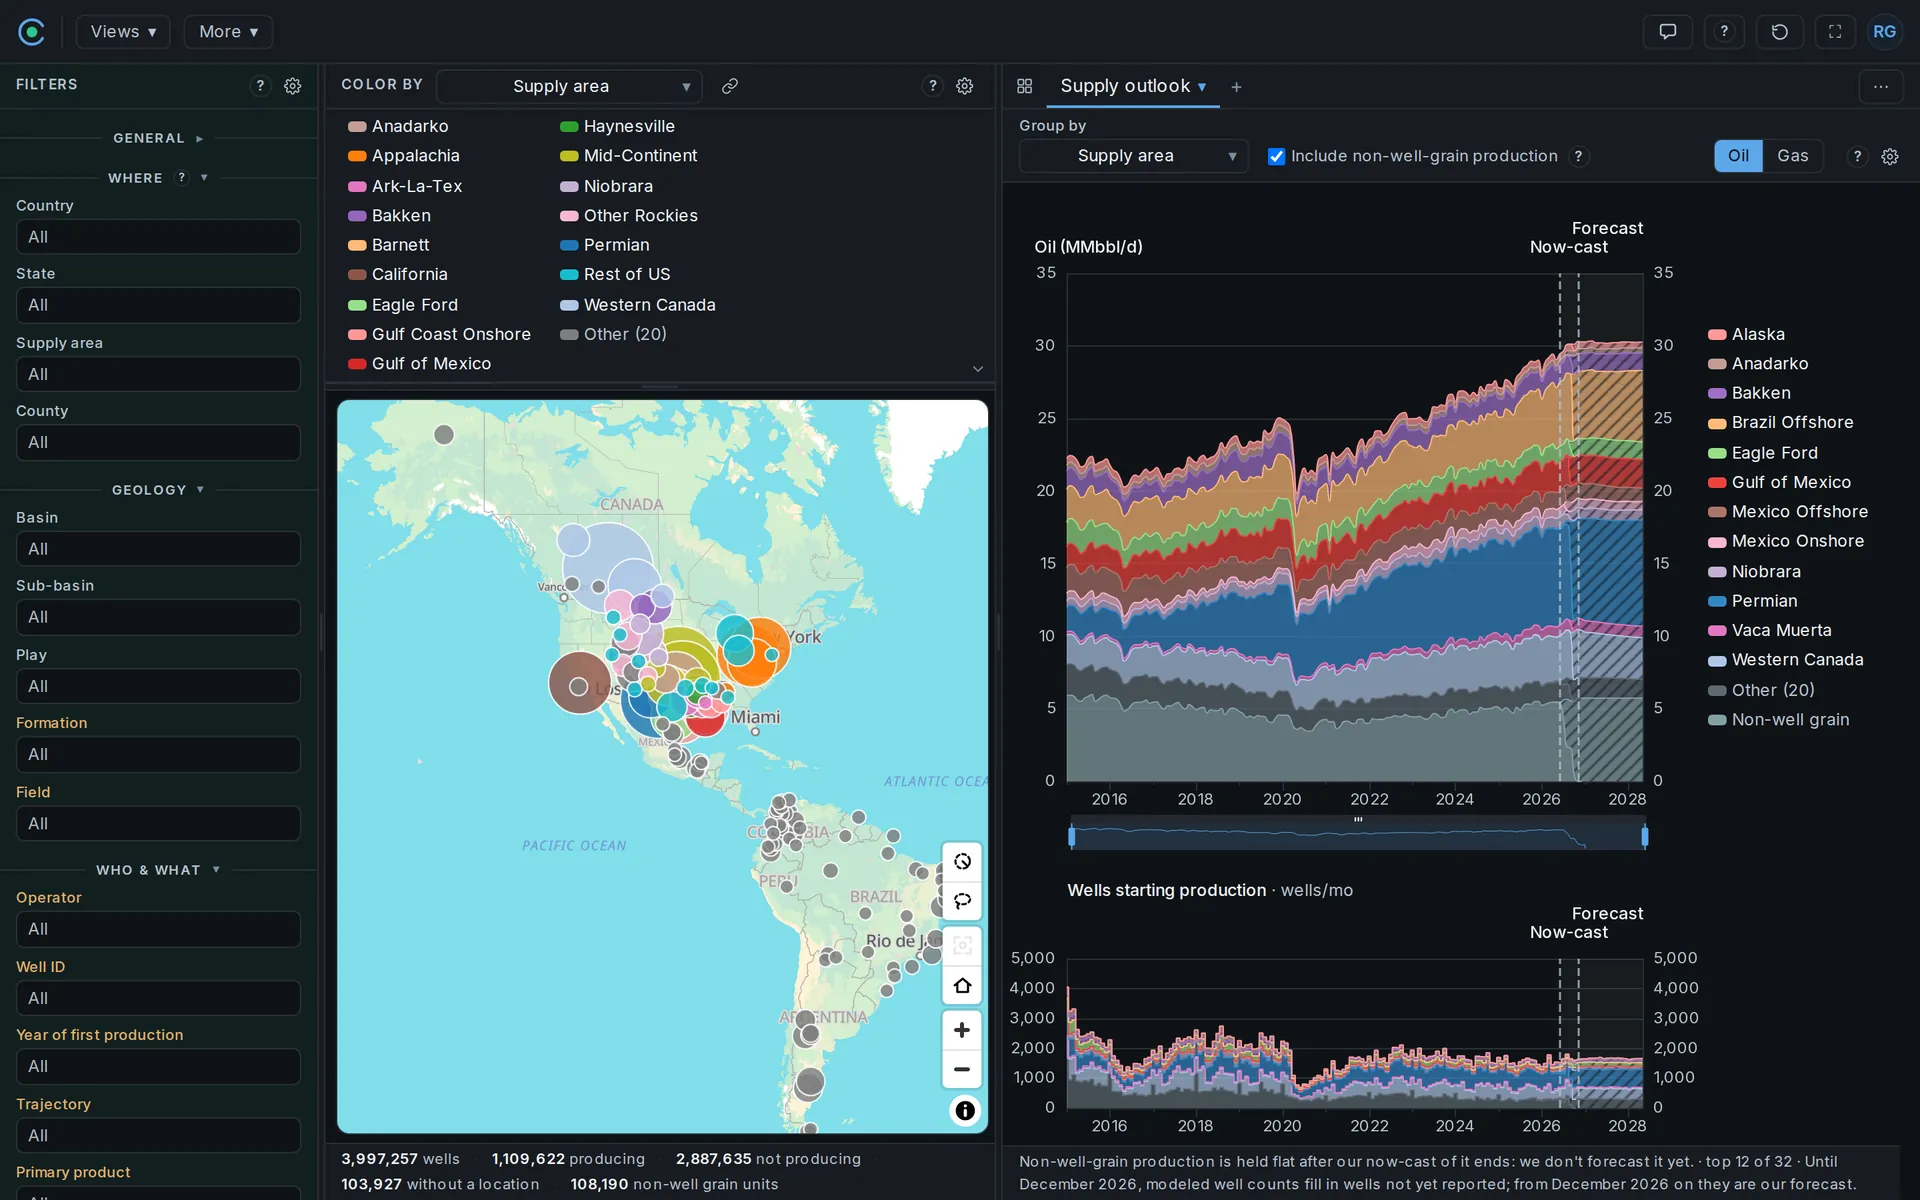
One window from the map pane, 110.7 km across: the Midland Basin core colored by current operator; a solid line traces an as-drilled directional survey, a dashed or dotted one a well whose path we hold less of.
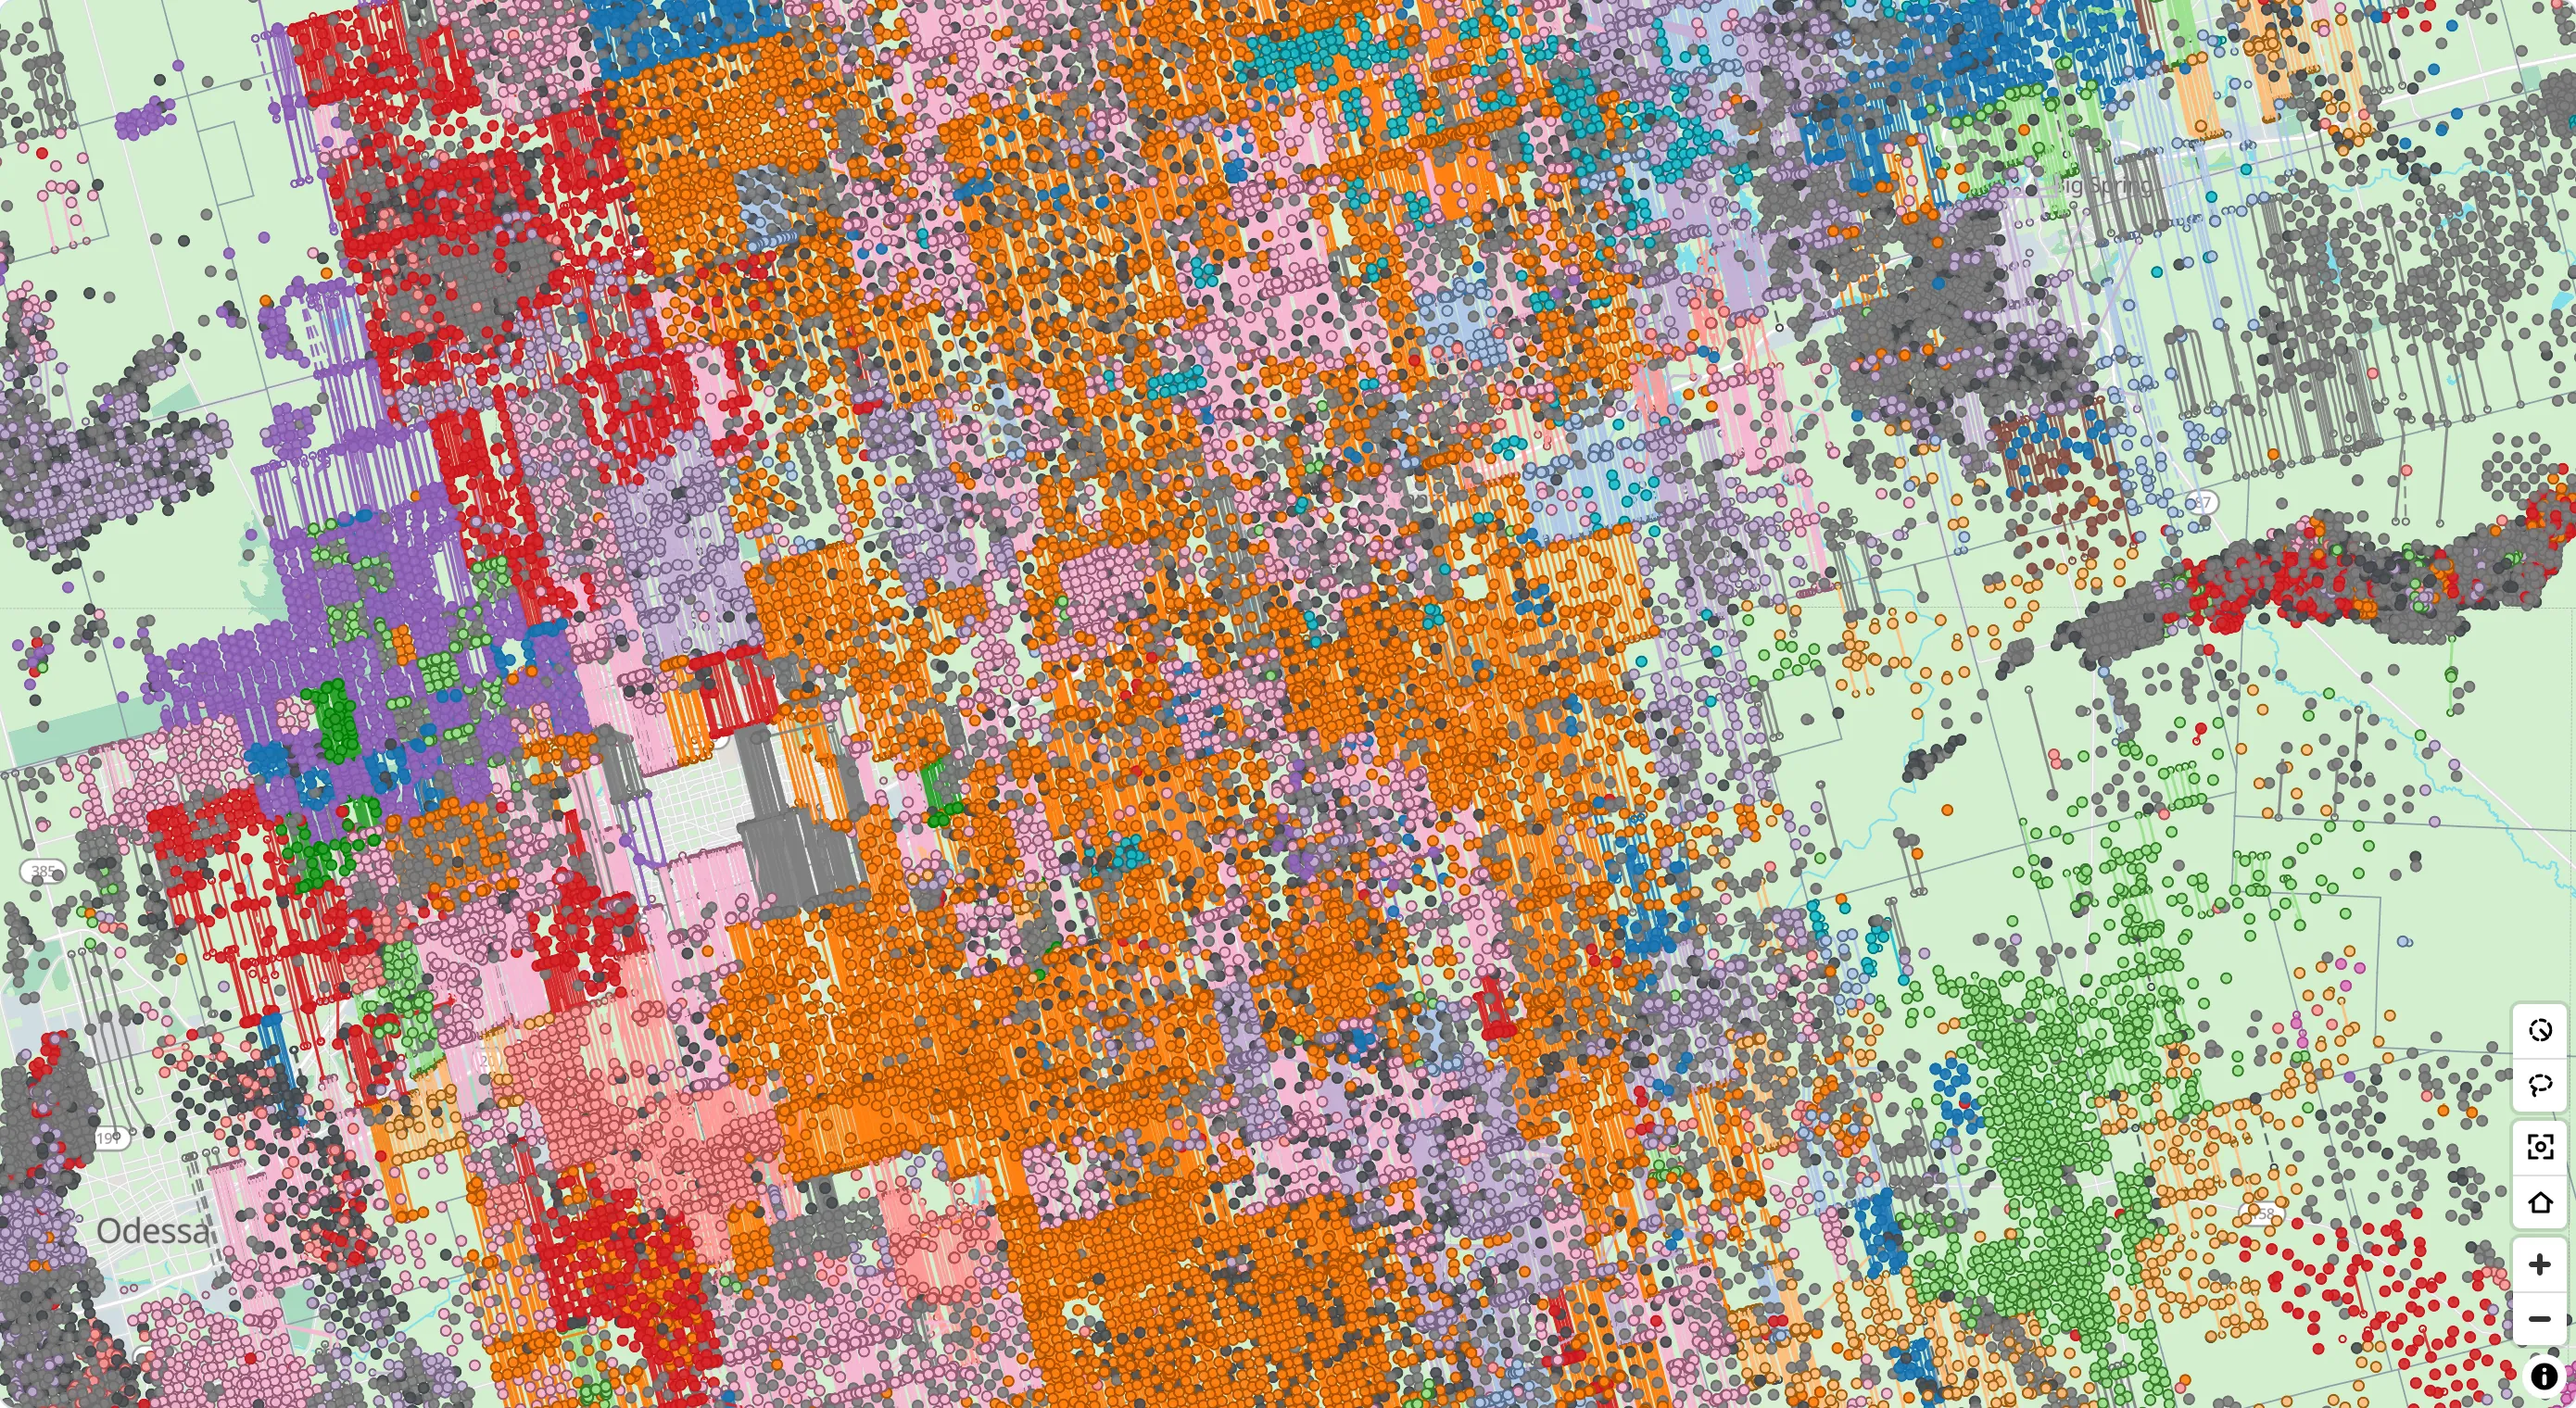
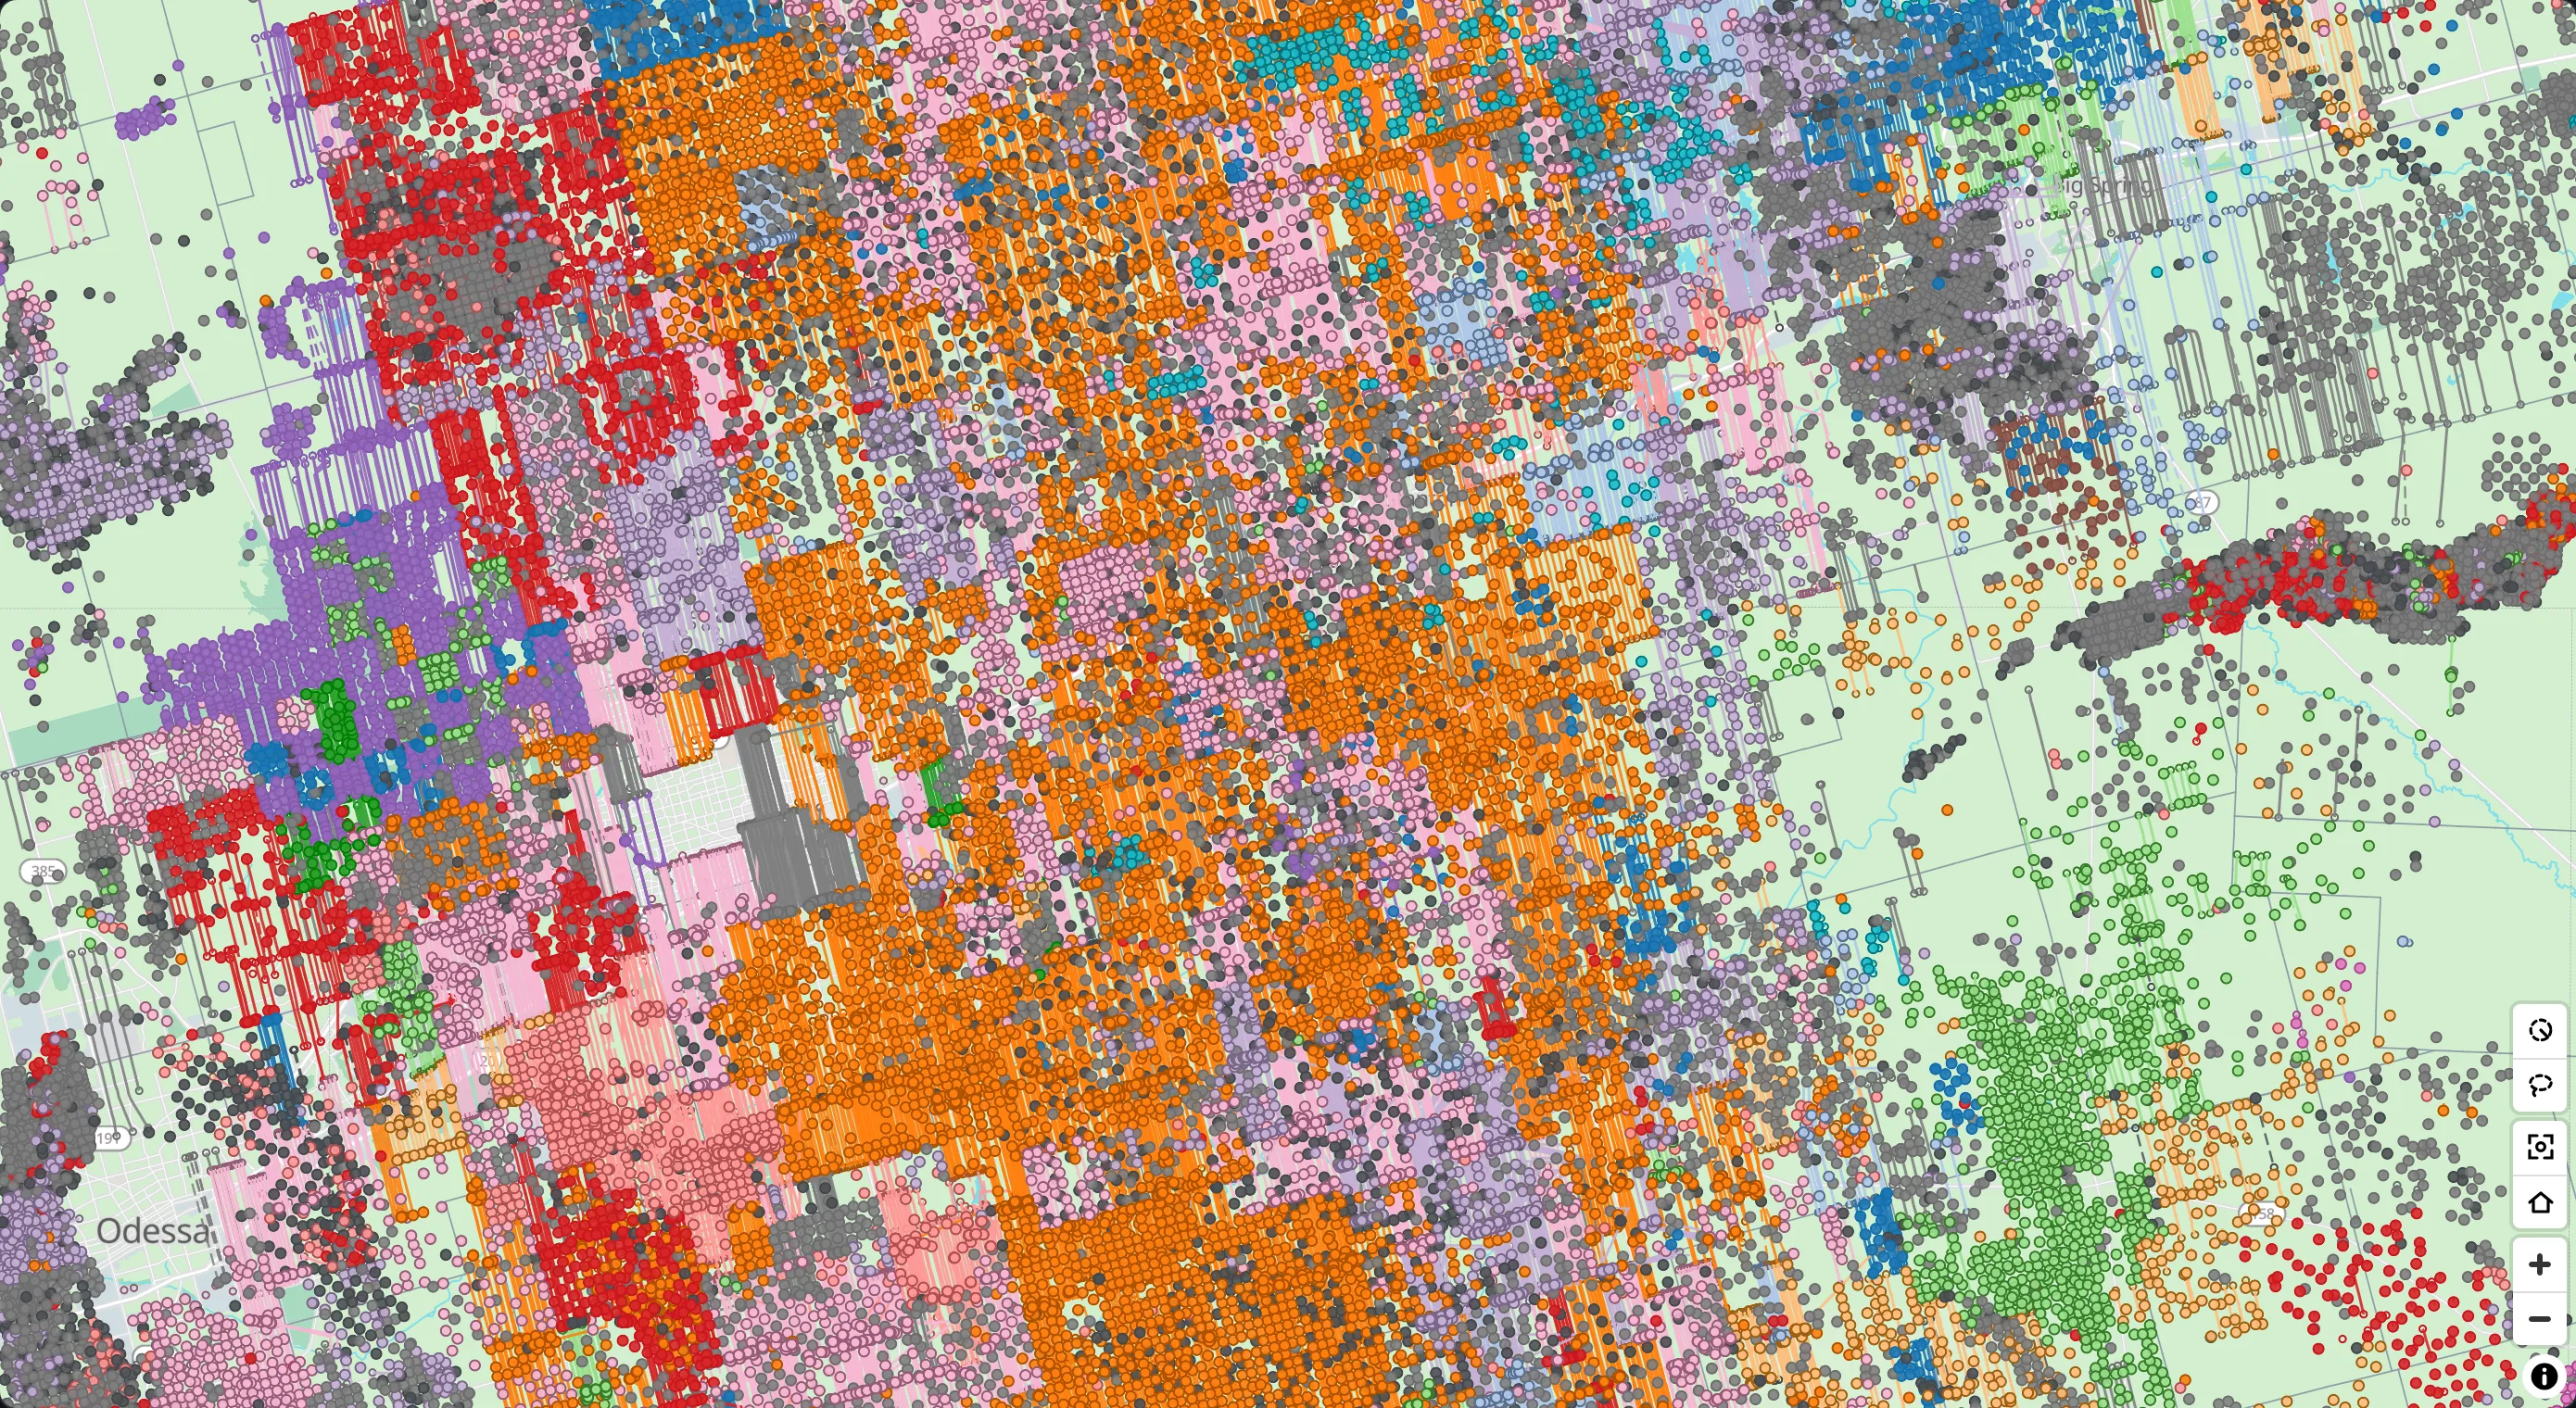
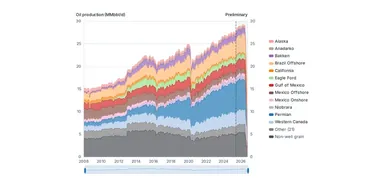
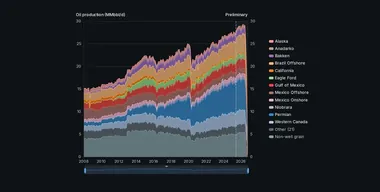 Monthly oil or gas for any selection, stacked by the grouping you pick.
Show it as reported, with the part not yet filed estimated, or with existing wells carried forward. A companion chart counts the wells producing.
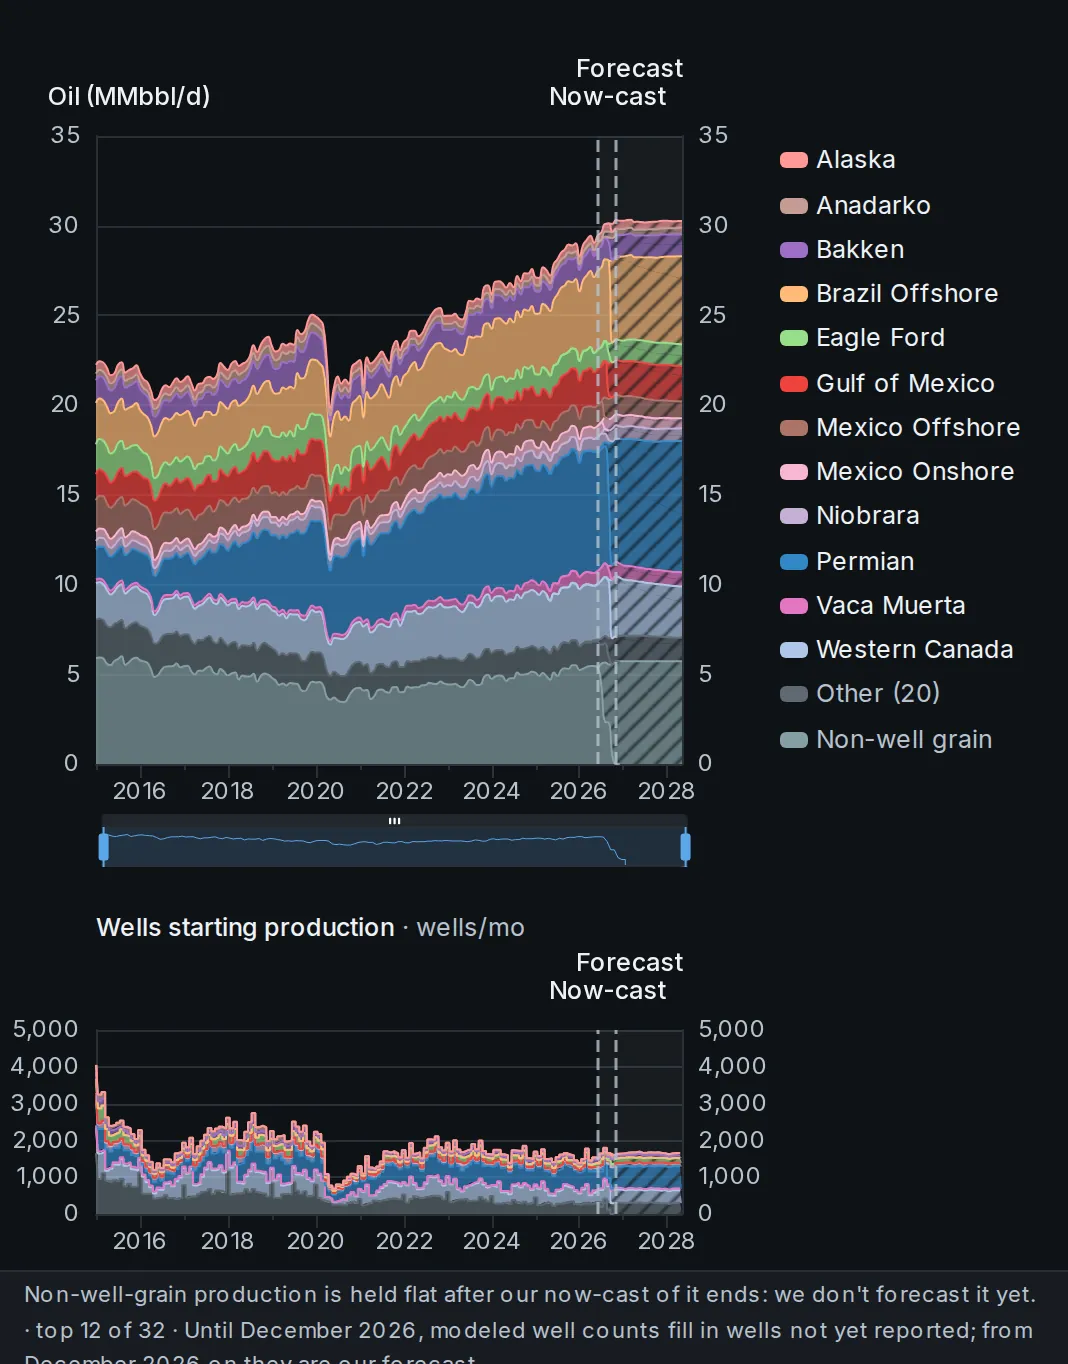
Total supply over time: reported production, the now-cast of the months still filling in, the decline of existing wells and the new wells expected to come online.
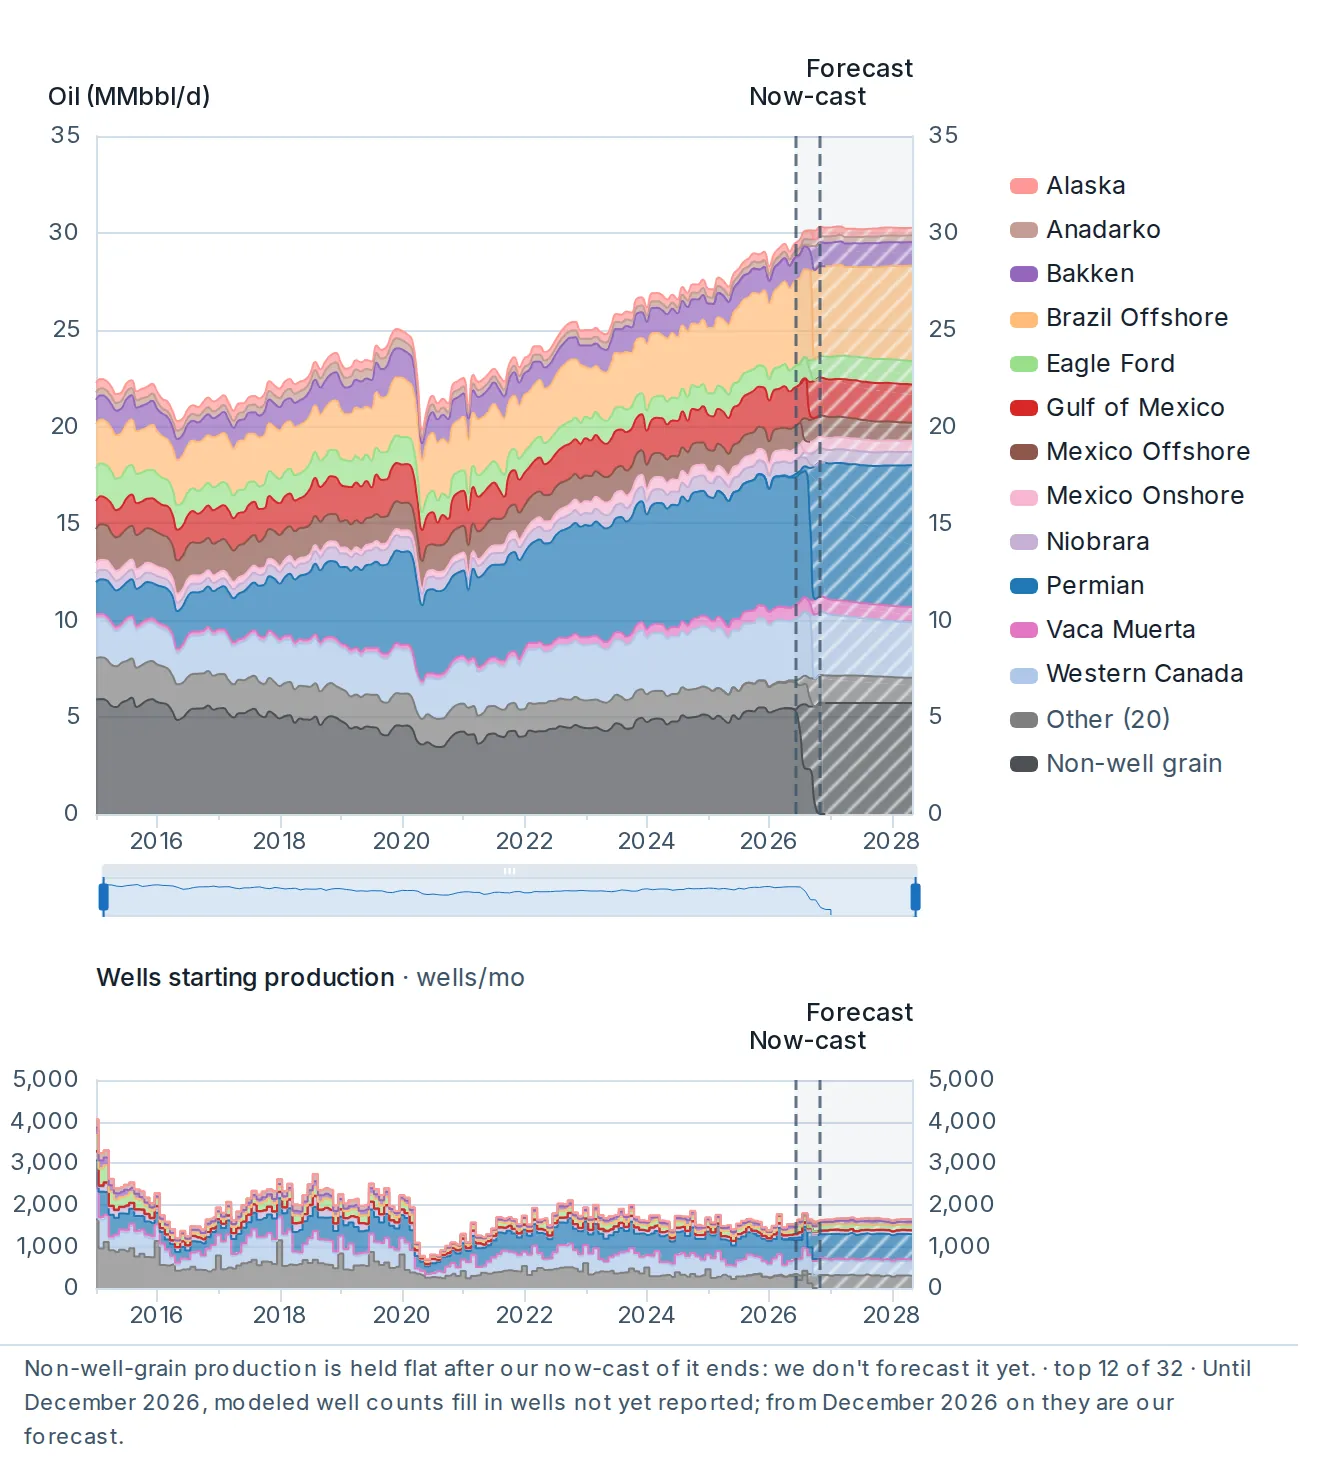
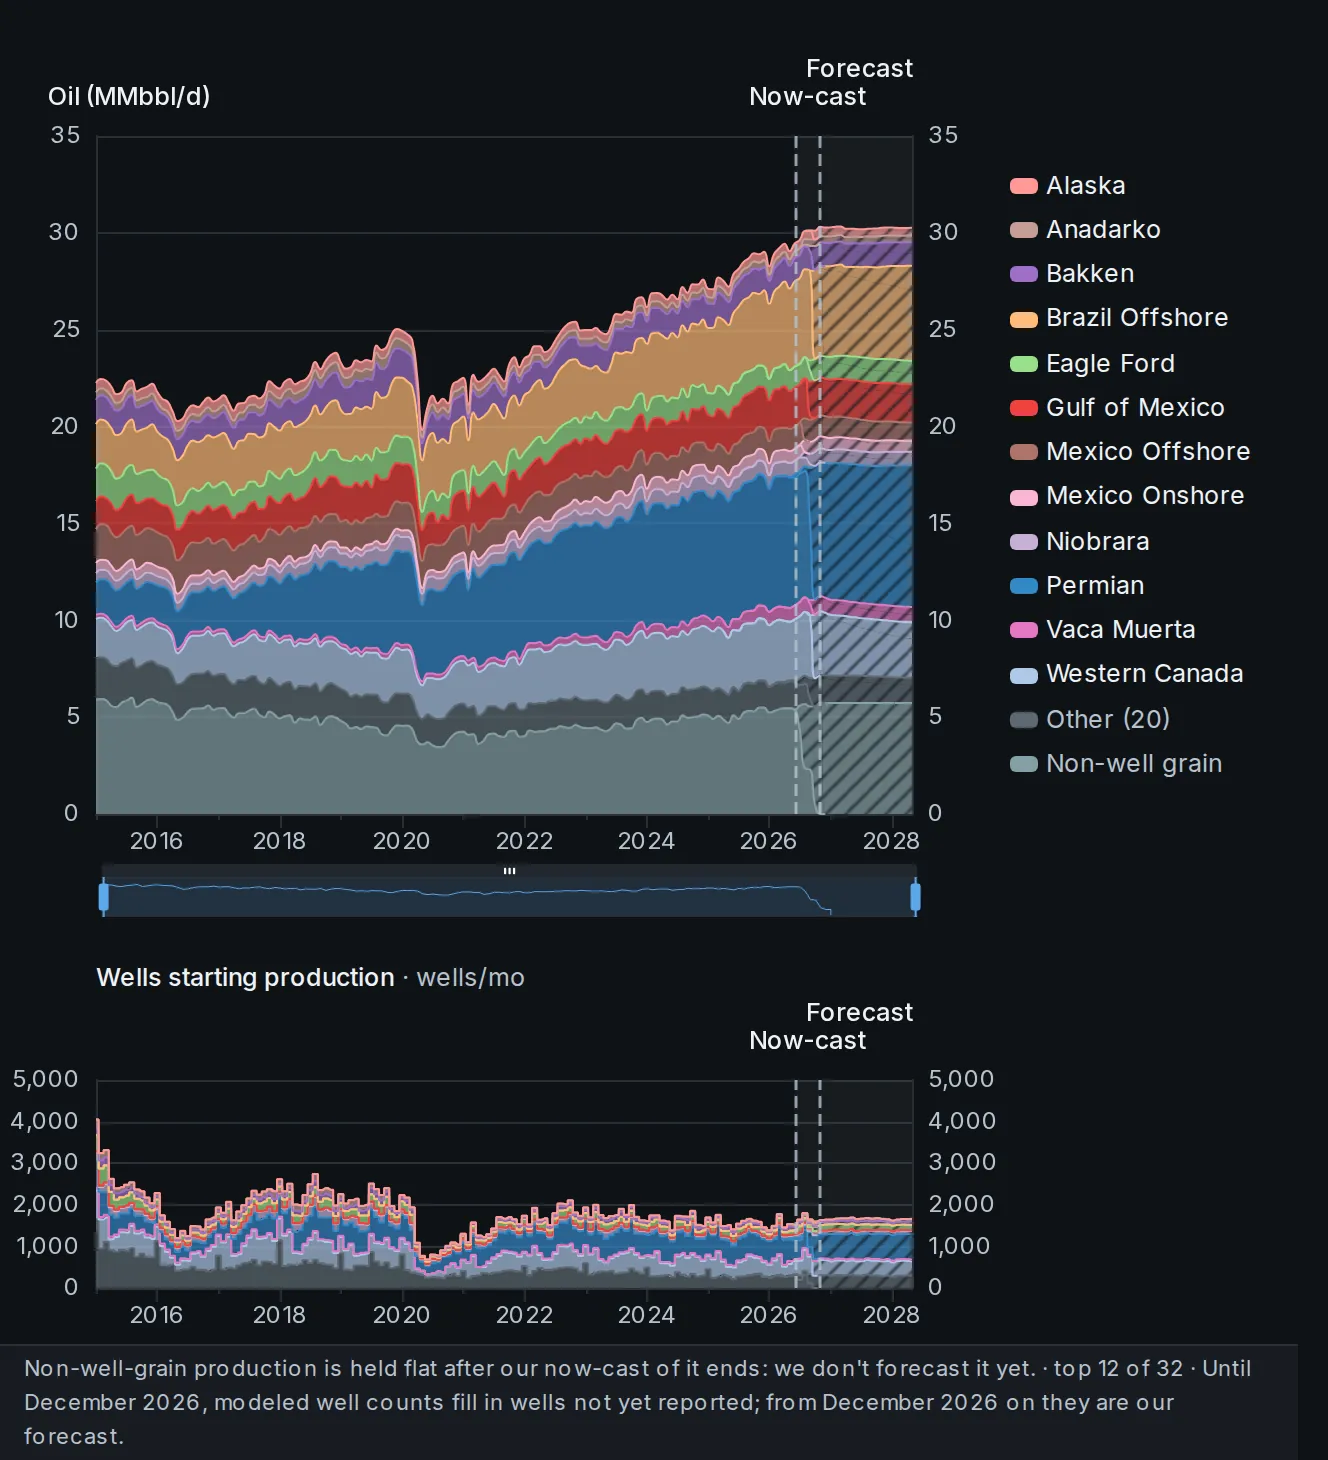
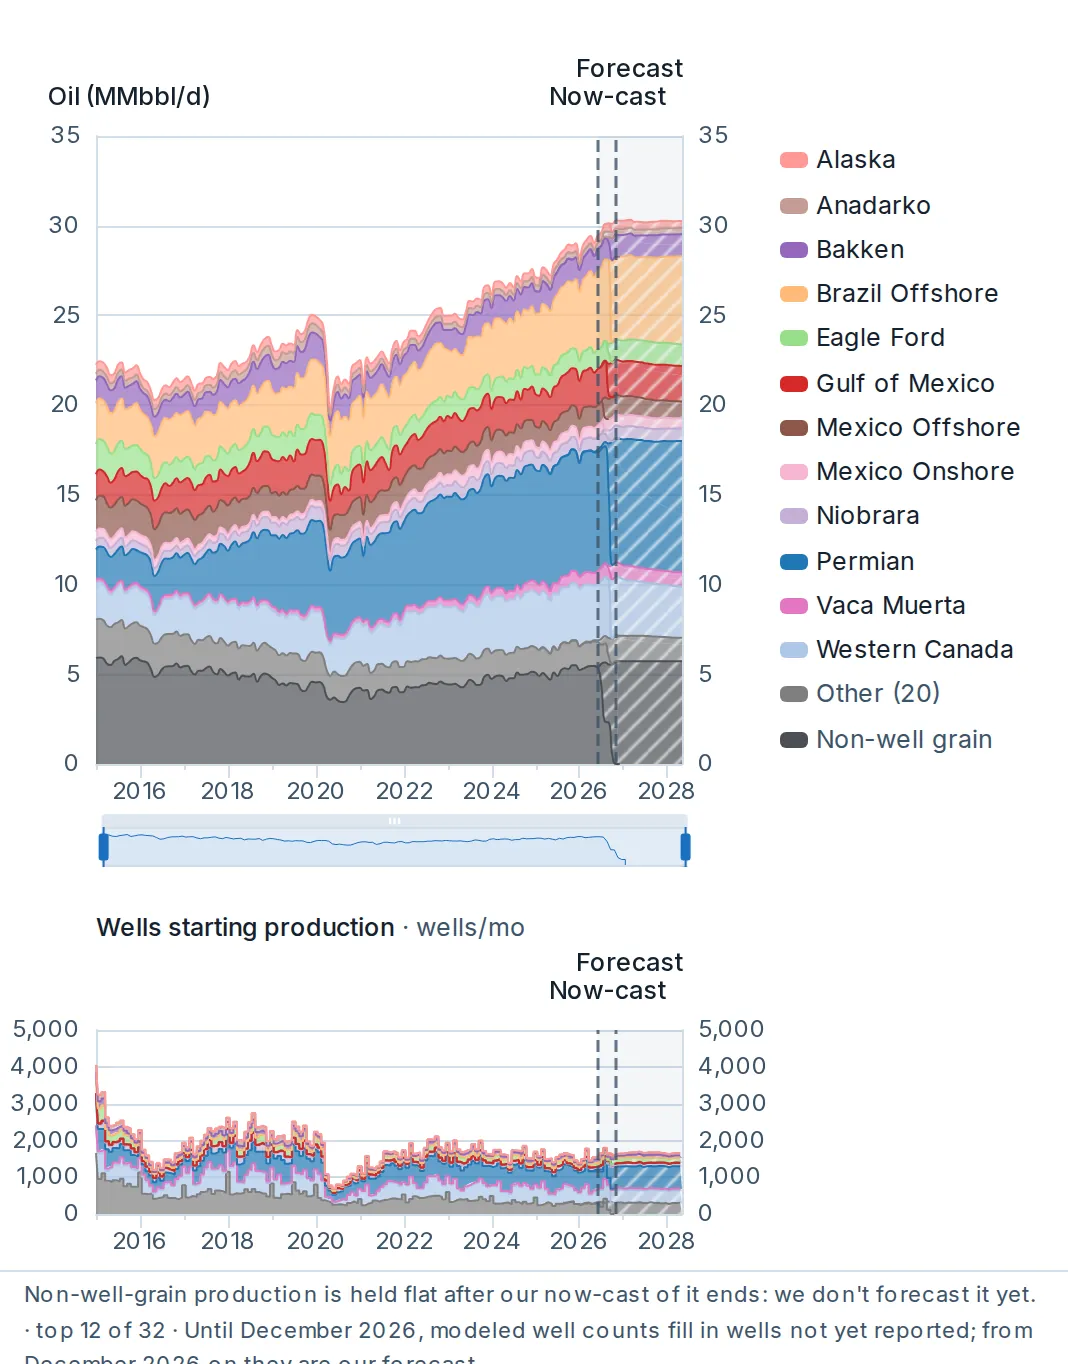
Total supply over time: reported production, the now-cast of the months still filling in, the decline of existing wells and the new wells expected to come online.
The modeled legs are the now-cast fill for wells that have not reported yet, the forward forecast for existing wells and the new-well schedule, stacked by how modeled they are. A chart below counts the wells starting production.
 Average well performance by cohort: rate, cumulative, or rate against cumulative.
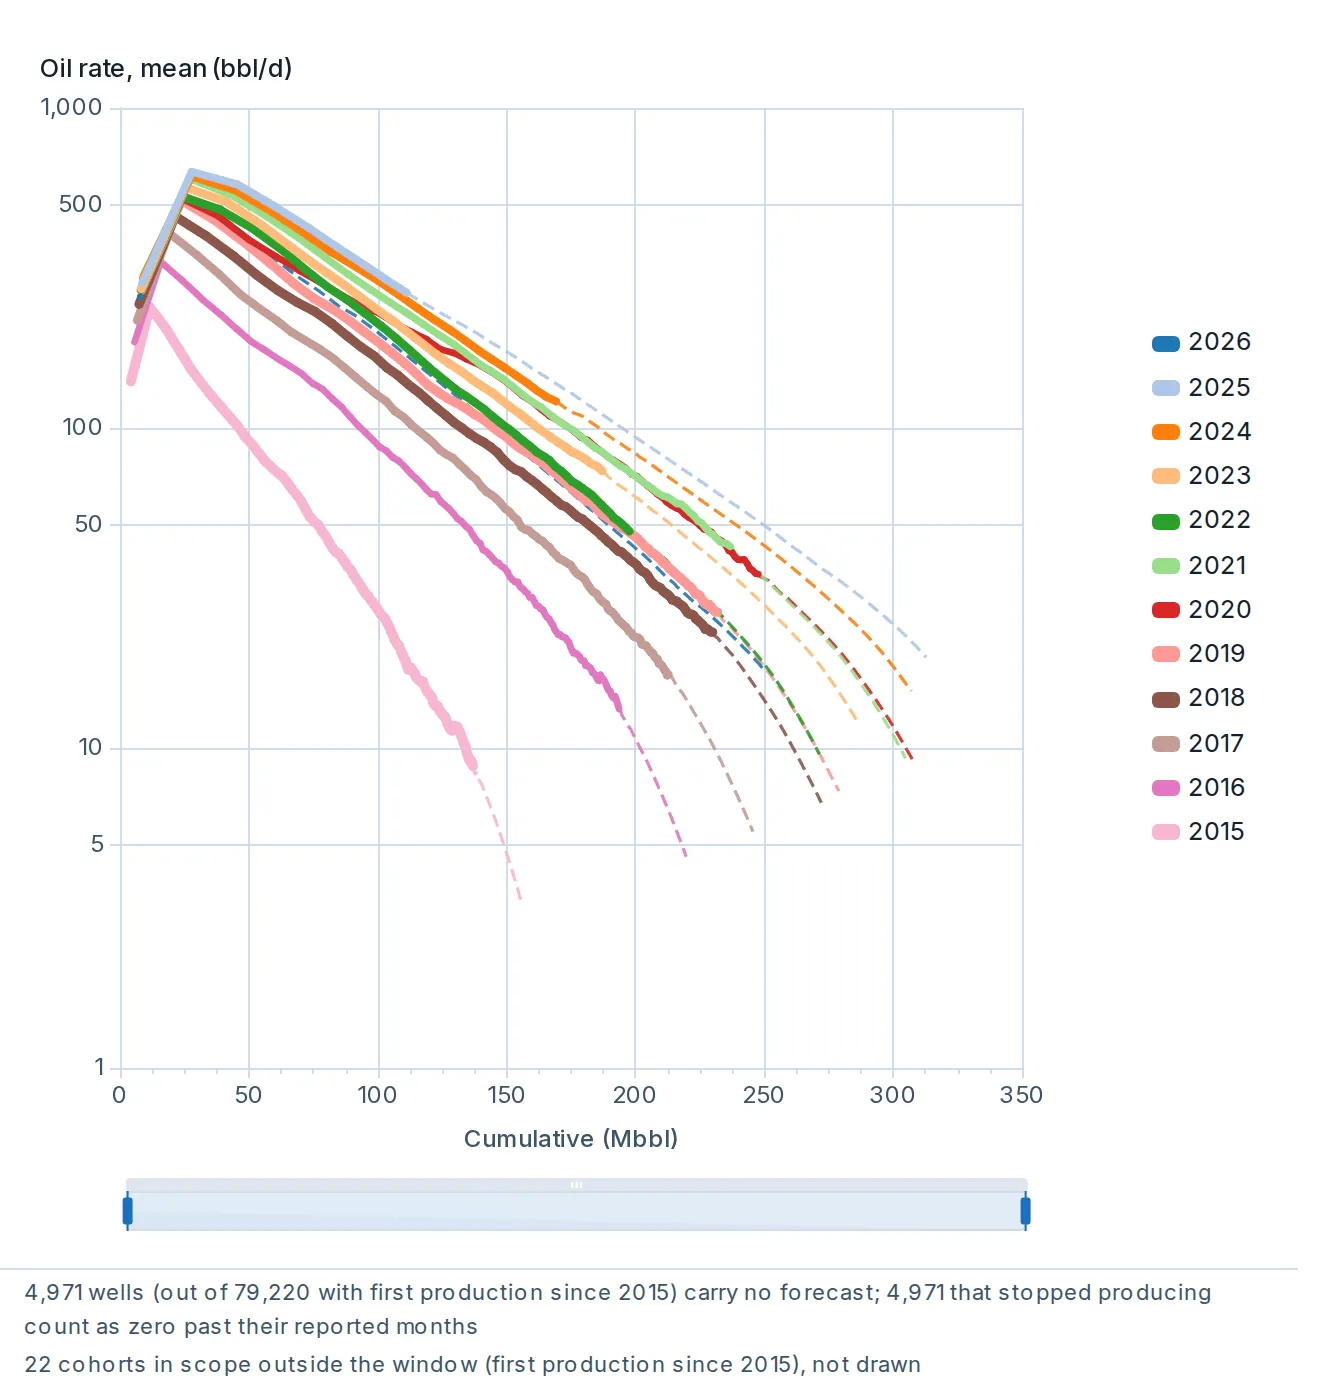
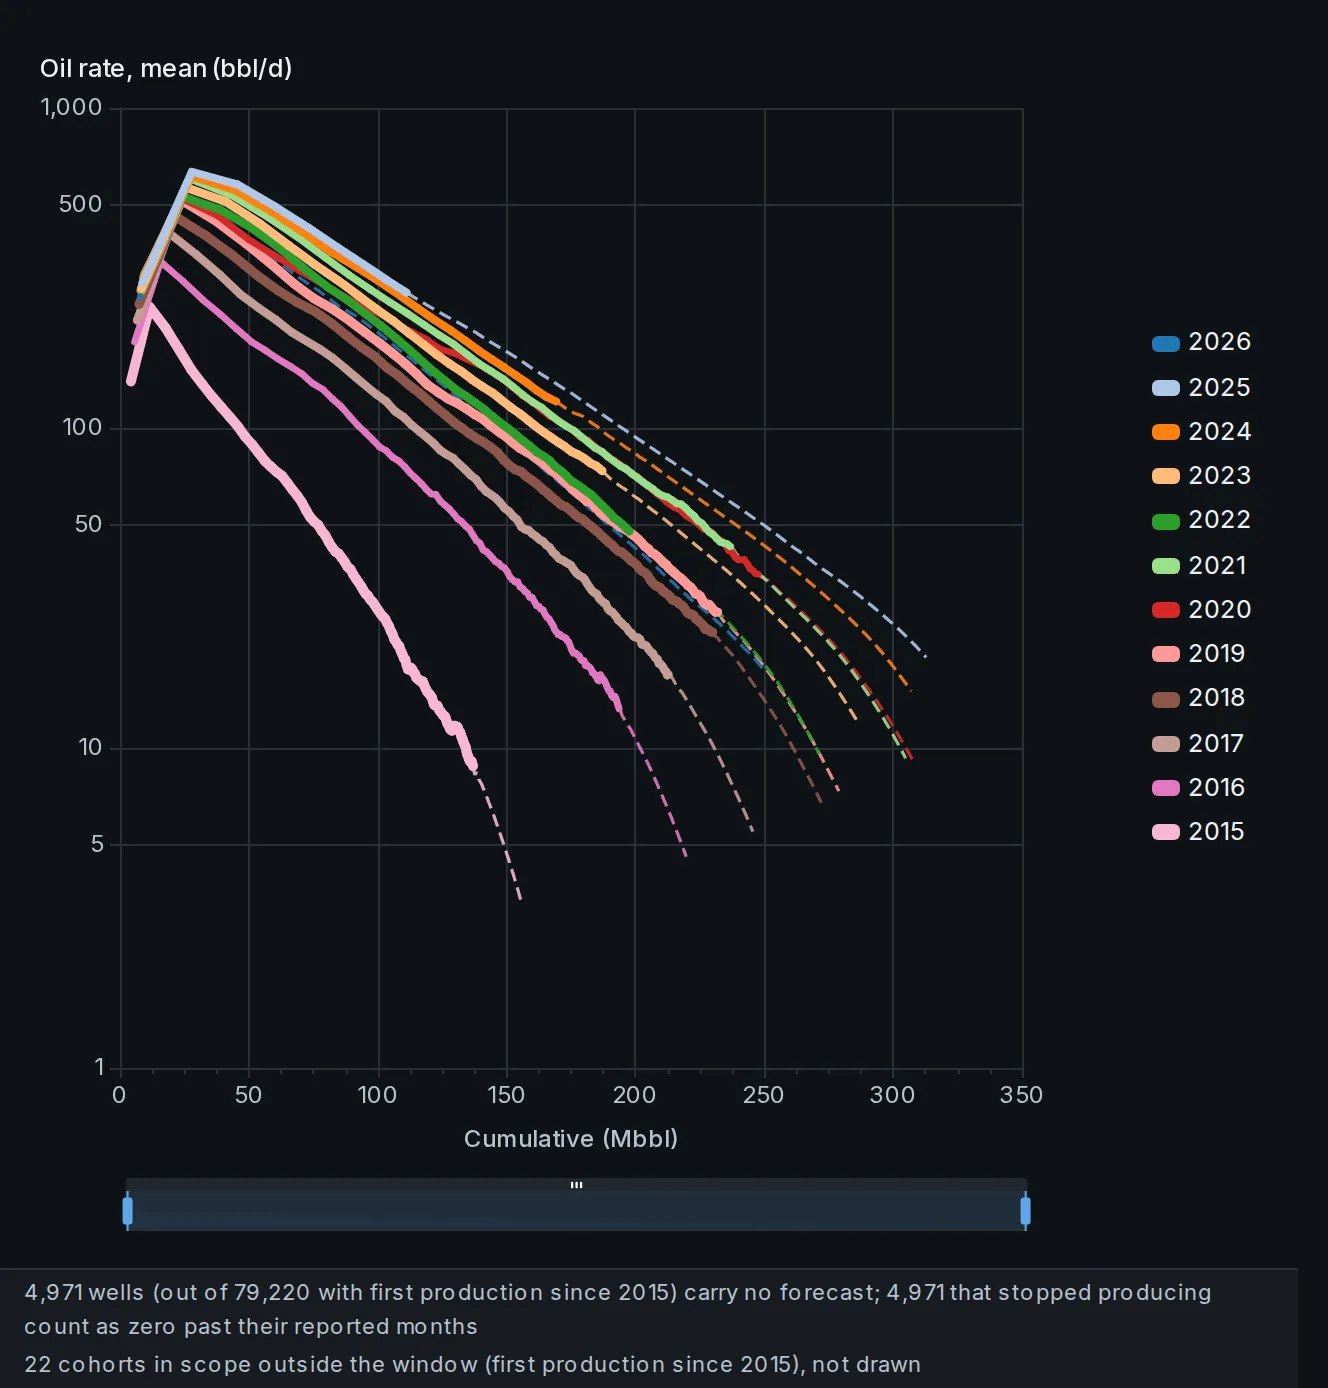
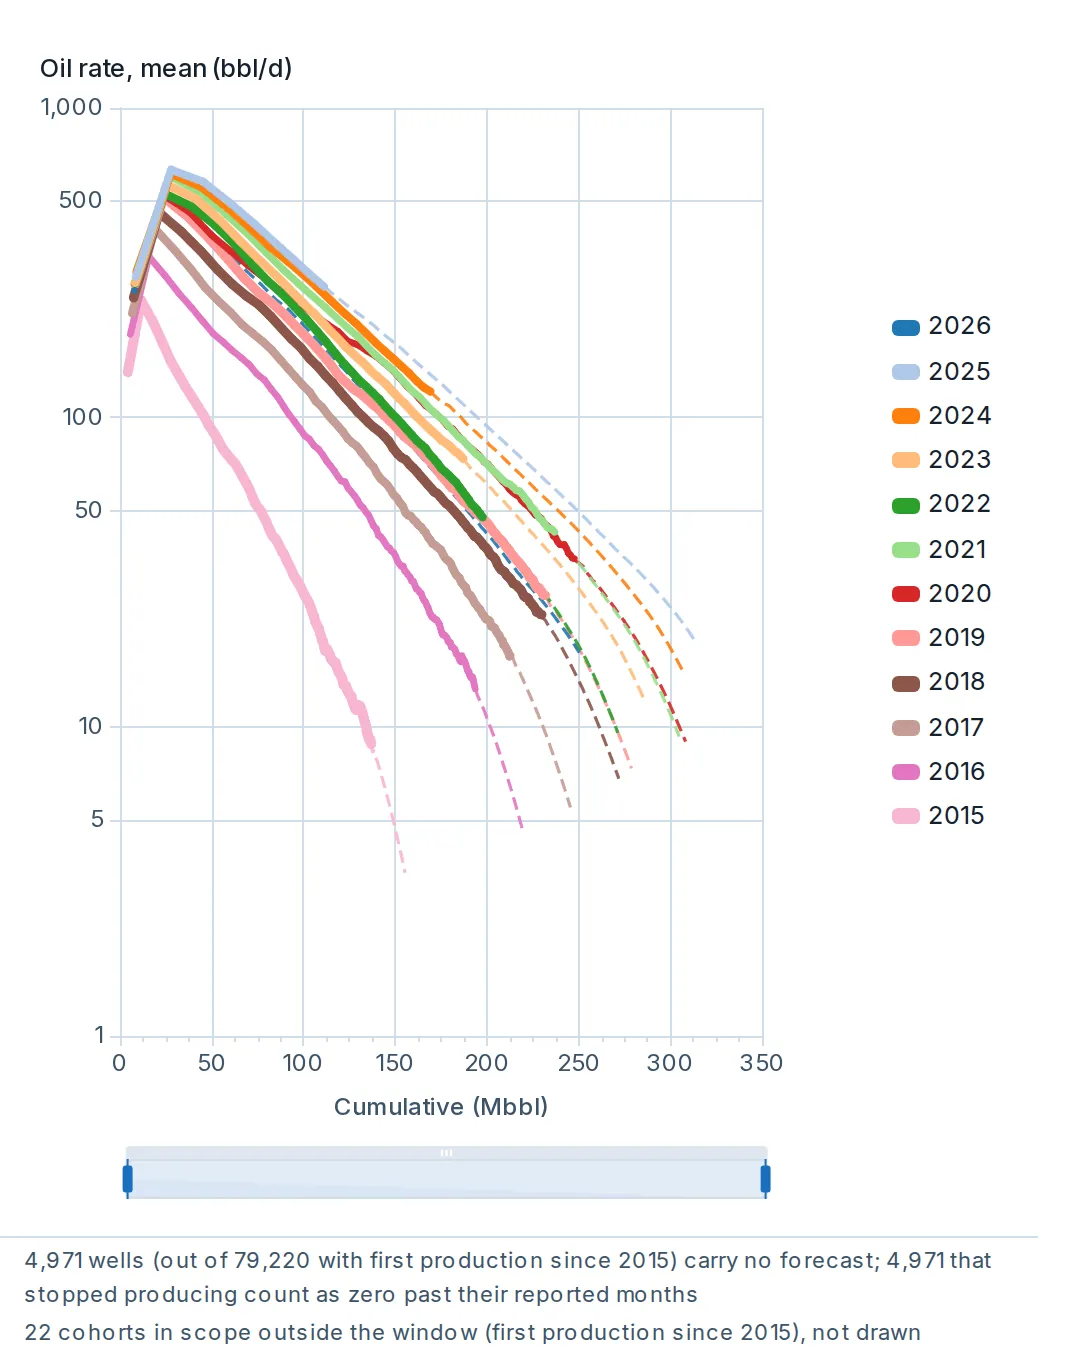
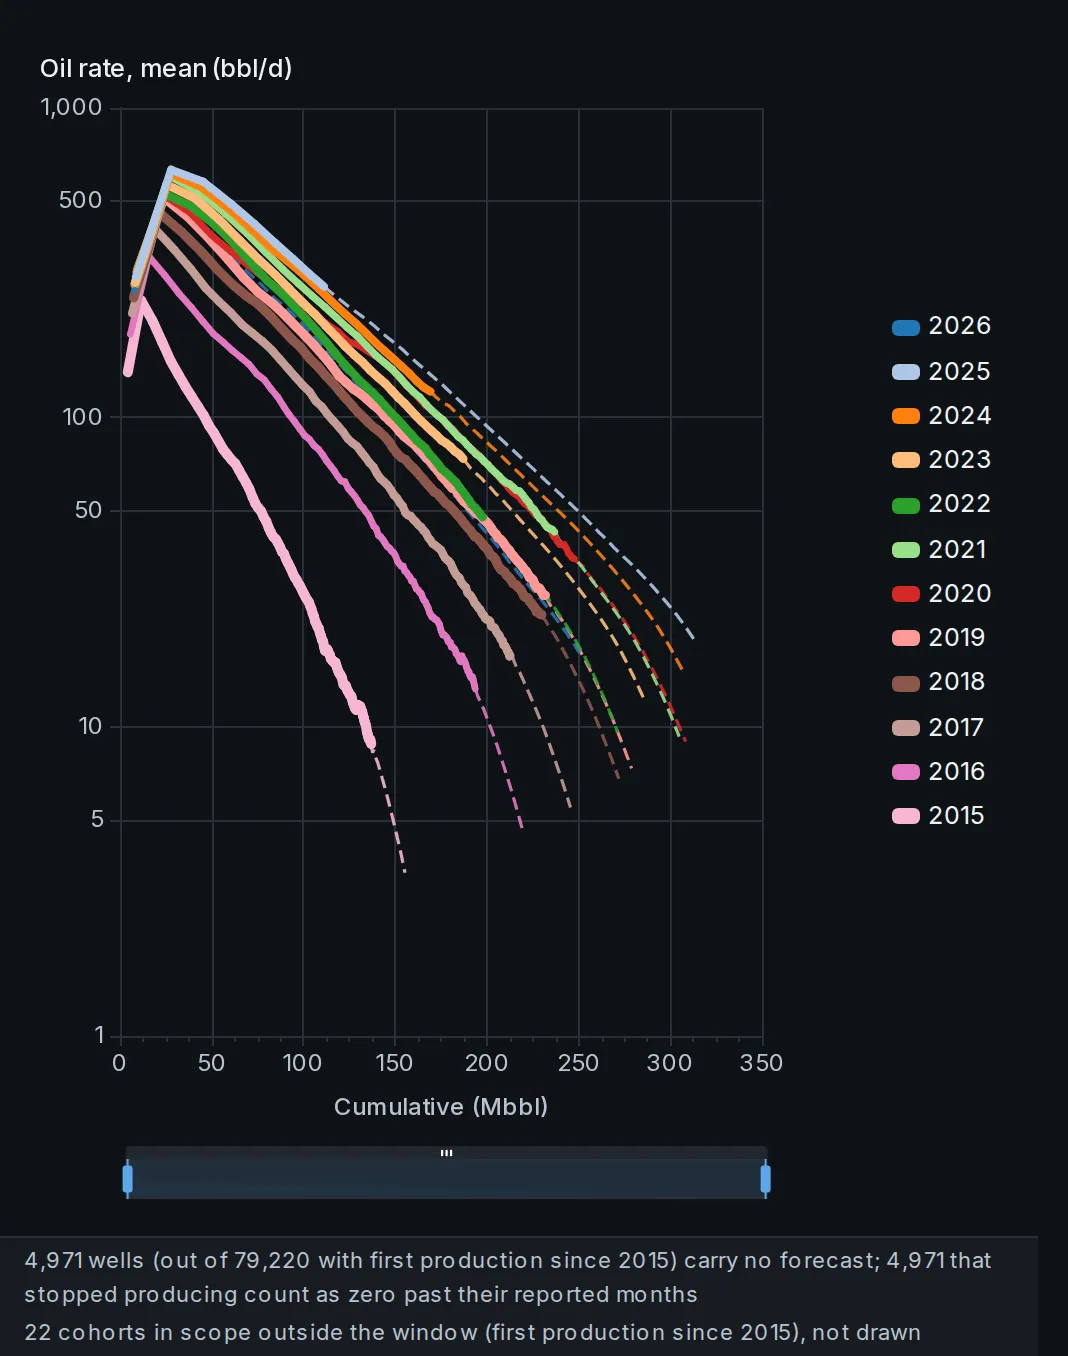
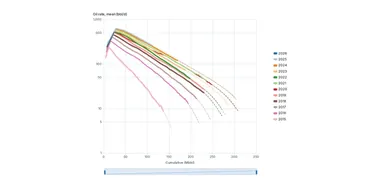
Average well performance by cohort: rate, cumulative, or rate against cumulative.
Cohorts default to the year of first production. Linear or log scale, and a forecast toggle draws the per-well forecast beyond the reported months, dashed.
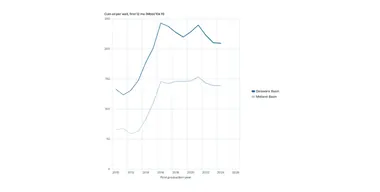
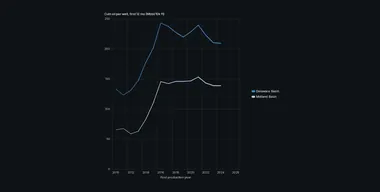 Cumulative production per well by first-production year, for any grouping.
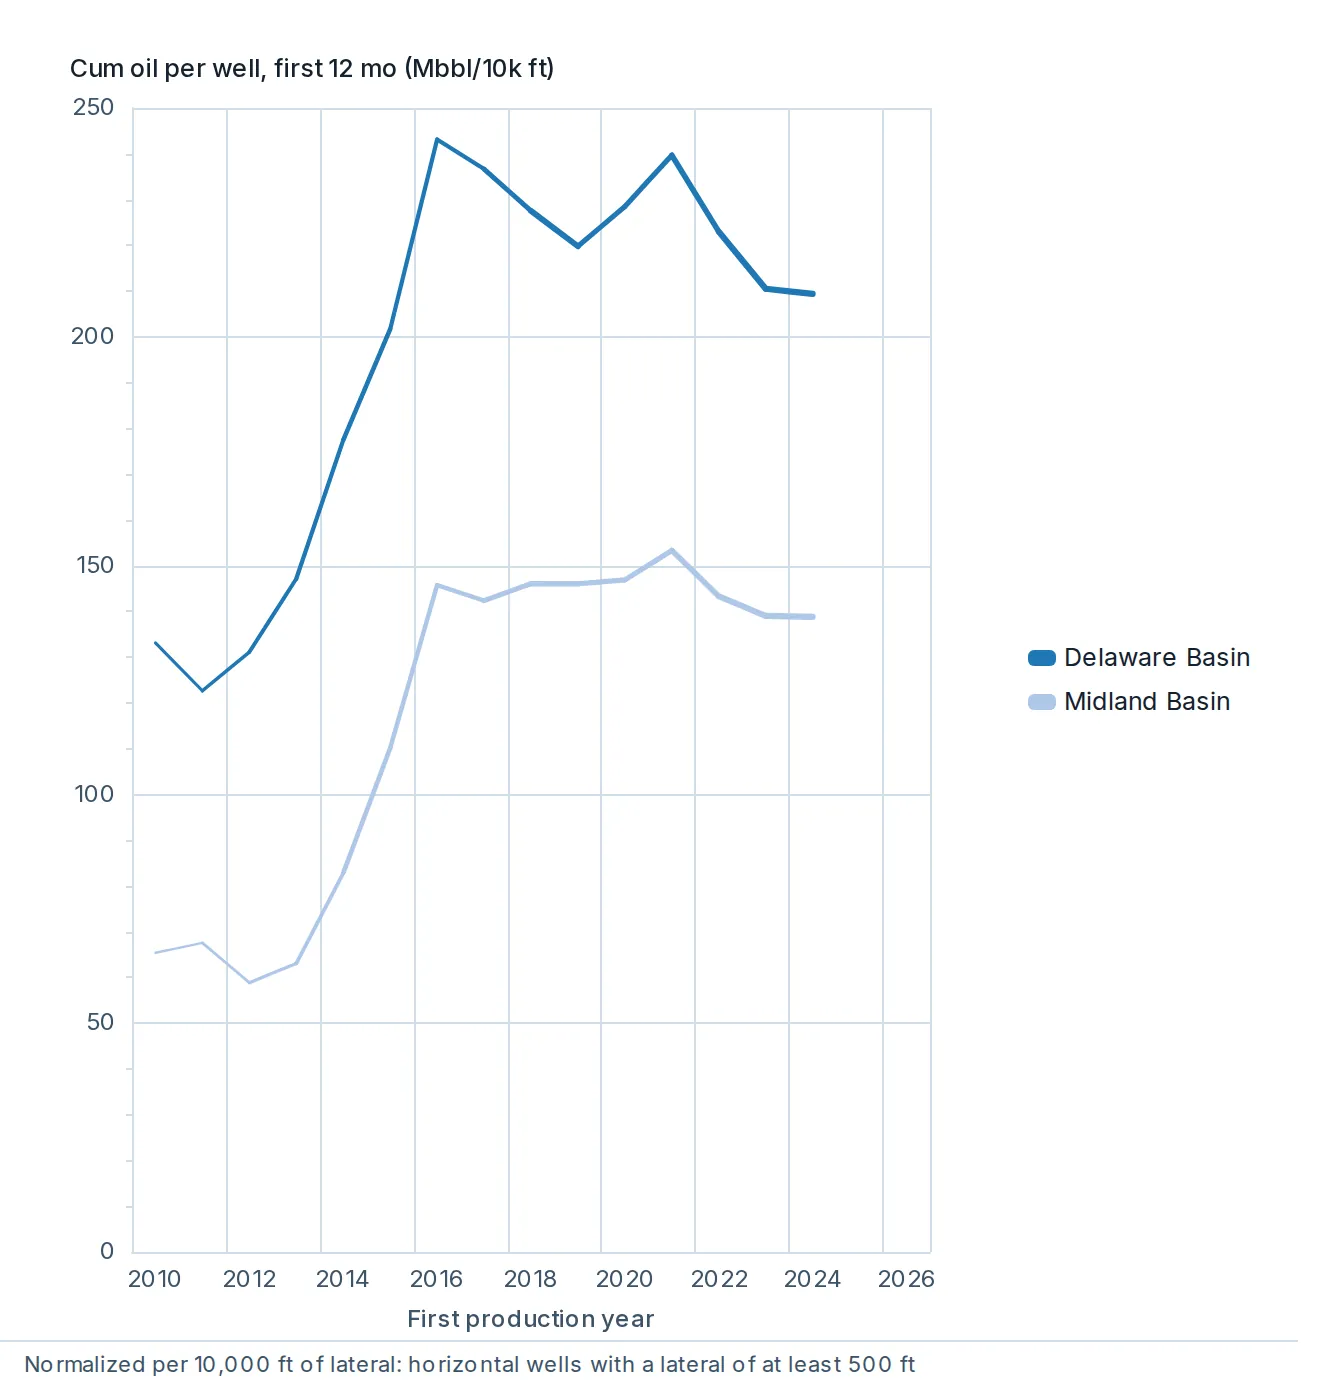
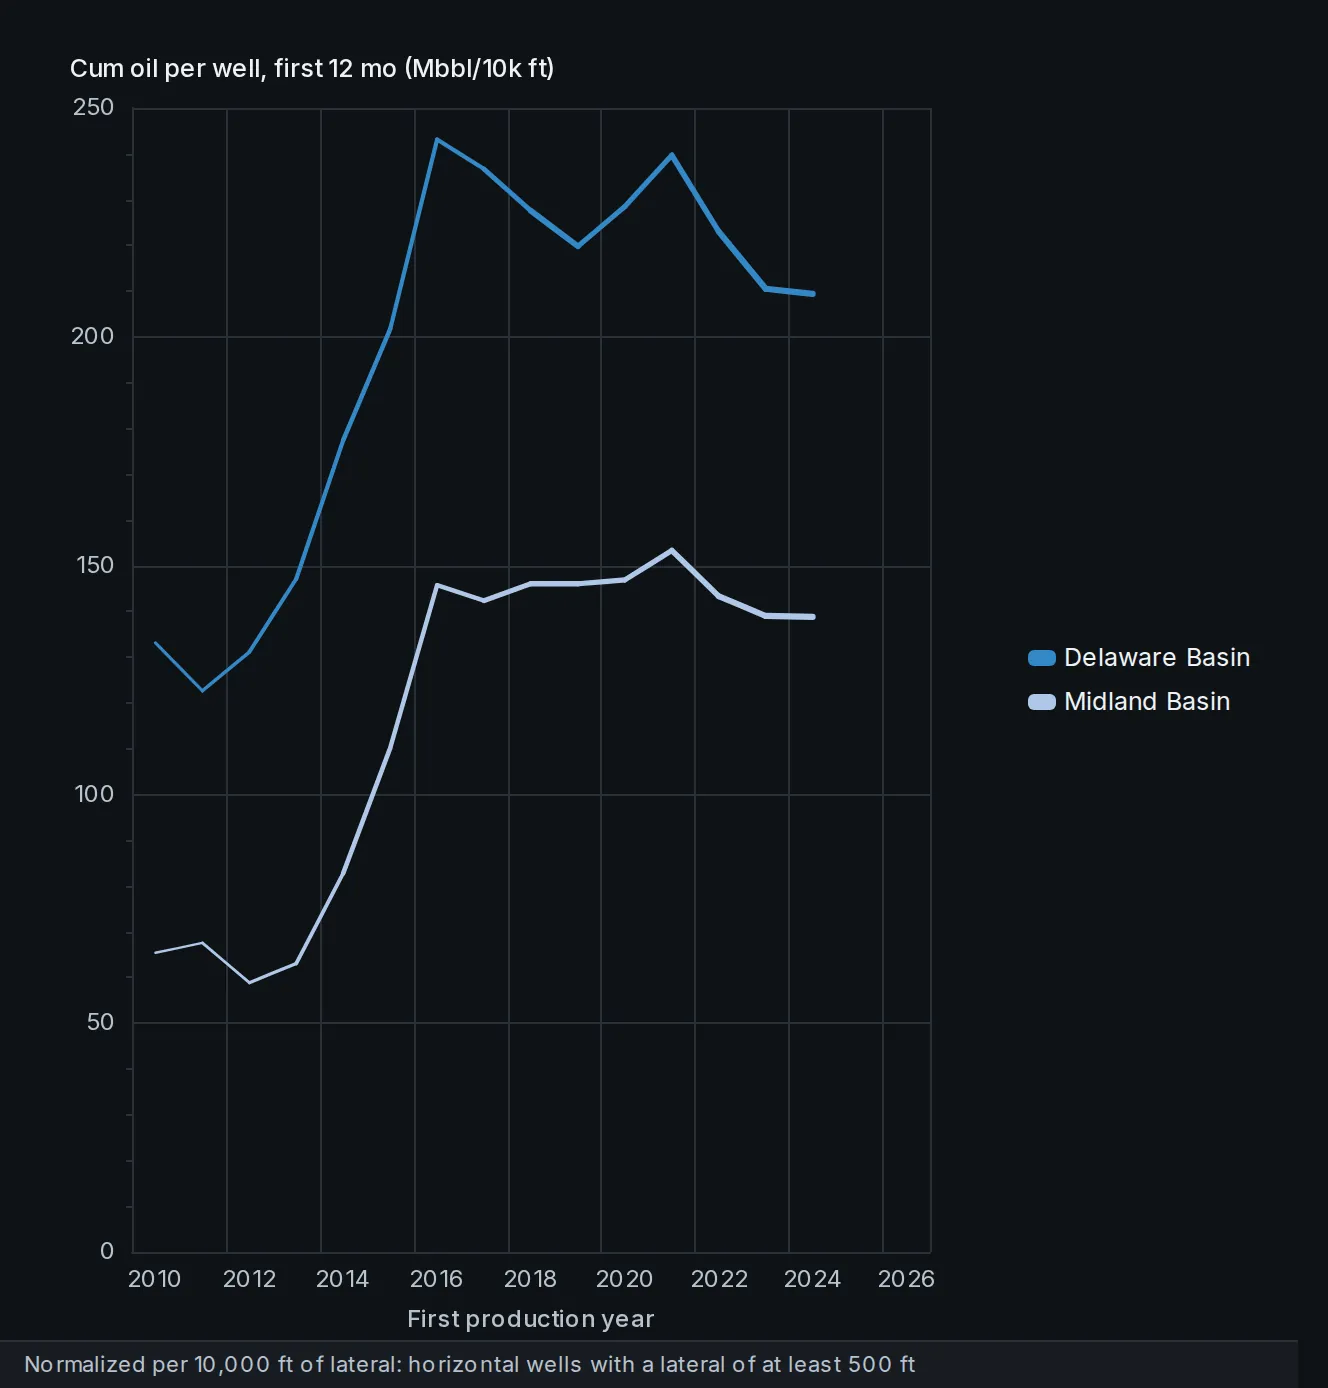
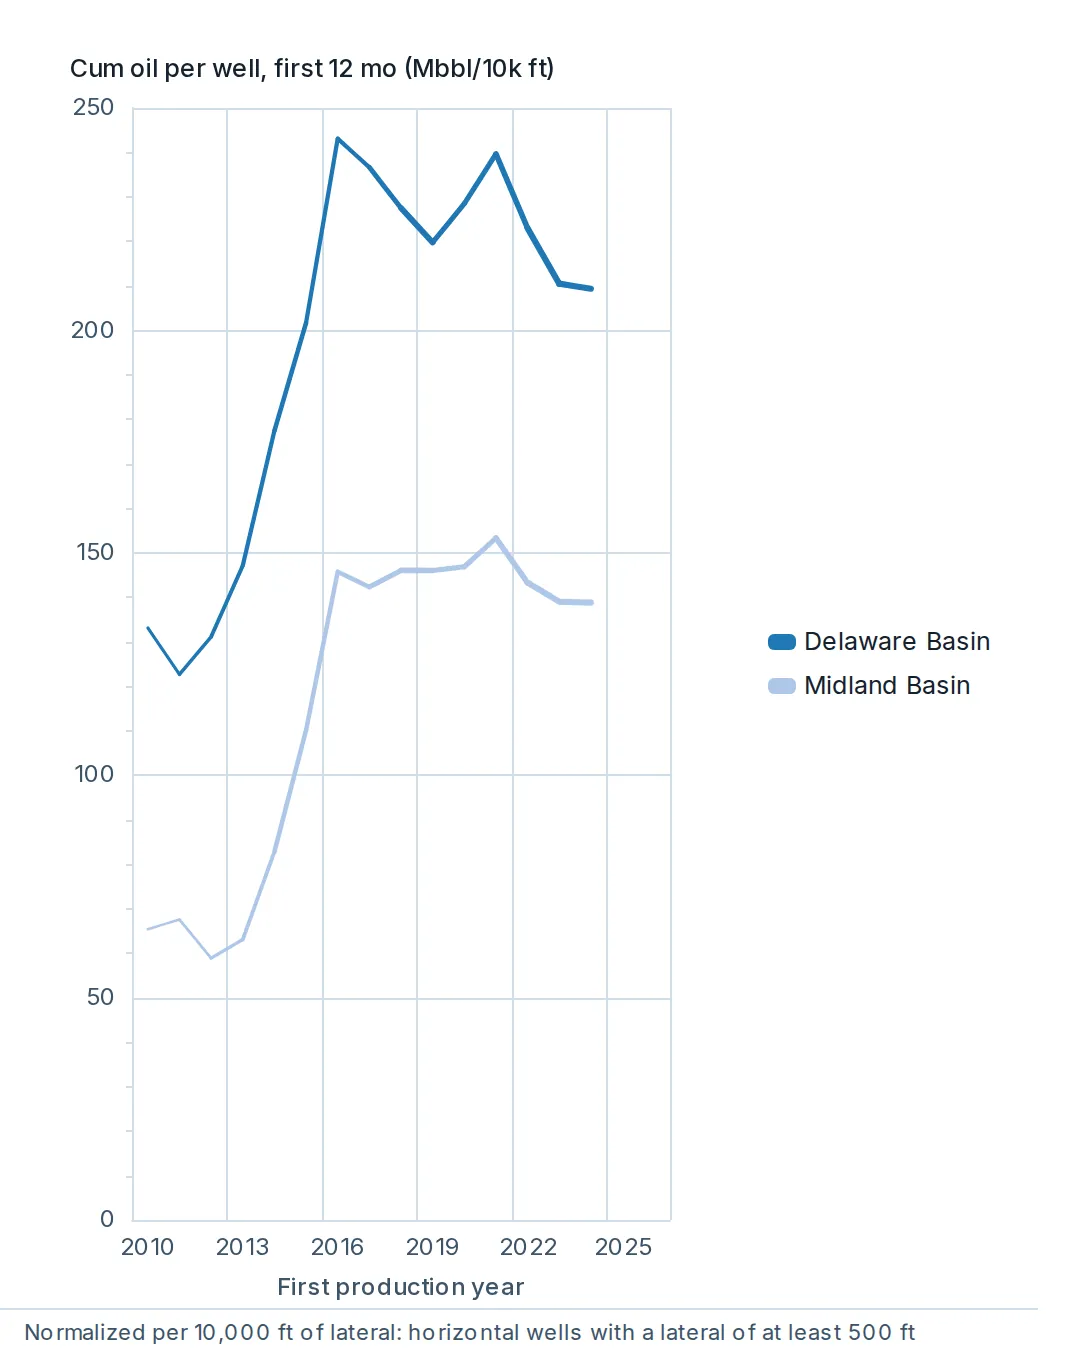
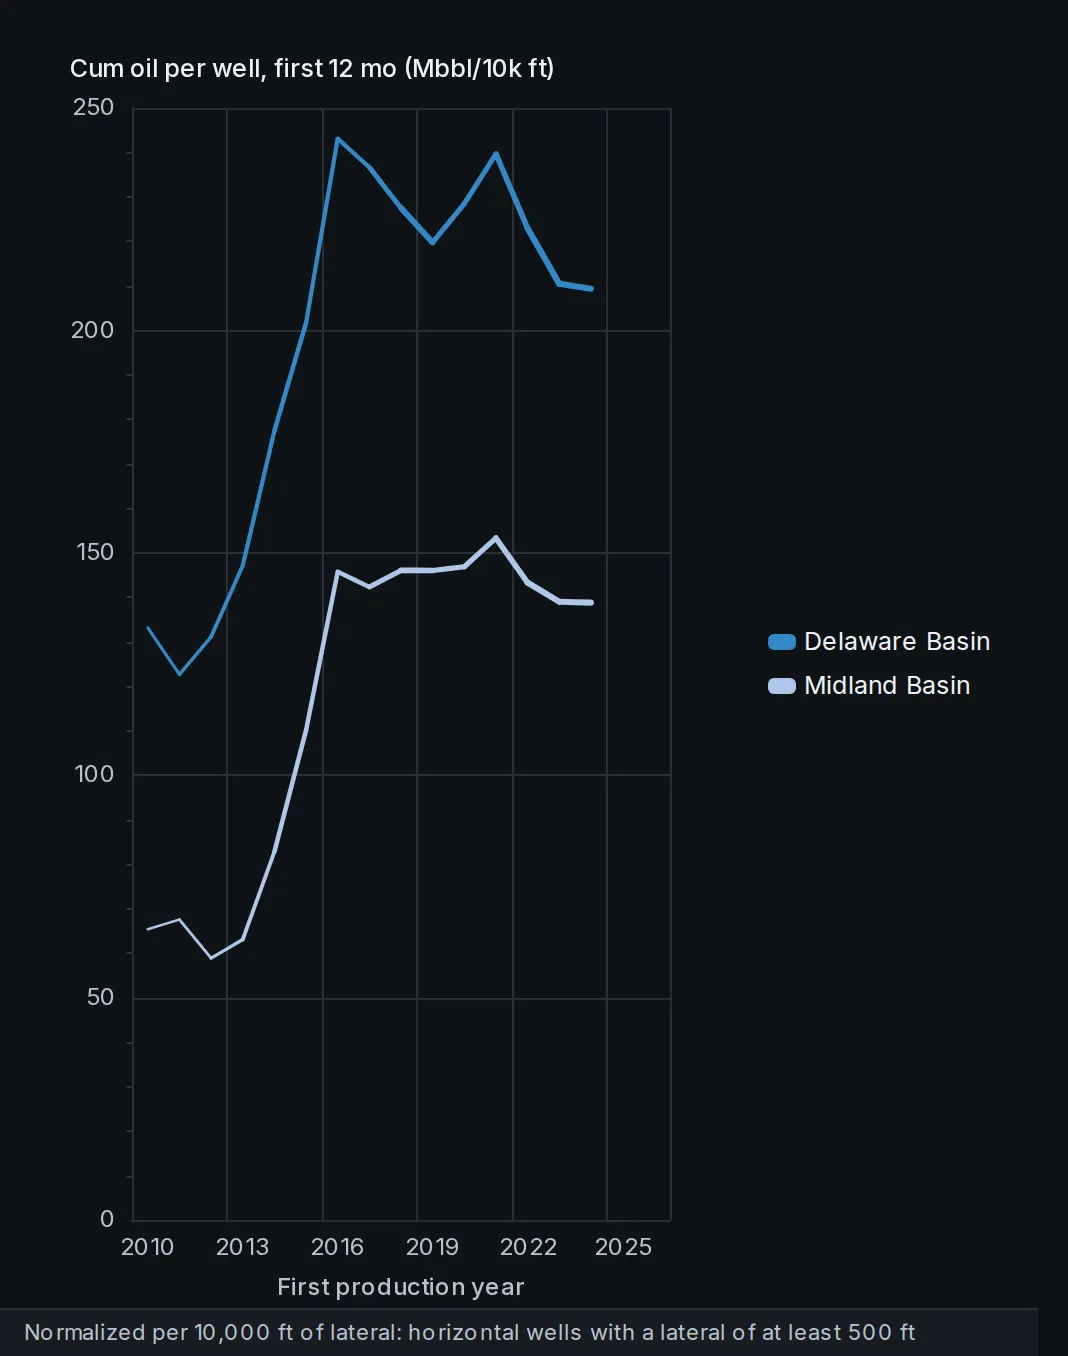
Cumulative production per well by first-production year, for any grouping.
Oil, gas or BOE through a window you set, per well or per 10,000 lateral feet, so wells compare on a normalized basis.
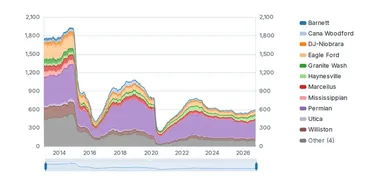
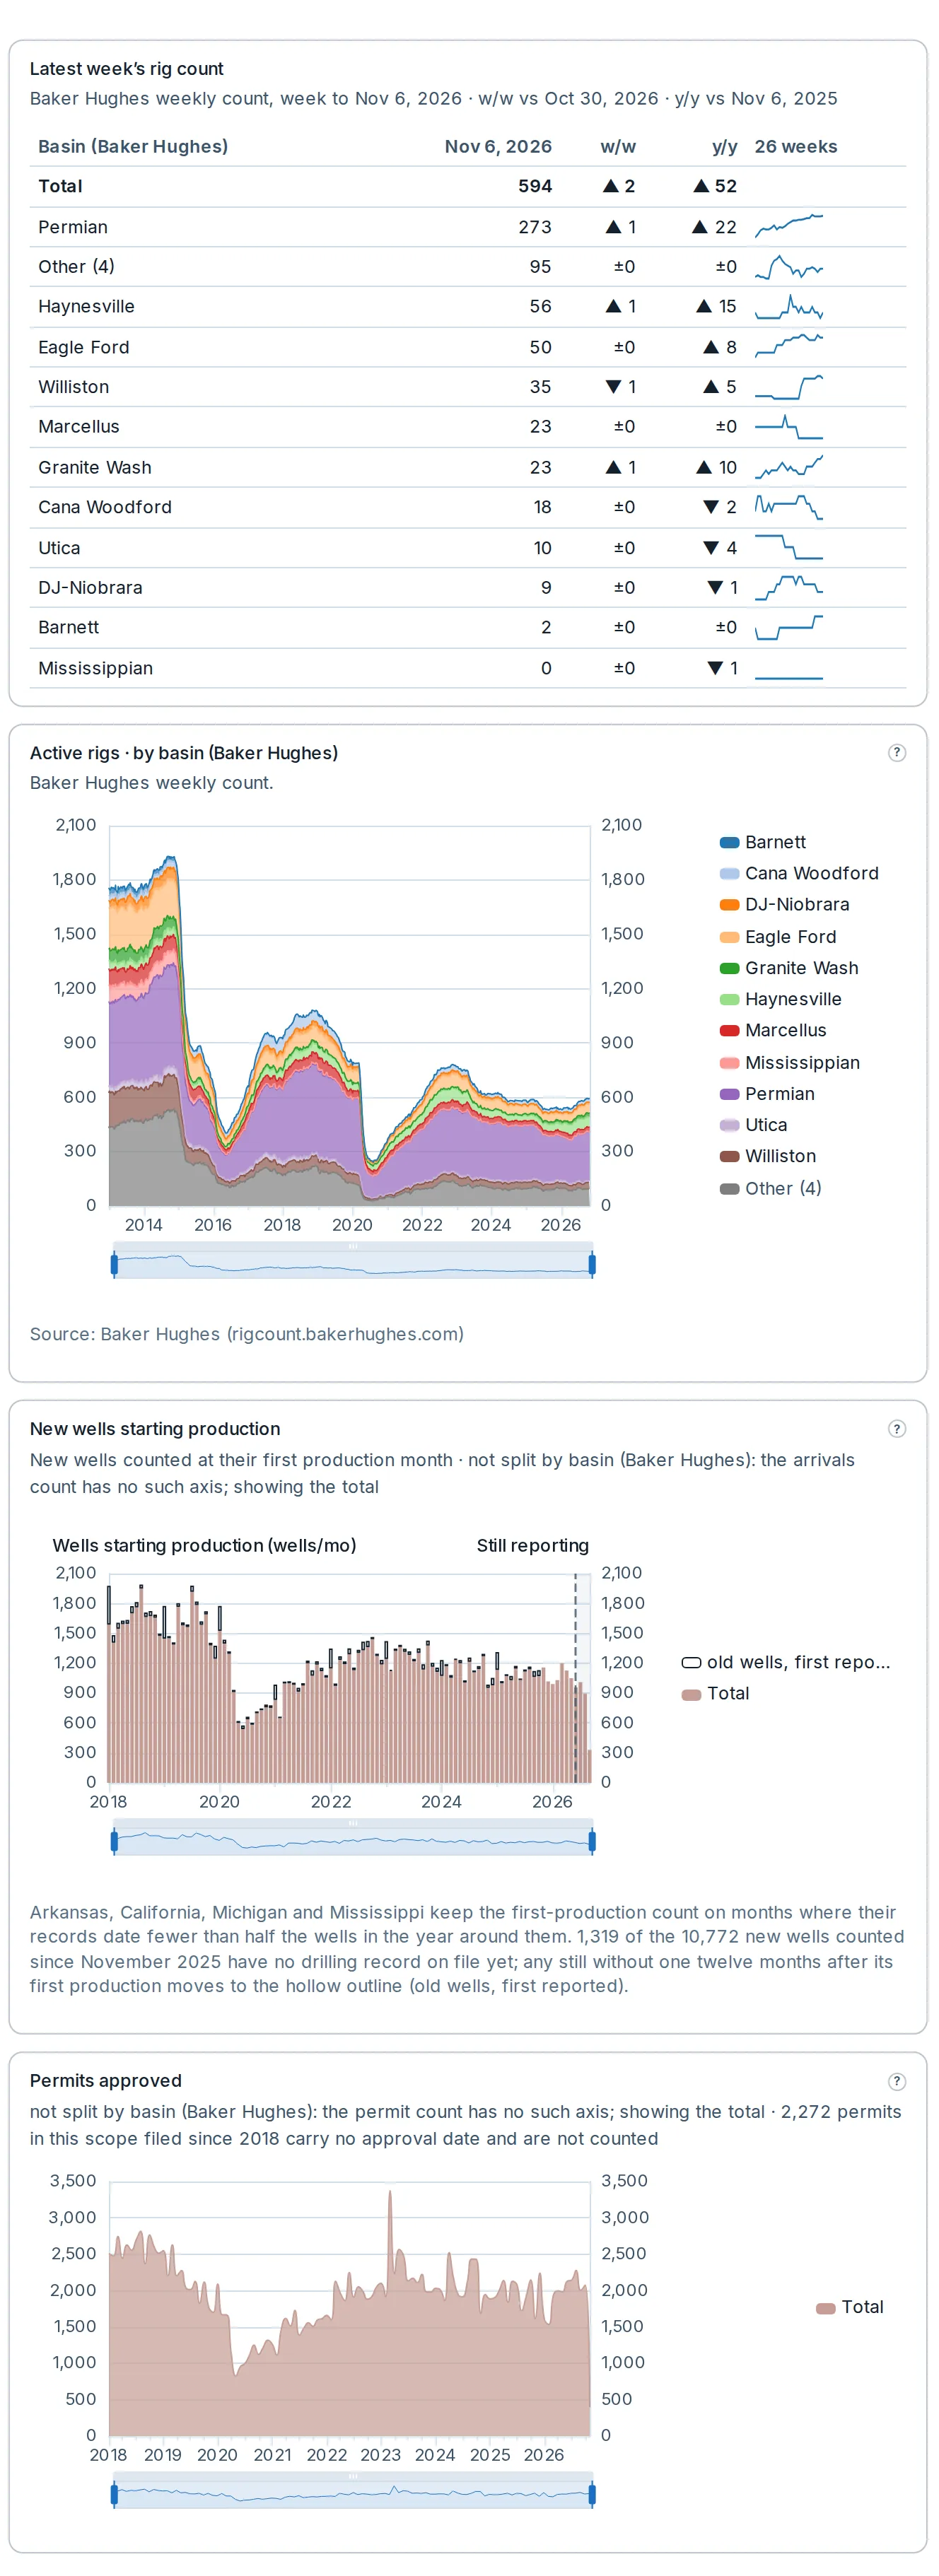
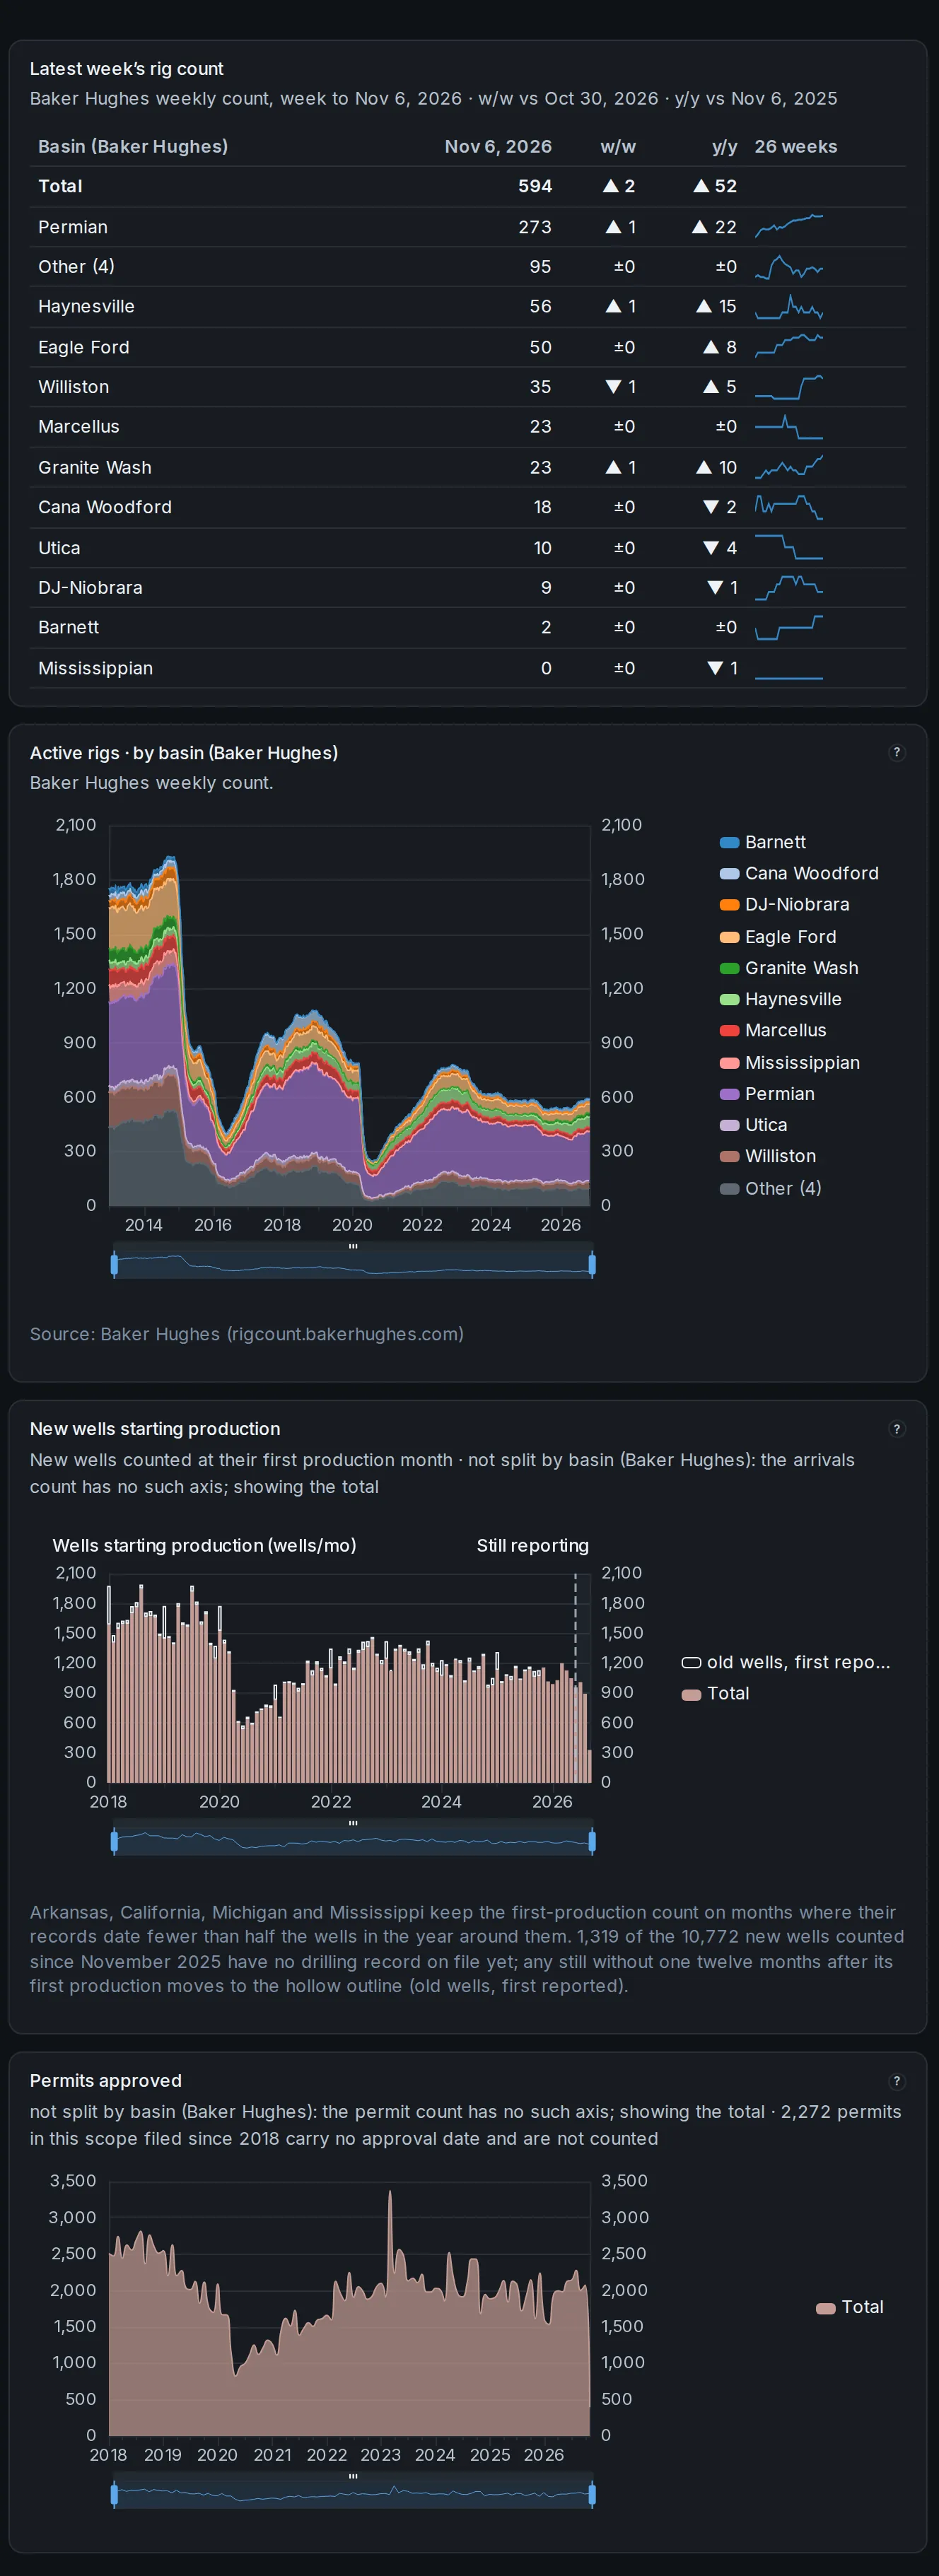
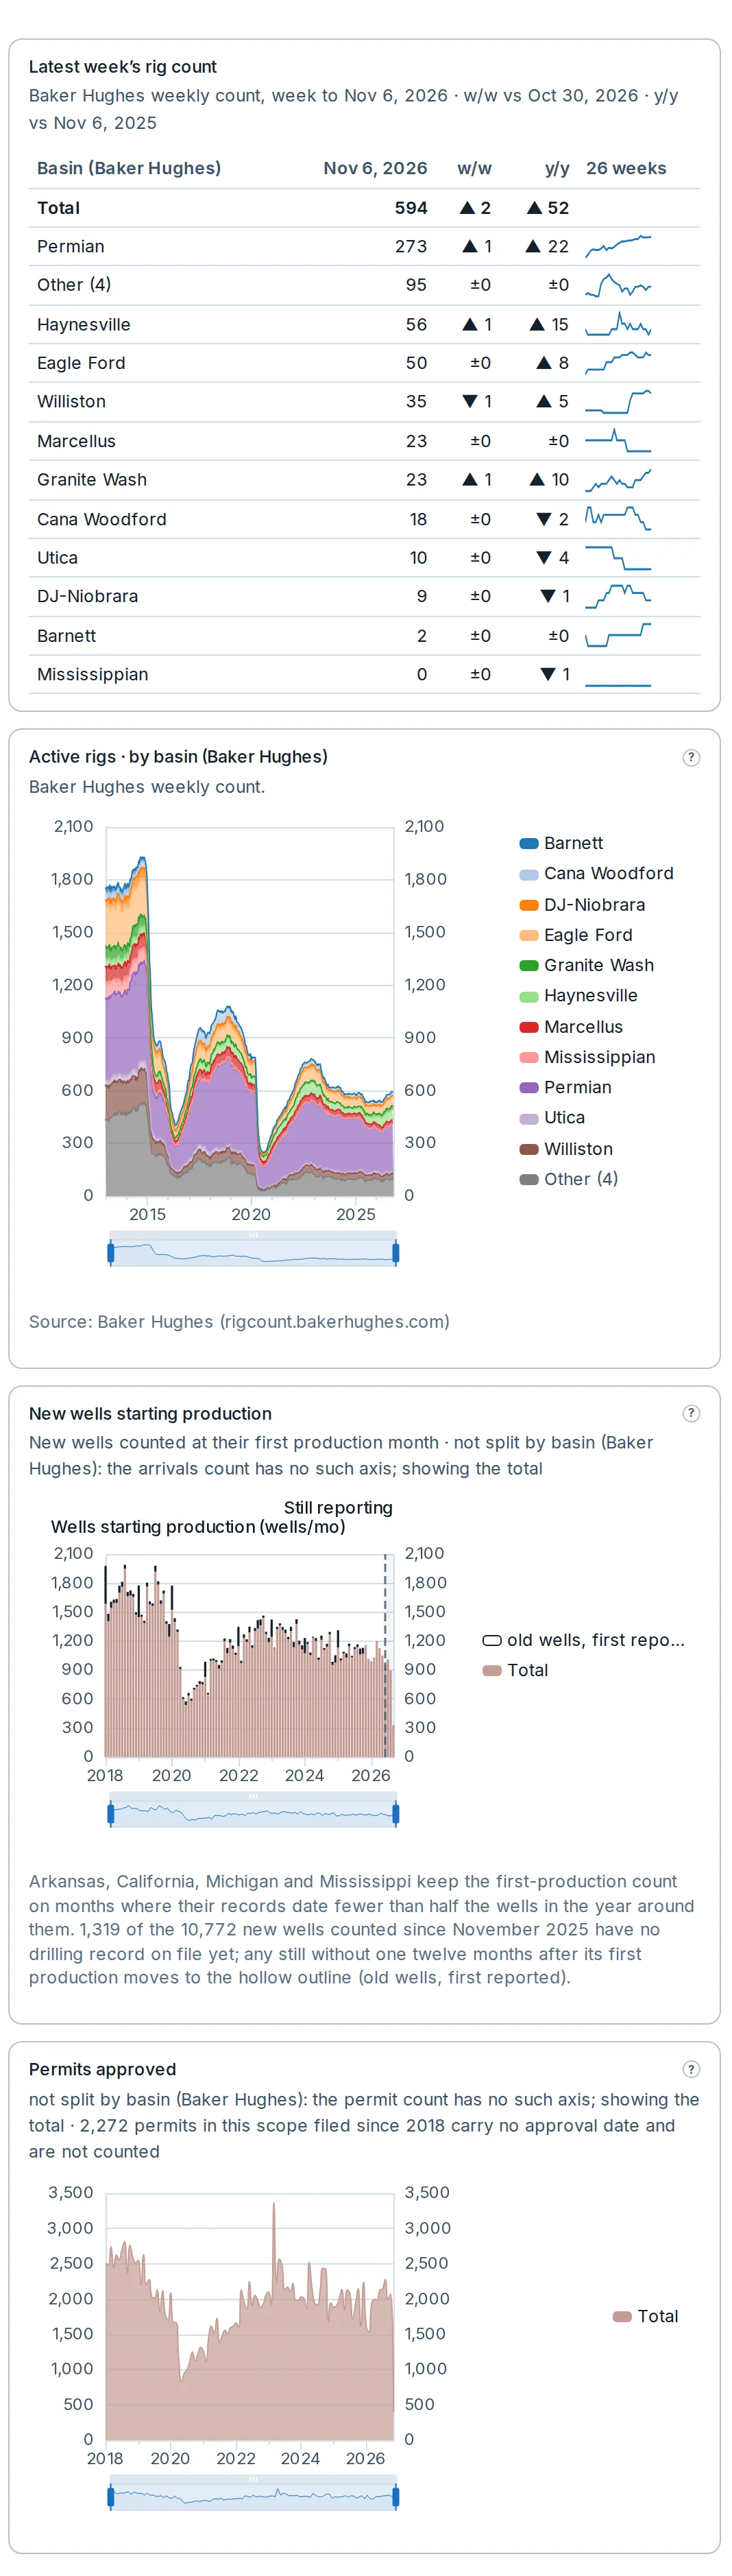
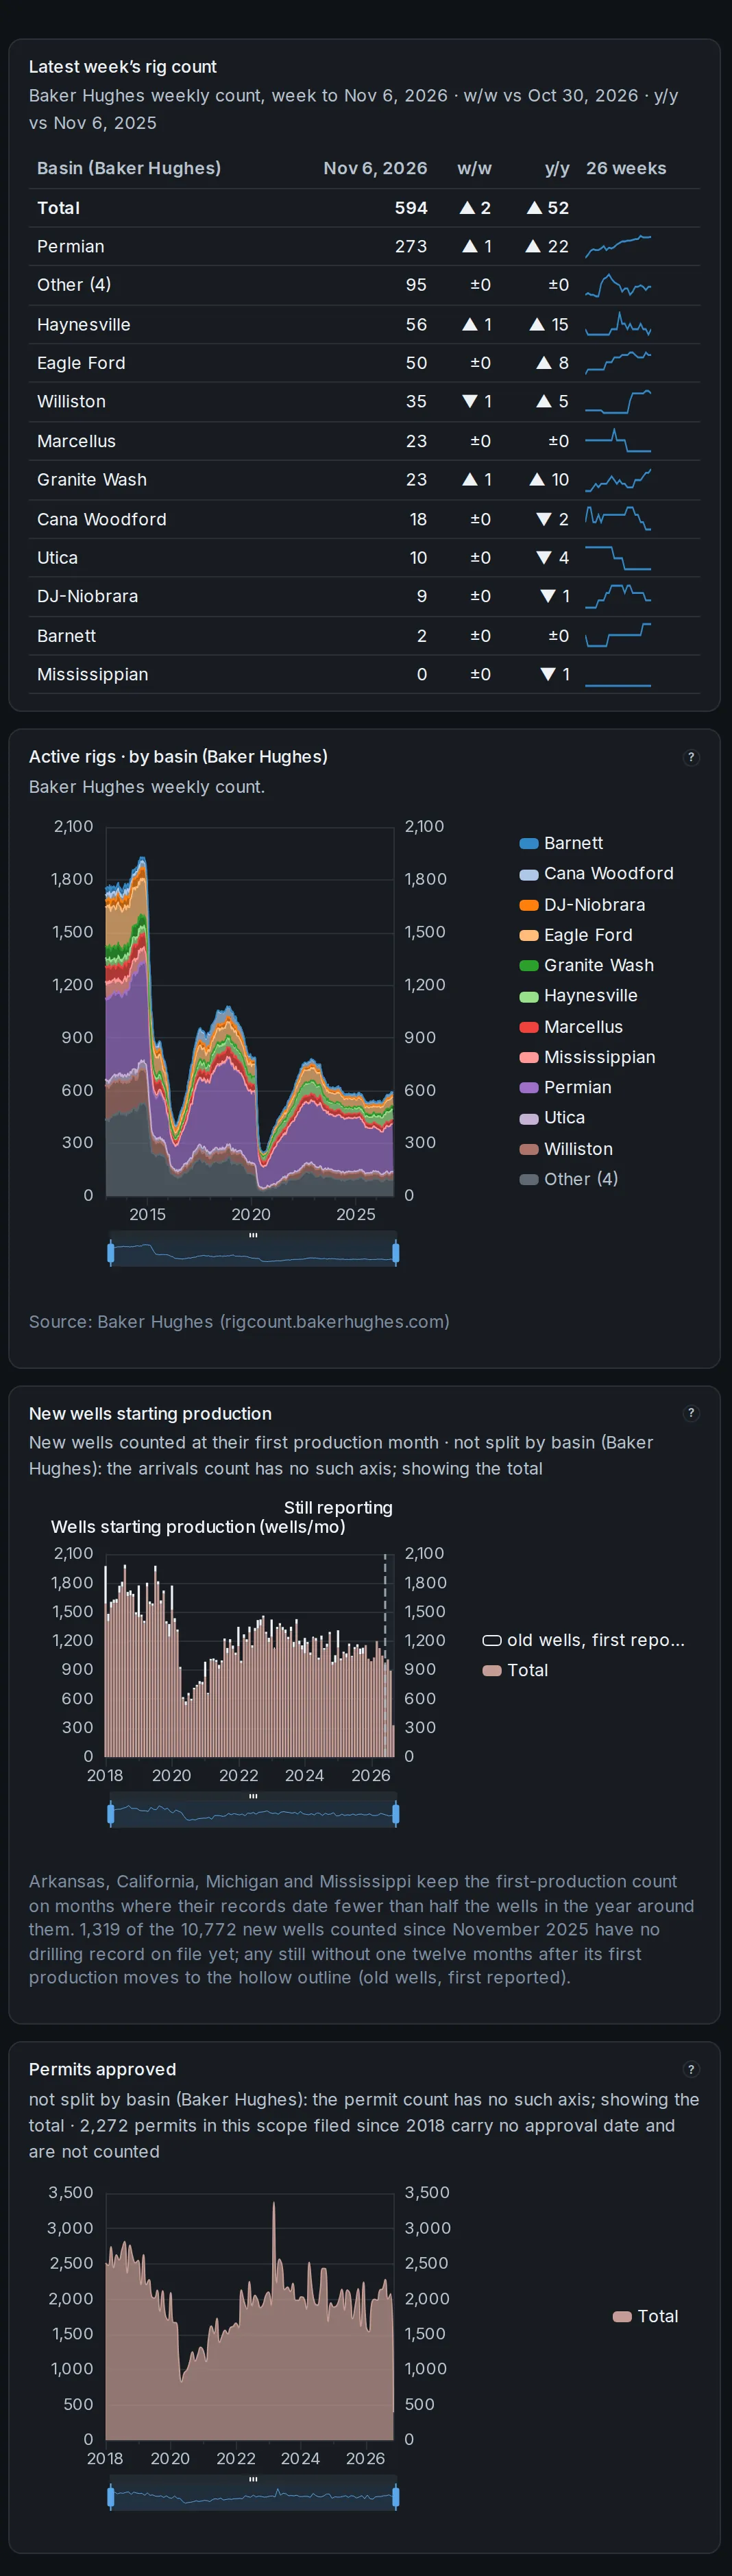
 Weekly rig counts beside new wells starting production and permits approved.
Weekly rig counts beside new wells starting production and permits approved.
Three charts on one shared grouping and time window, so activity and what follows it read together.
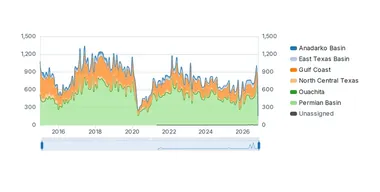
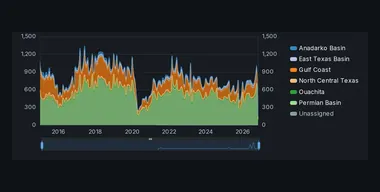 Permit filings through time, by the grouping you pick.
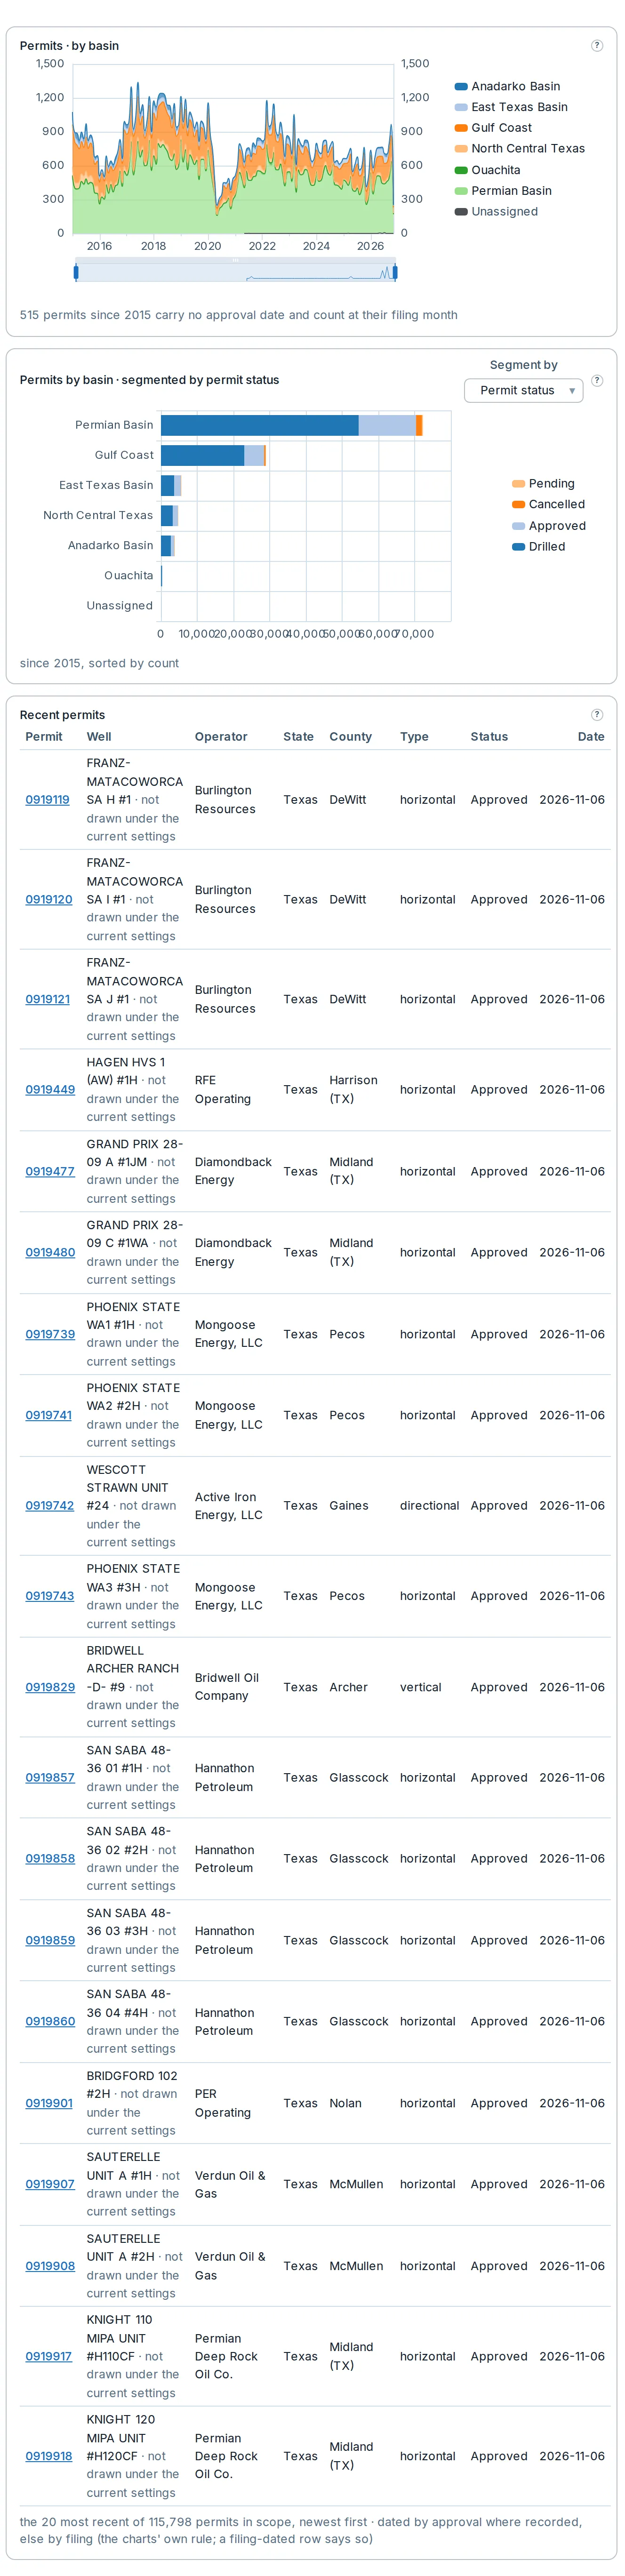
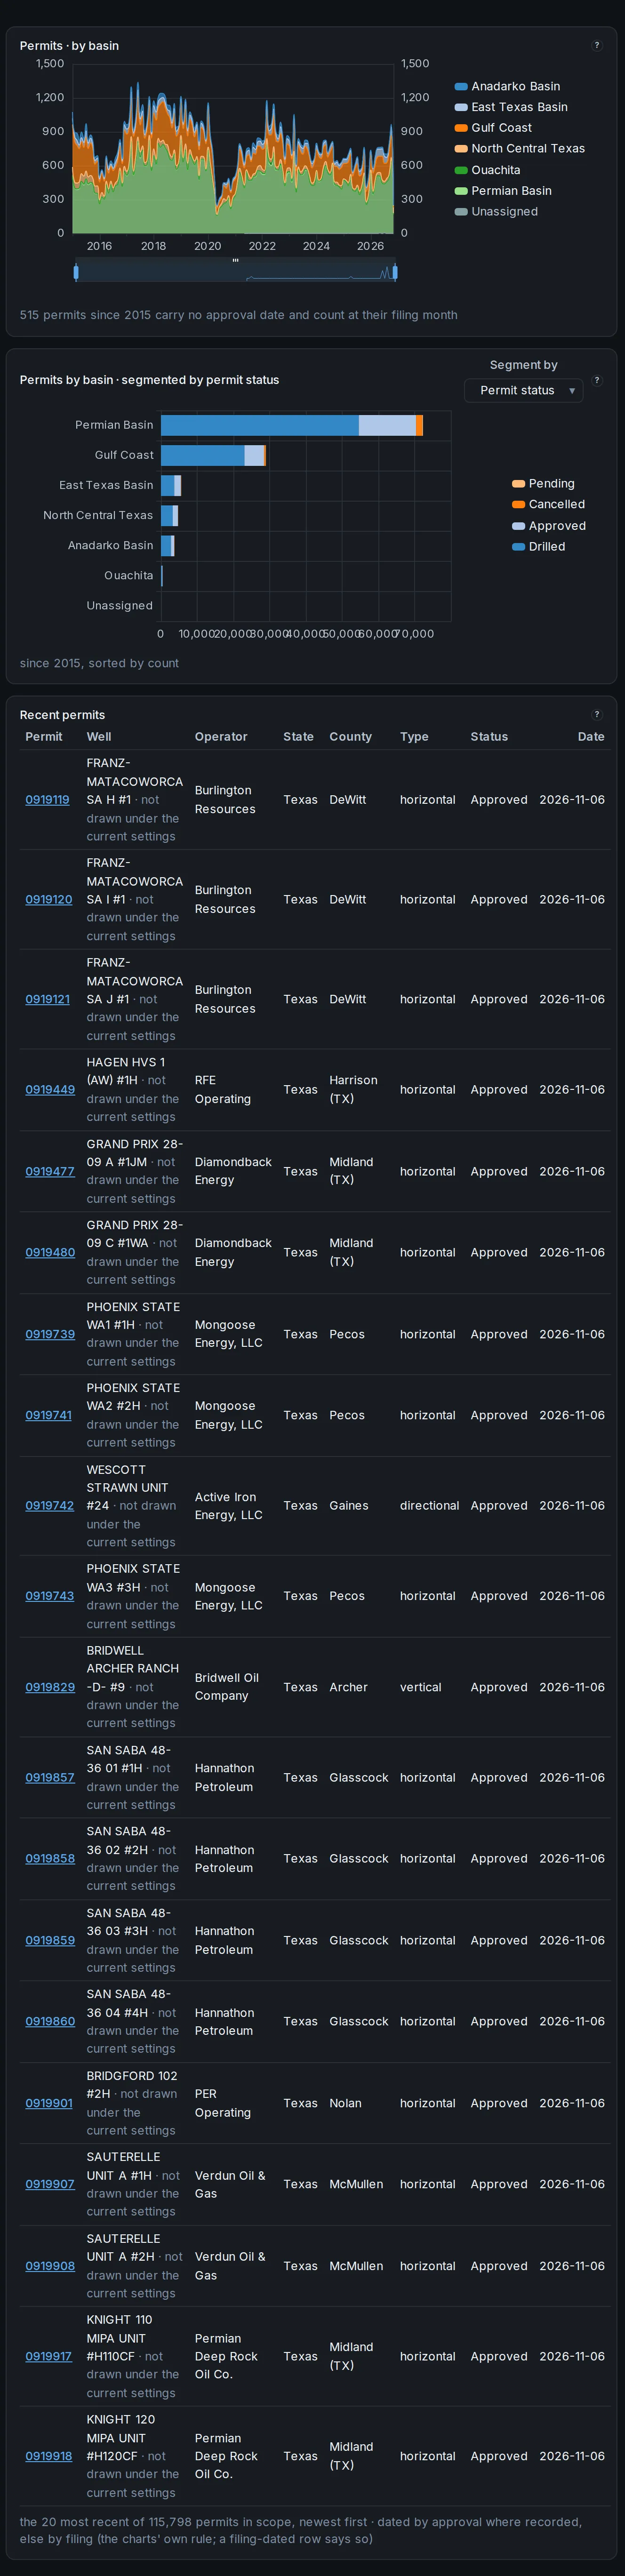


Permit filings through time, by the grouping you pick.
Each permit counts once: at the month the regulator approved it or, where no approval is recorded, the month it was filed. A bar chart below shows the same window’s totals, sorted by count.
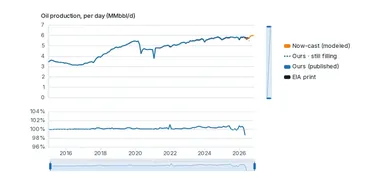
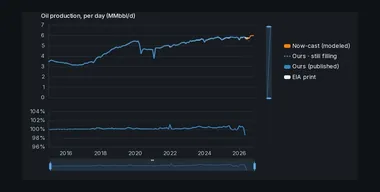 Our published production beside the official benchmark’s own print, in per-day rates.
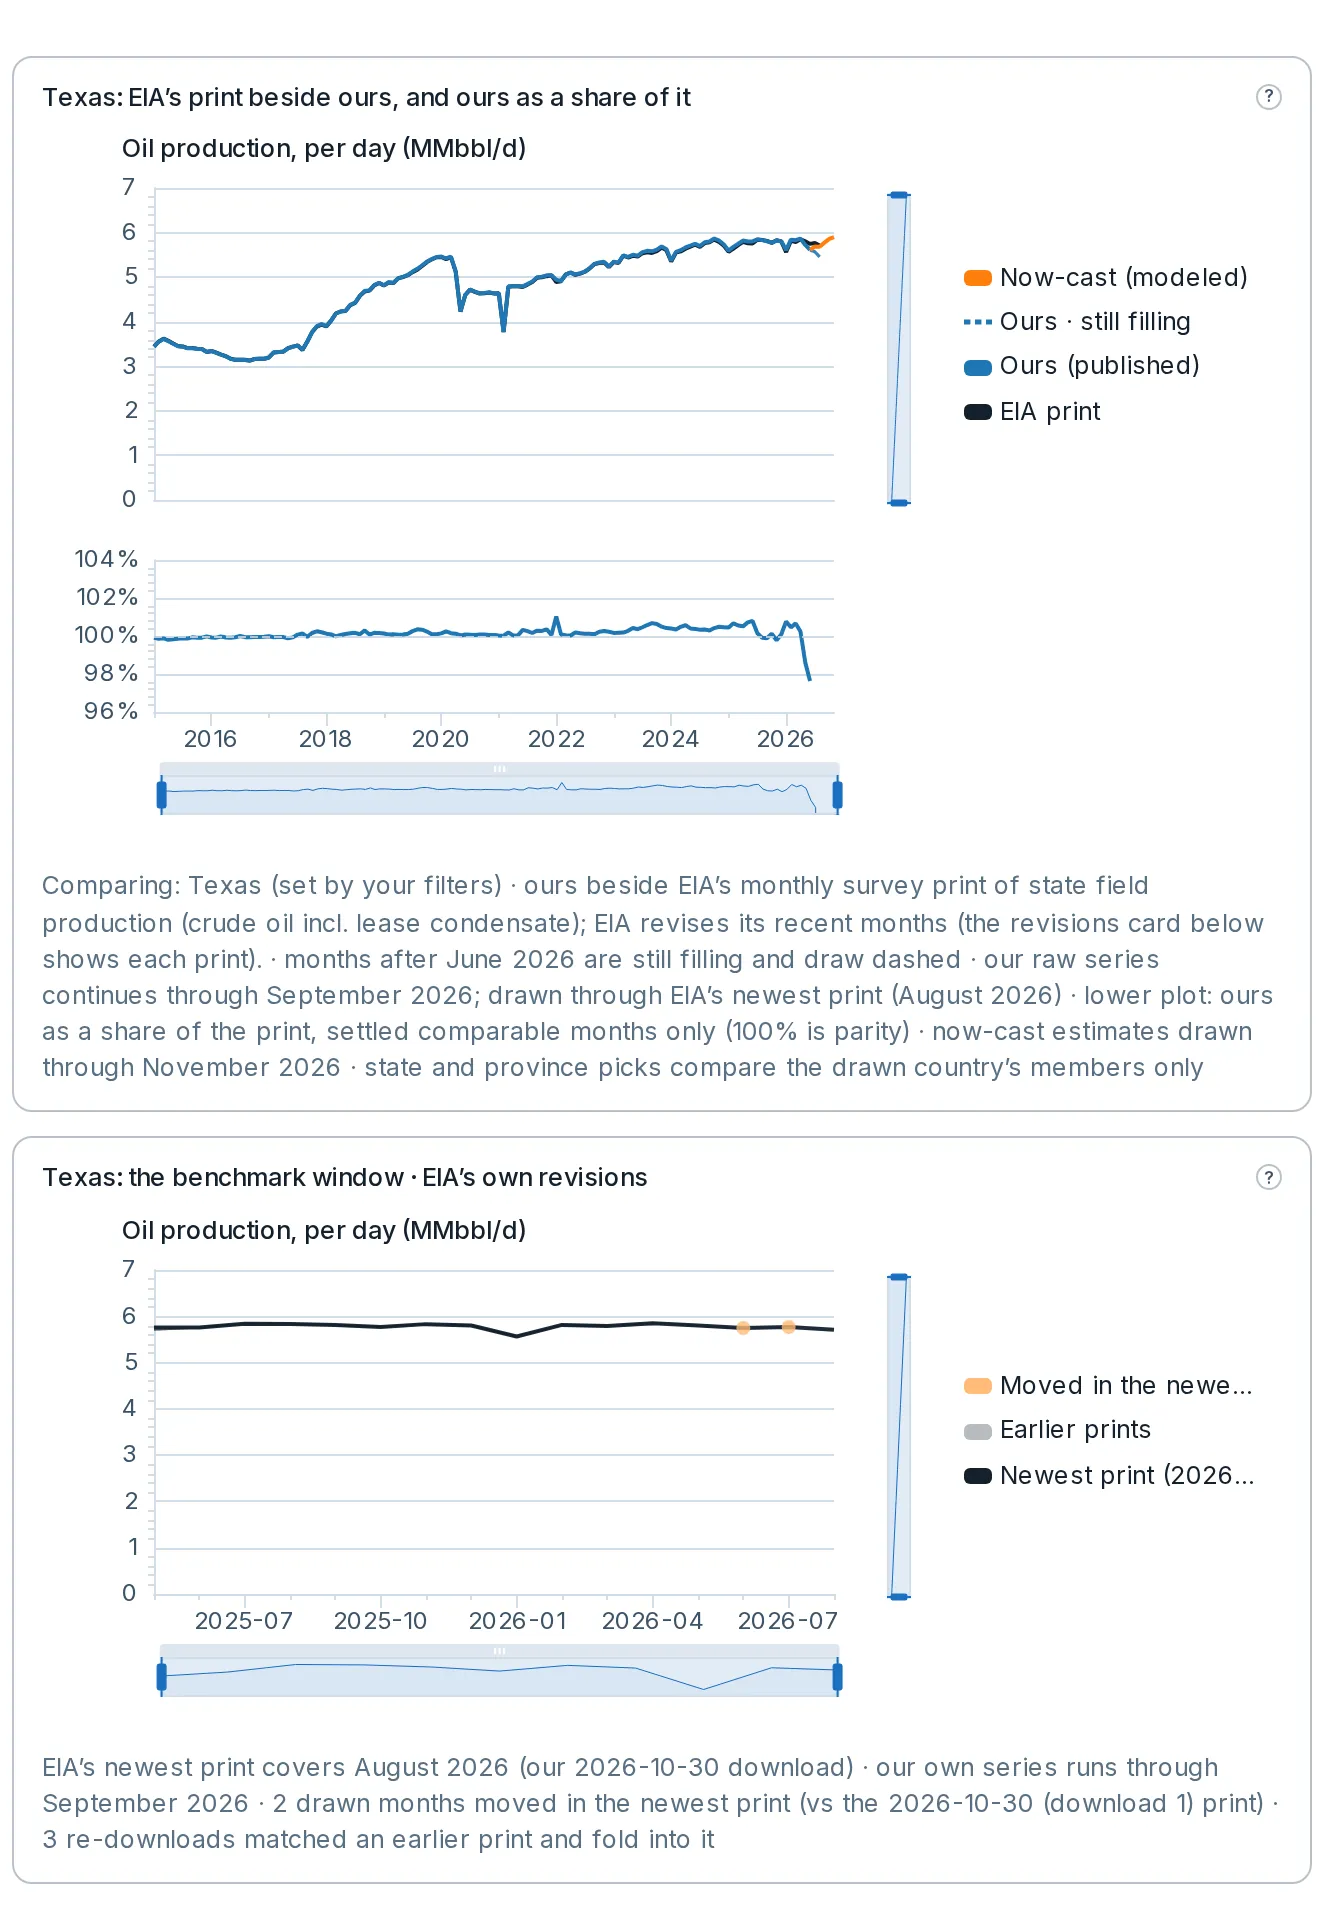
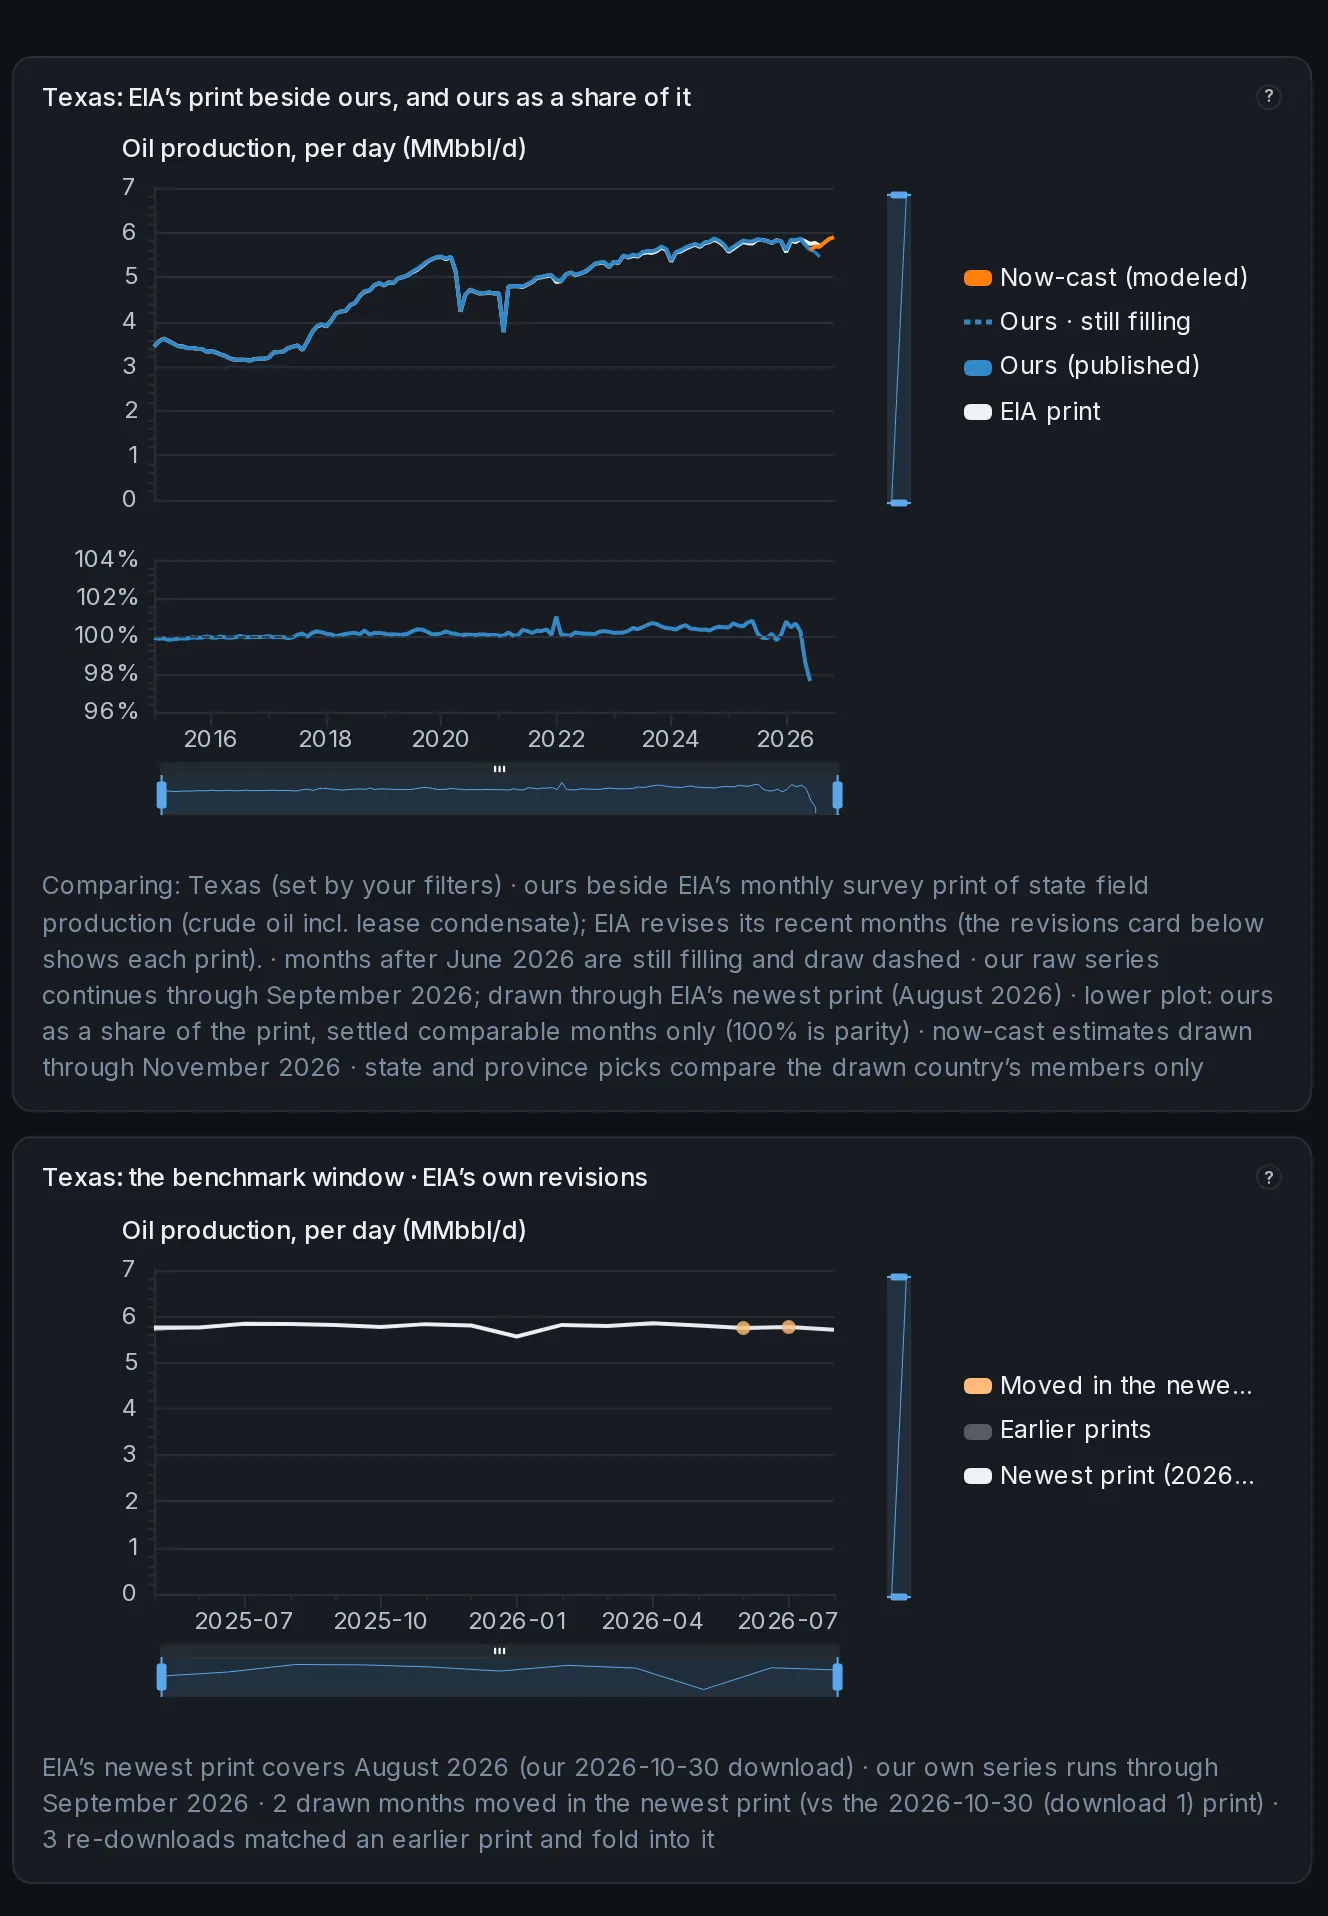
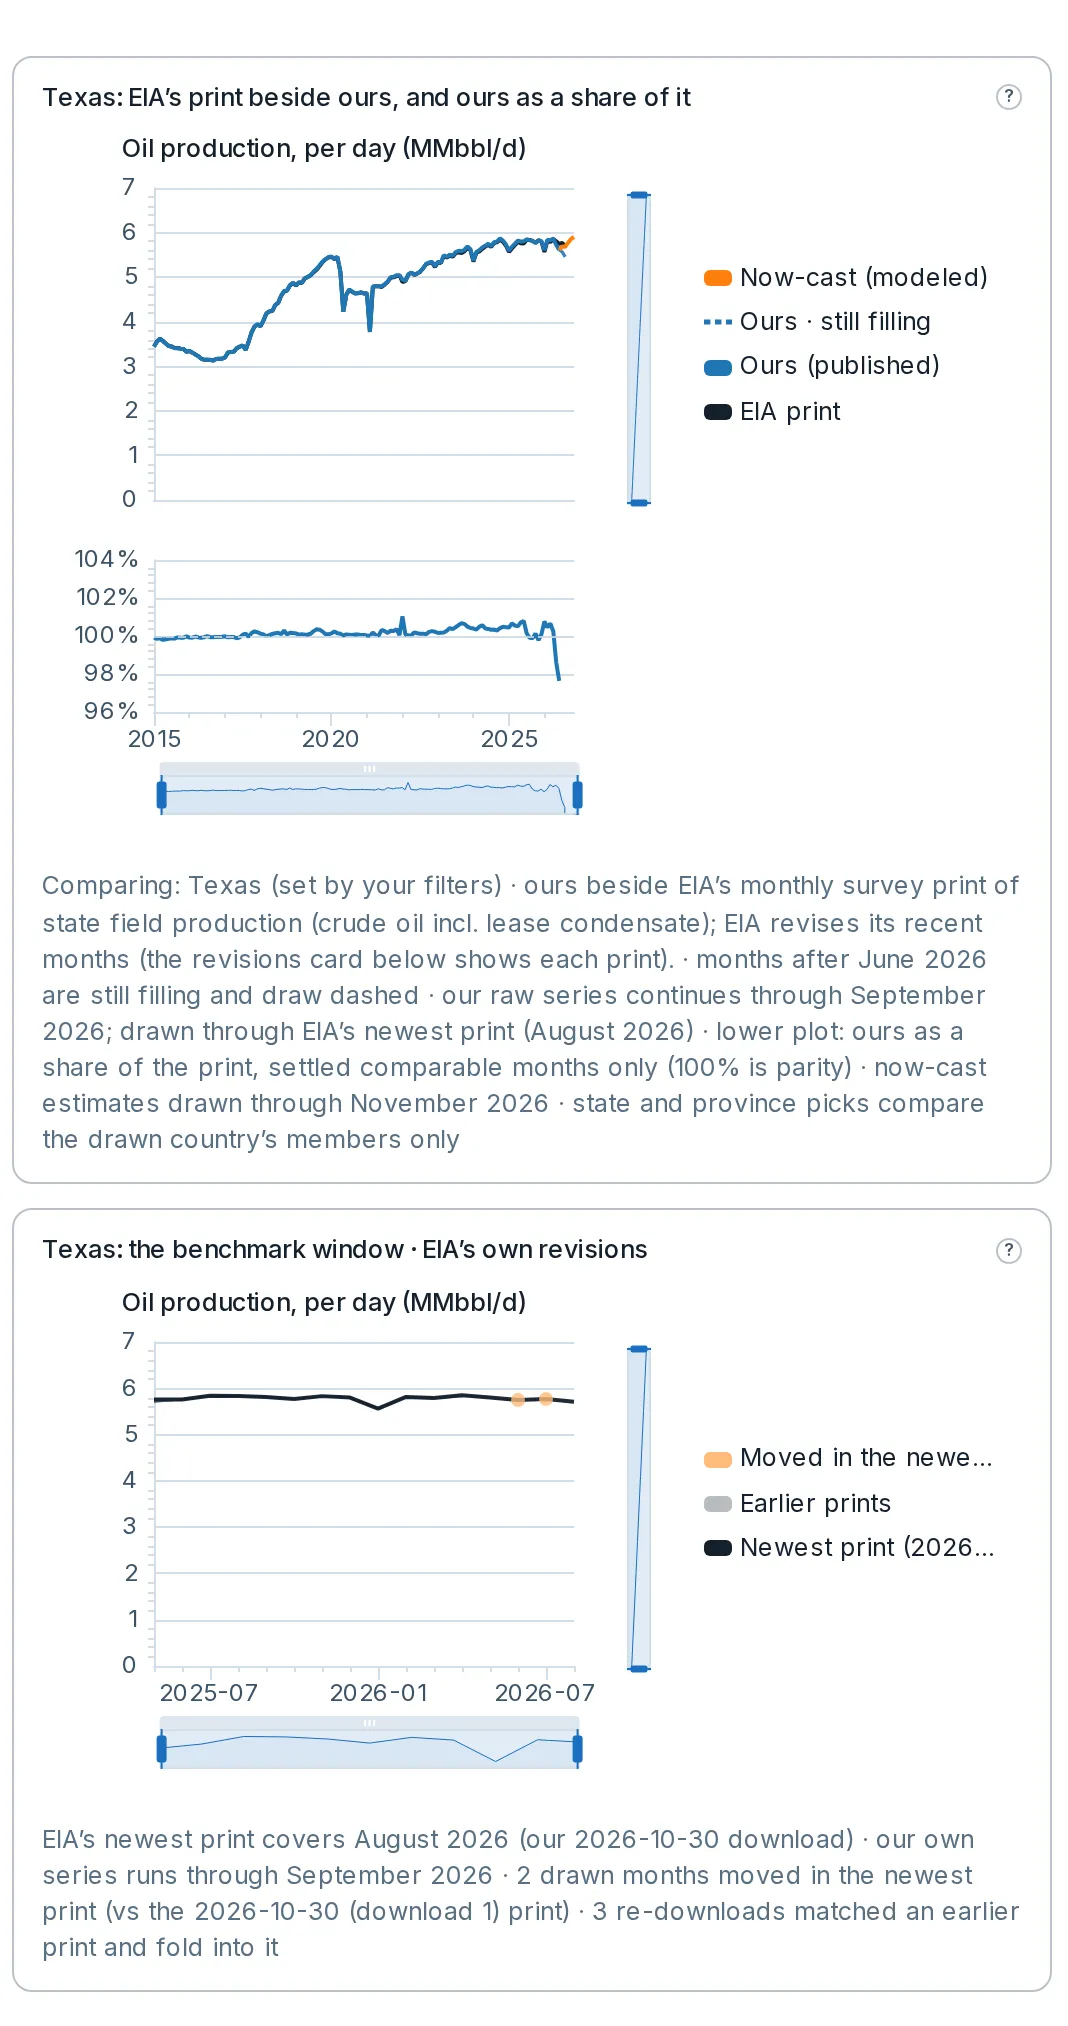
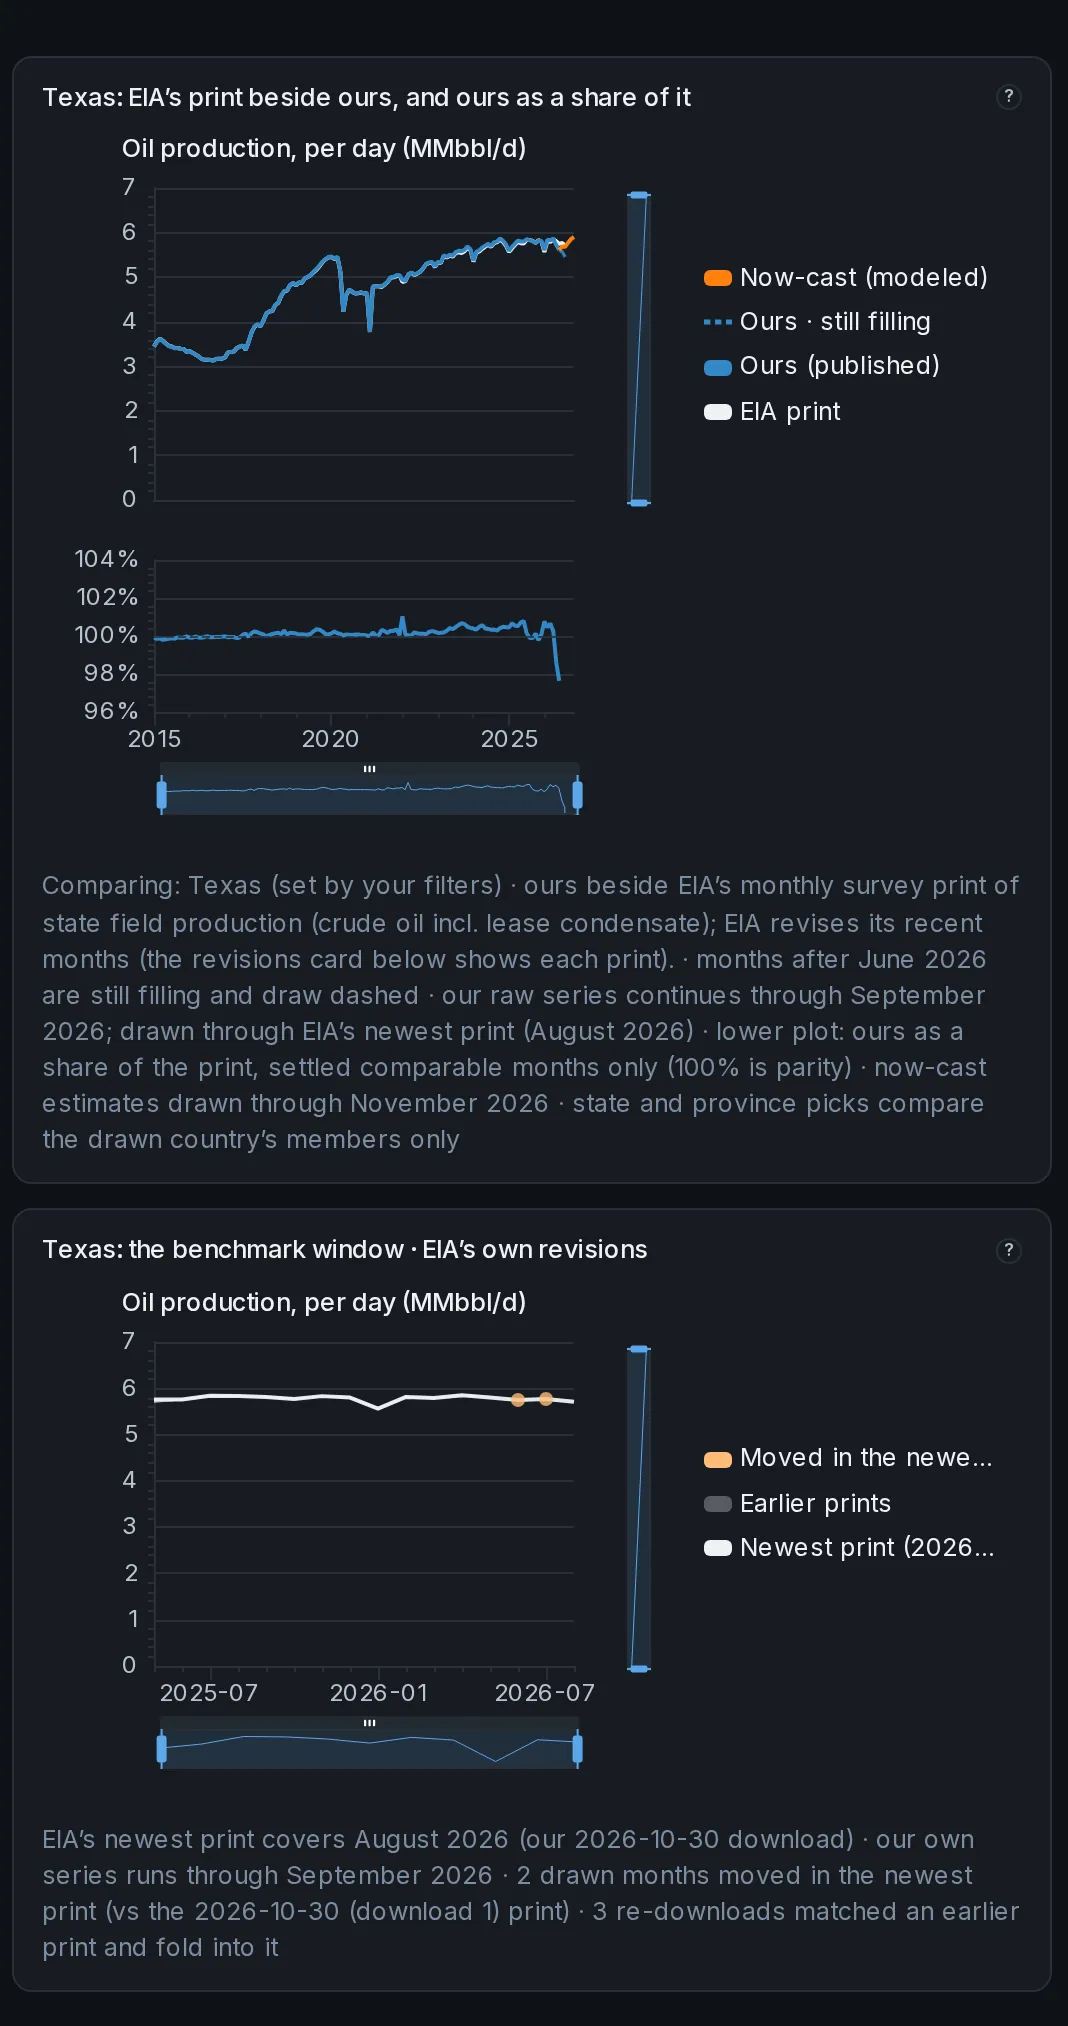
Our published production beside the official benchmark’s own print, in per-day rates.
The EIA’s monthly state production for the United States; StatCan’s provincial crude and the CER’s marketable gas for Canada. The footnote under the chart names exactly what is being compared.
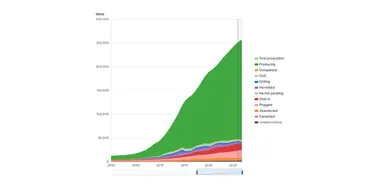
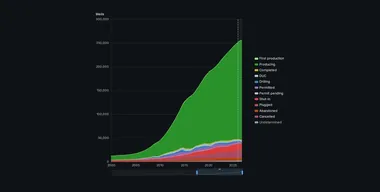 How many wells sit at each stage of life, month by month.
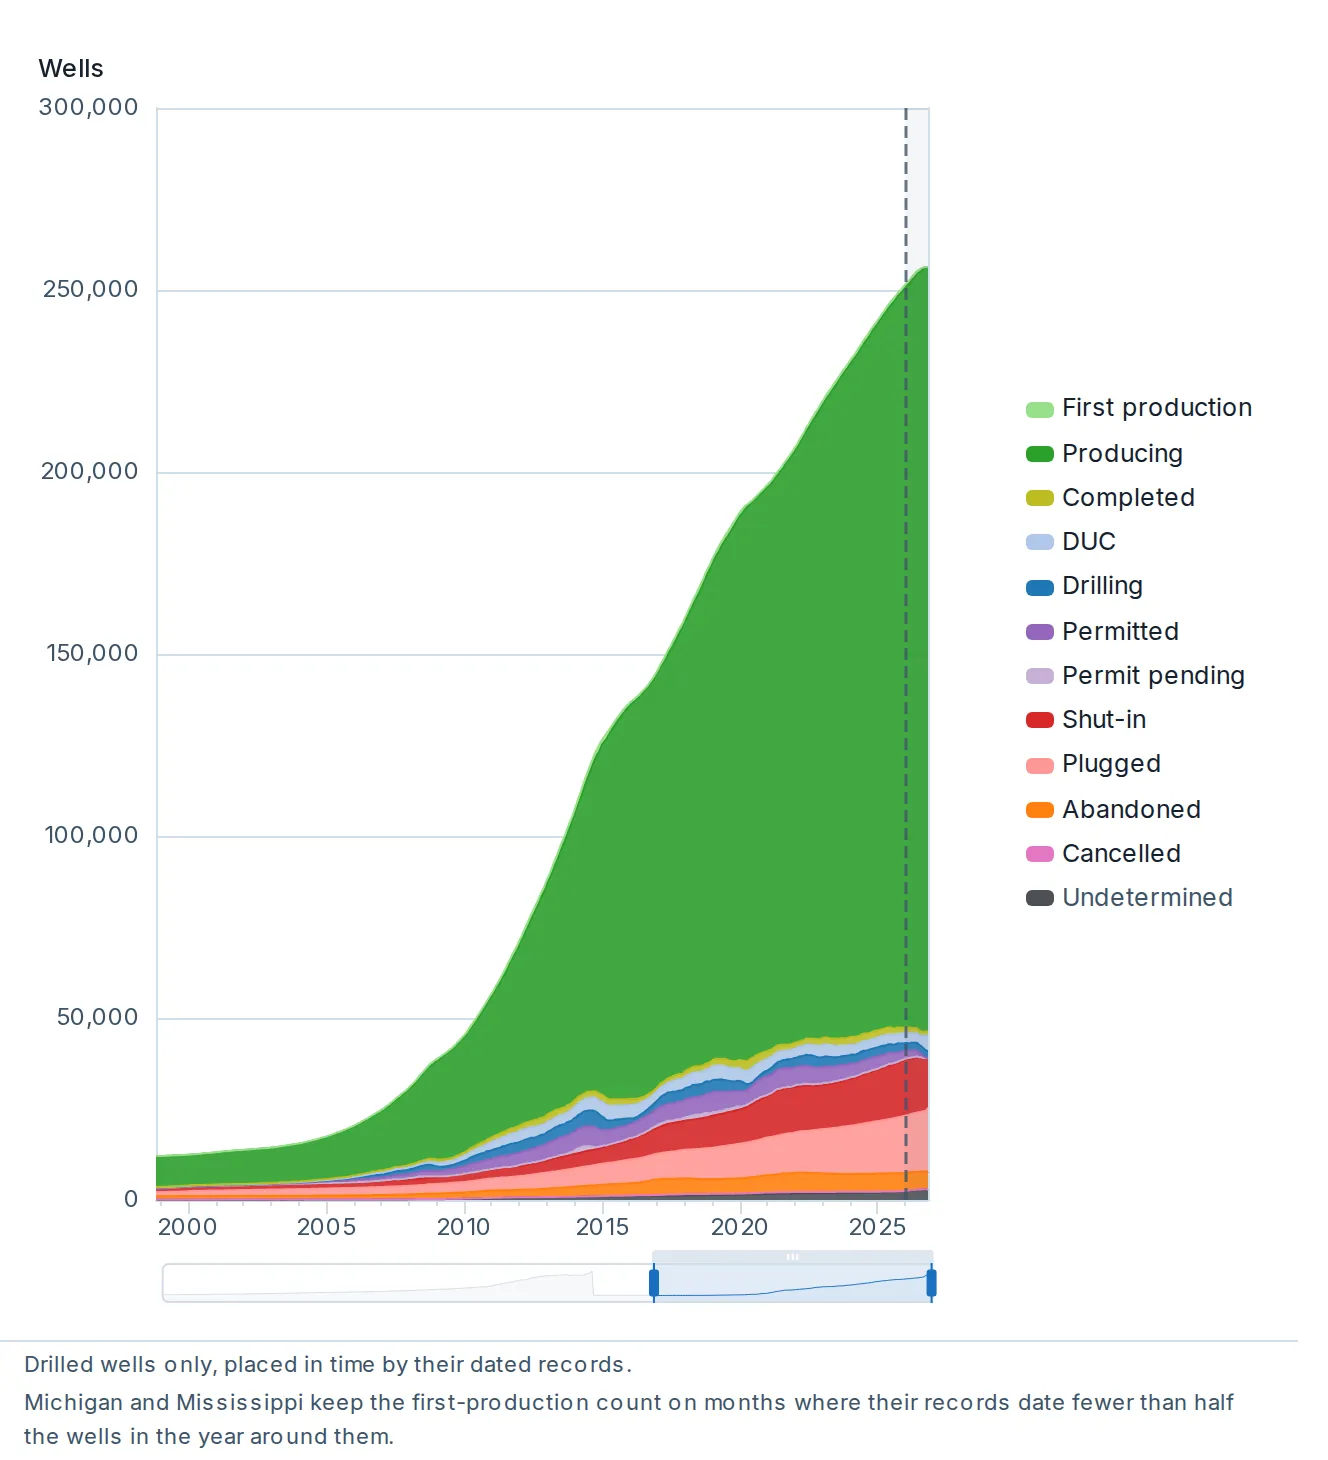
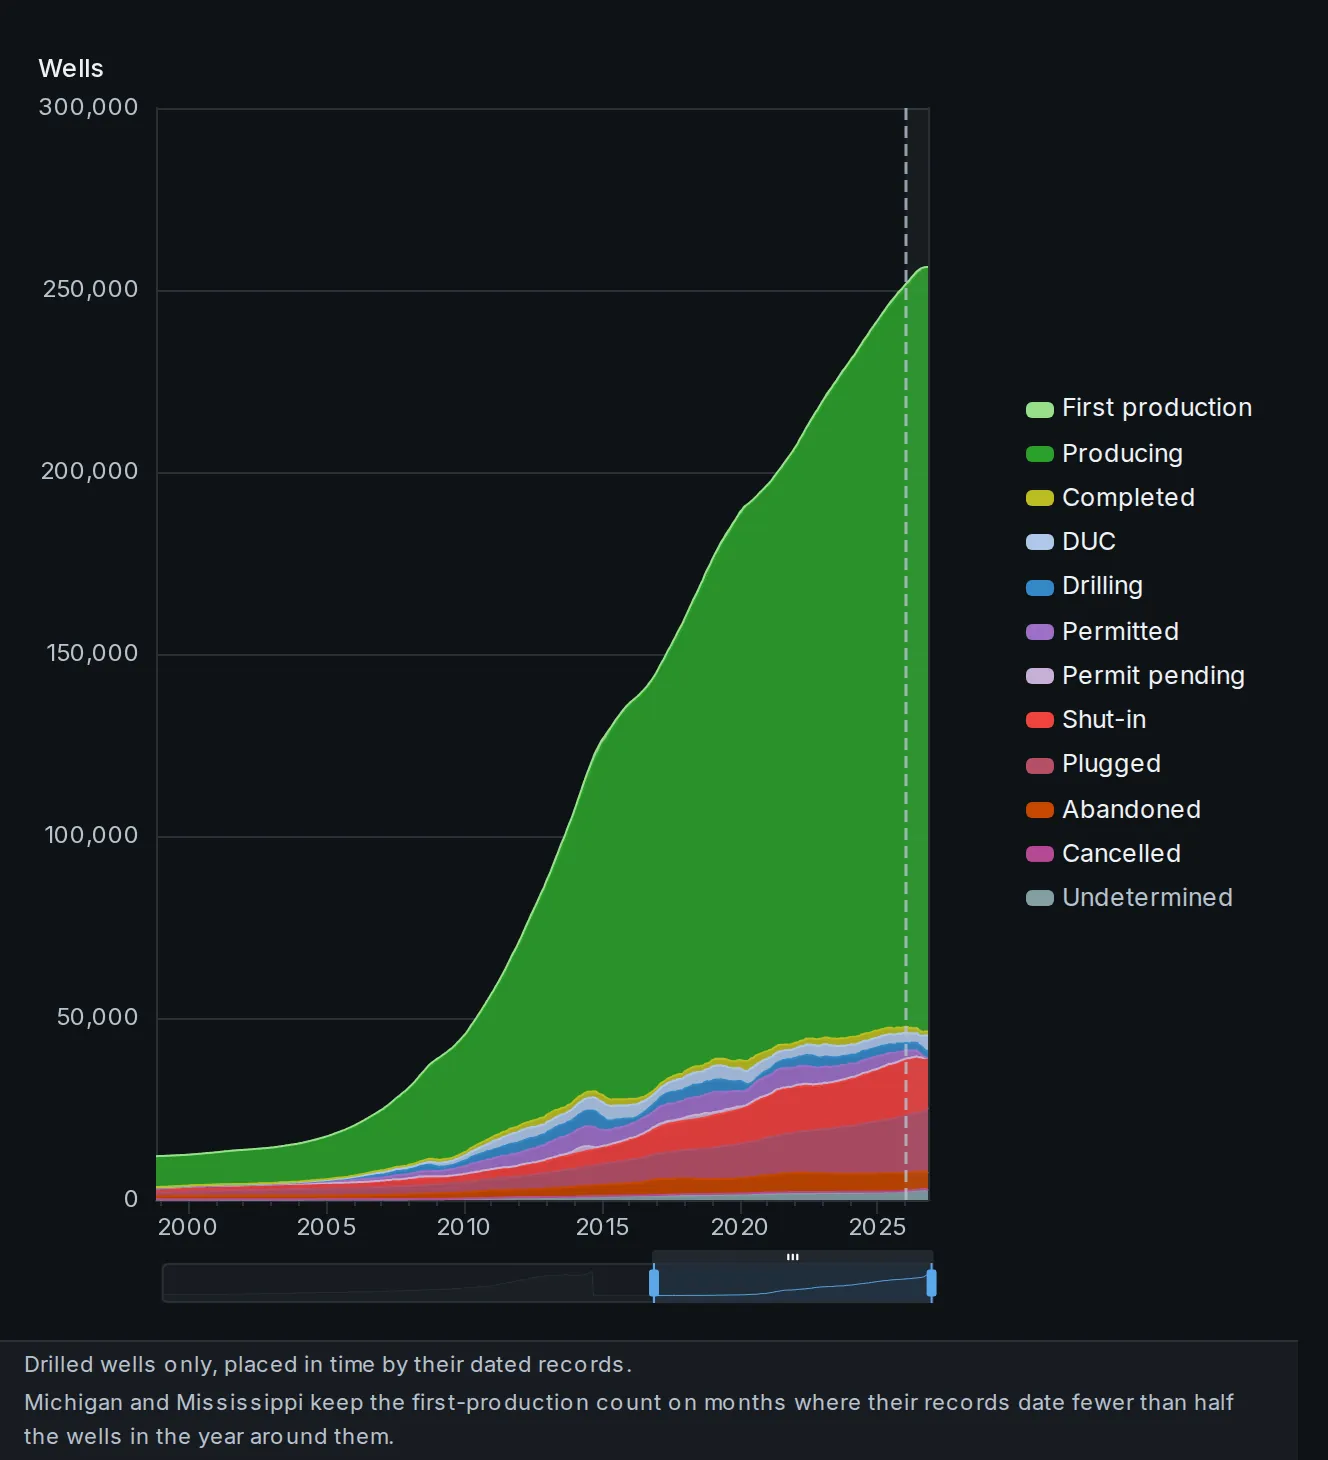
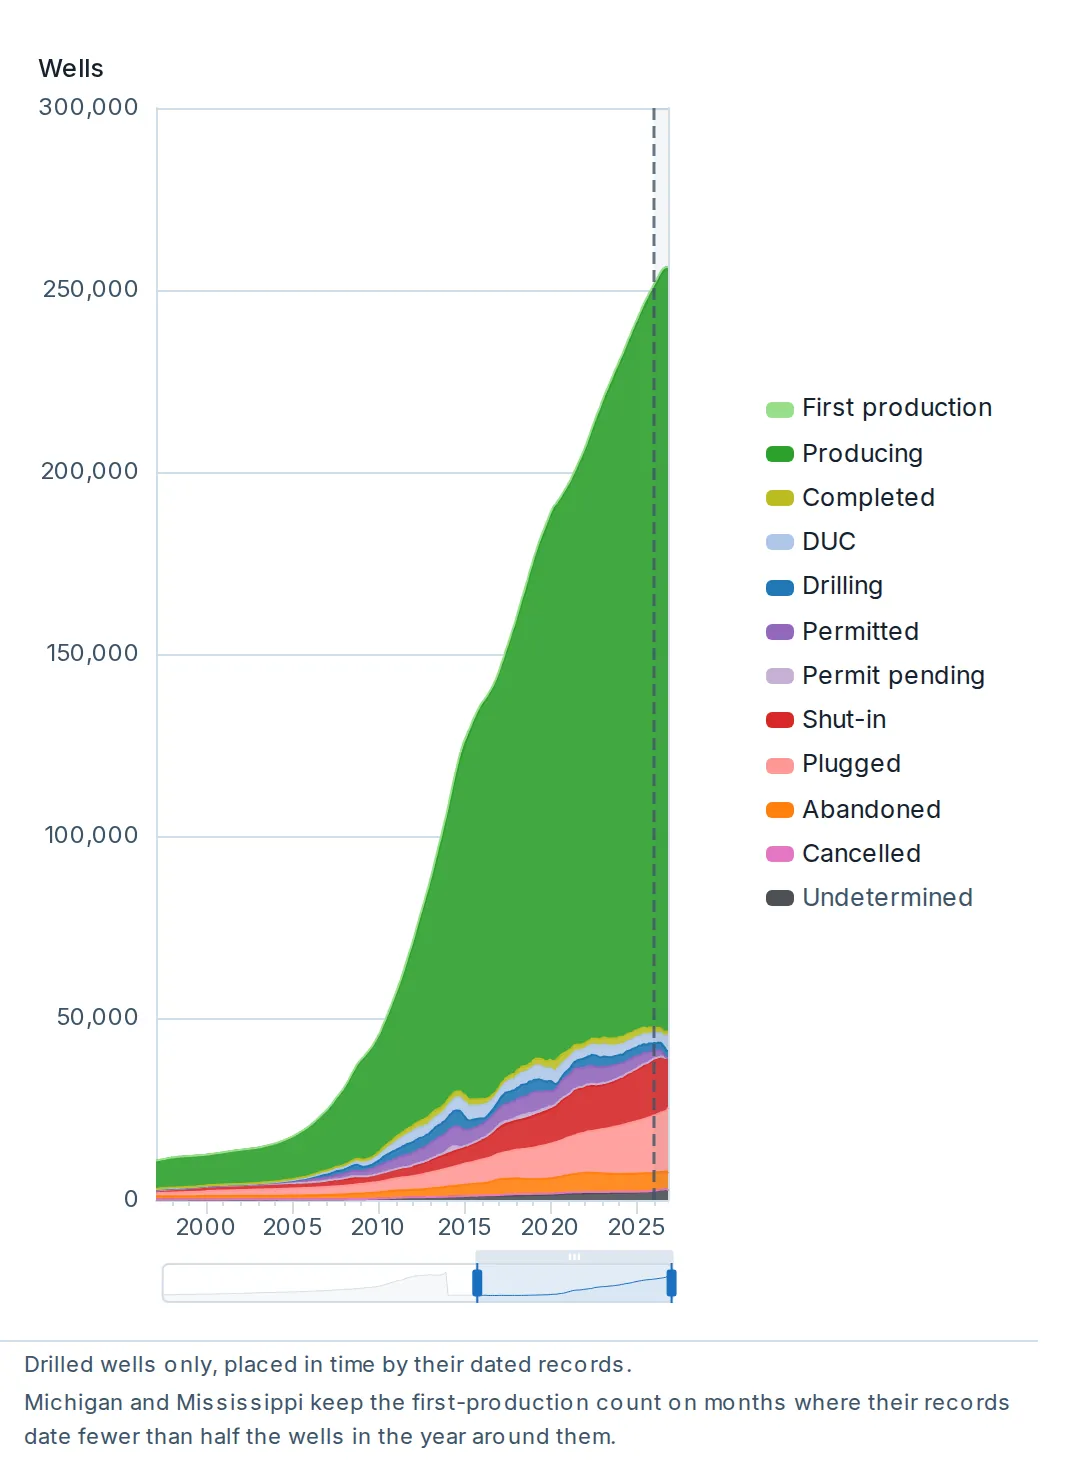
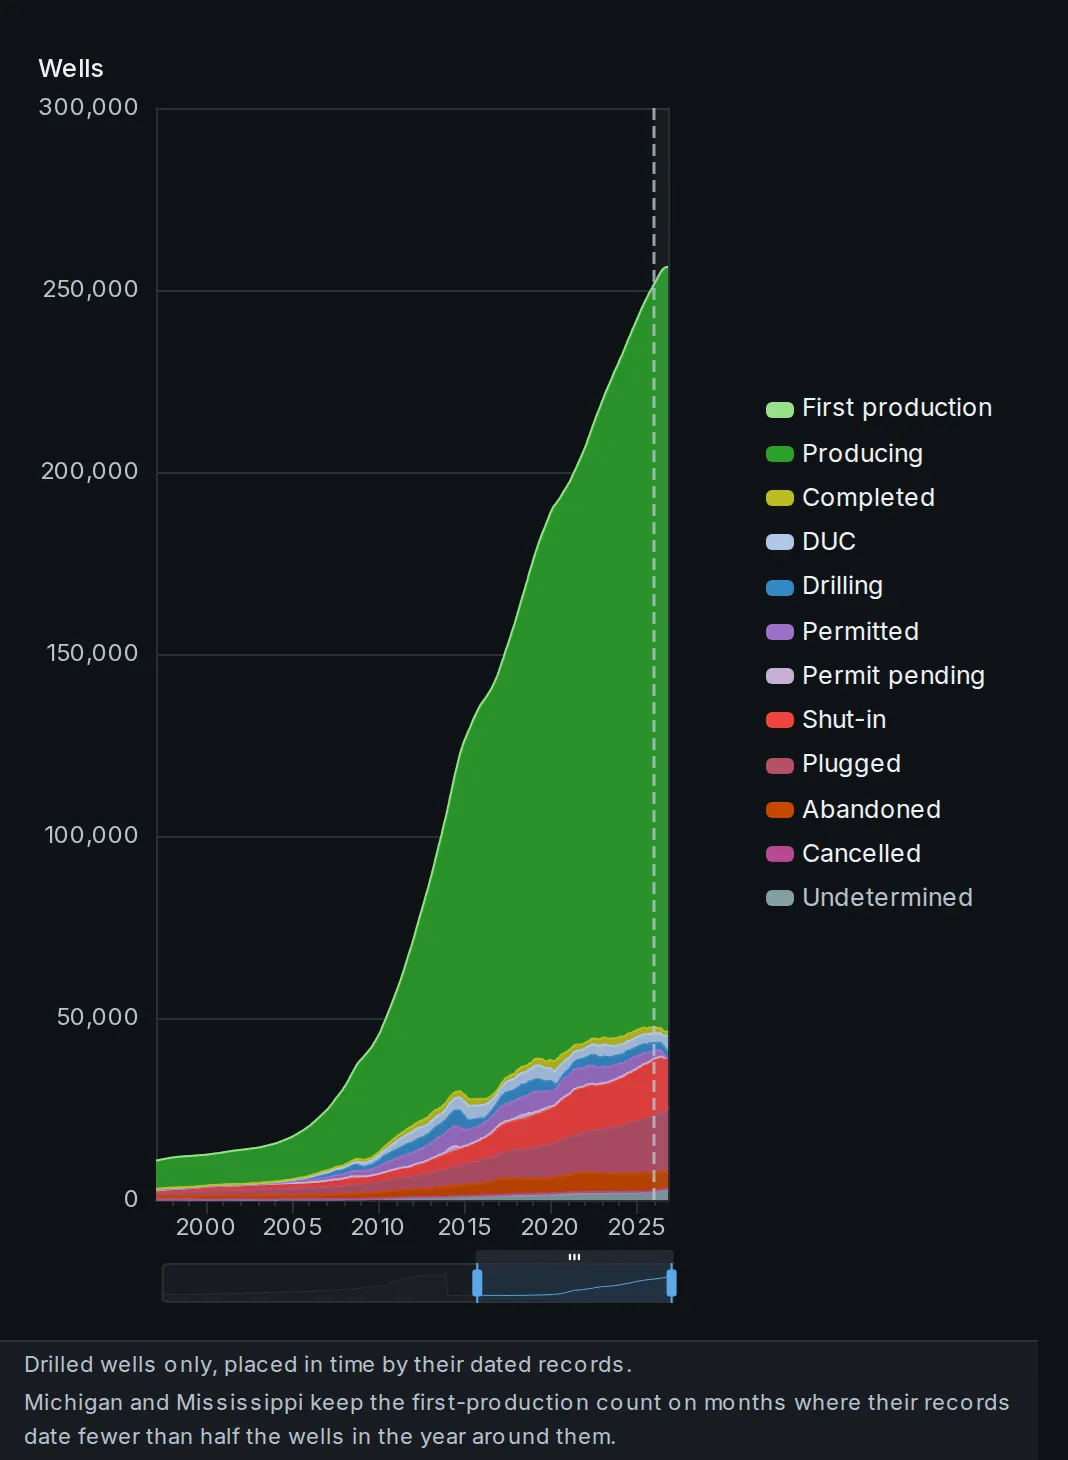
How many wells sit at each stage of life, month by month.
From permit to producing to plugged, counted from the dated records. Group by lifecycle stage, by rate or cumulative bins, or by the same dimensions you filter on.
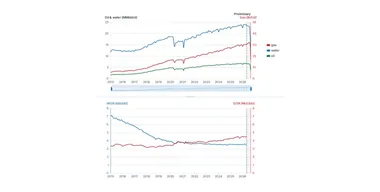
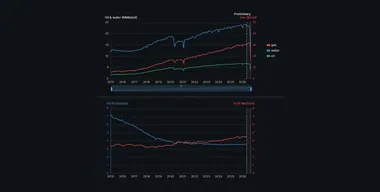 Oil, gas and water as daily rates, with the gas-oil and water-oil ratios below.
Each ratio adds up the gas or water and the oil of the wells and units that report both, then divides the two sums. Group the ratio chart, one ratio at a time, or split GOR and WOR into two charts.
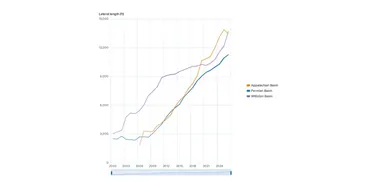
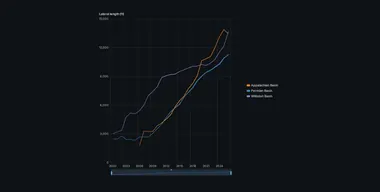 Completion design through time: proppant loading, lateral length, fluid volume.
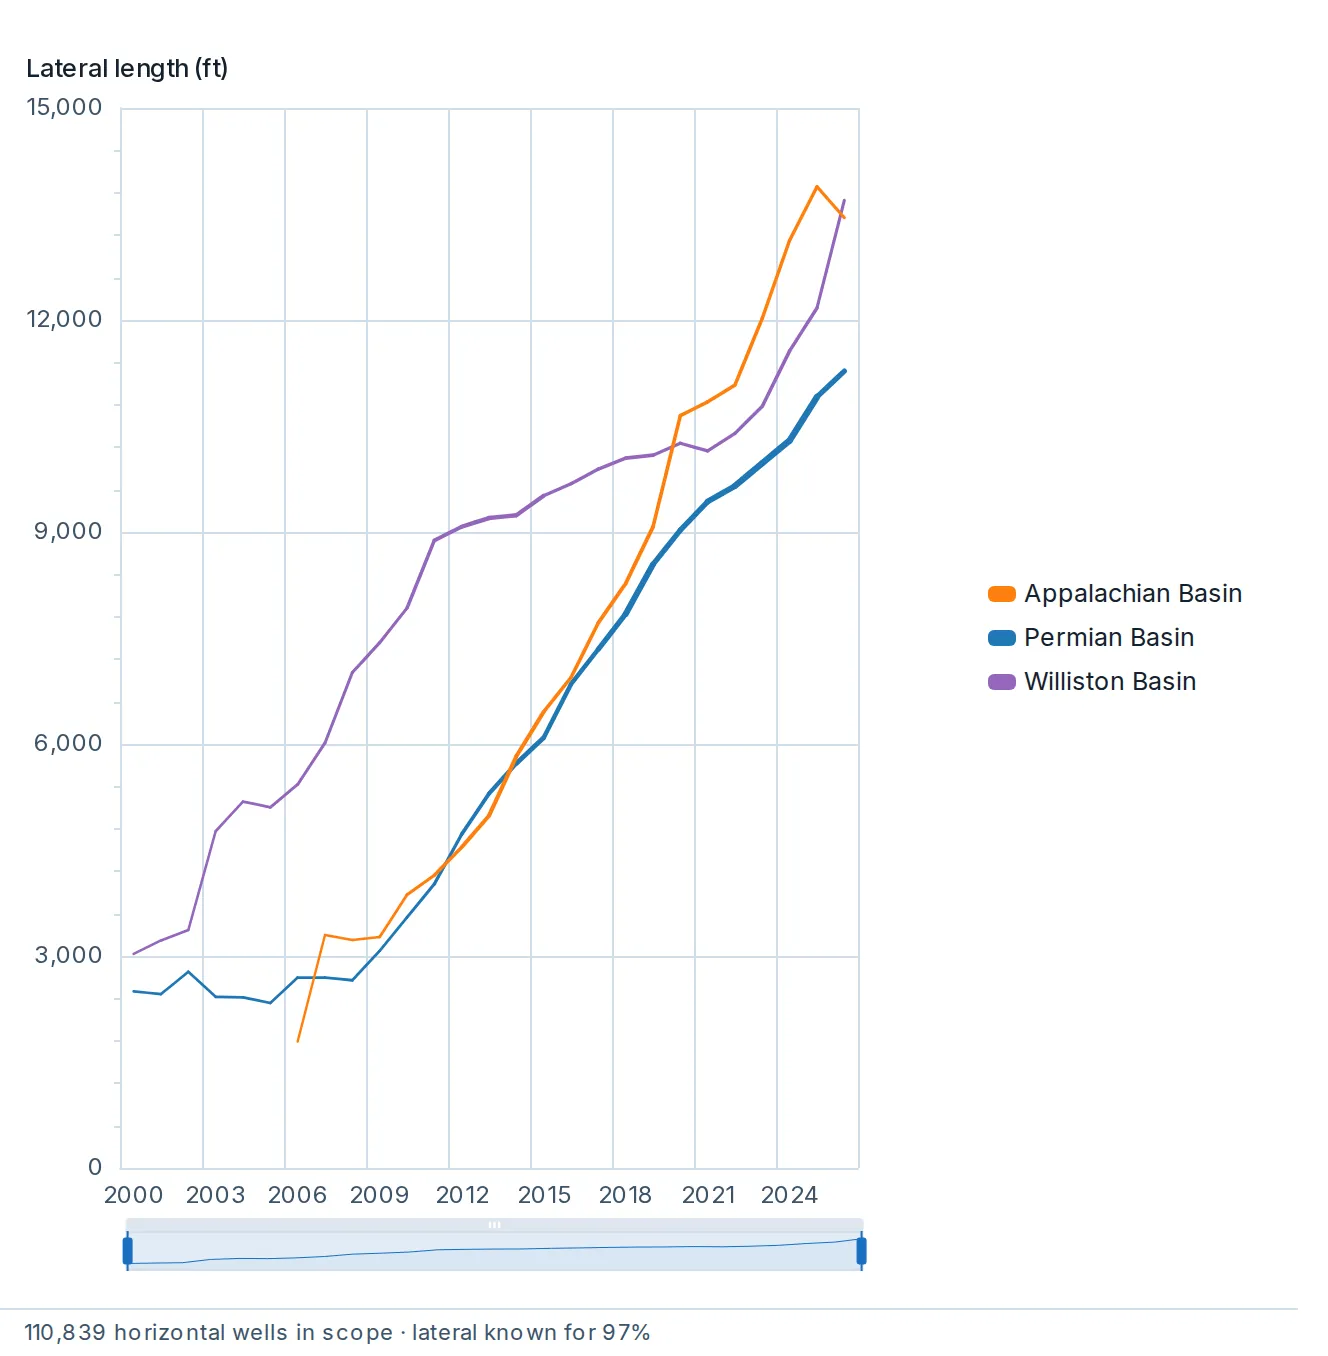
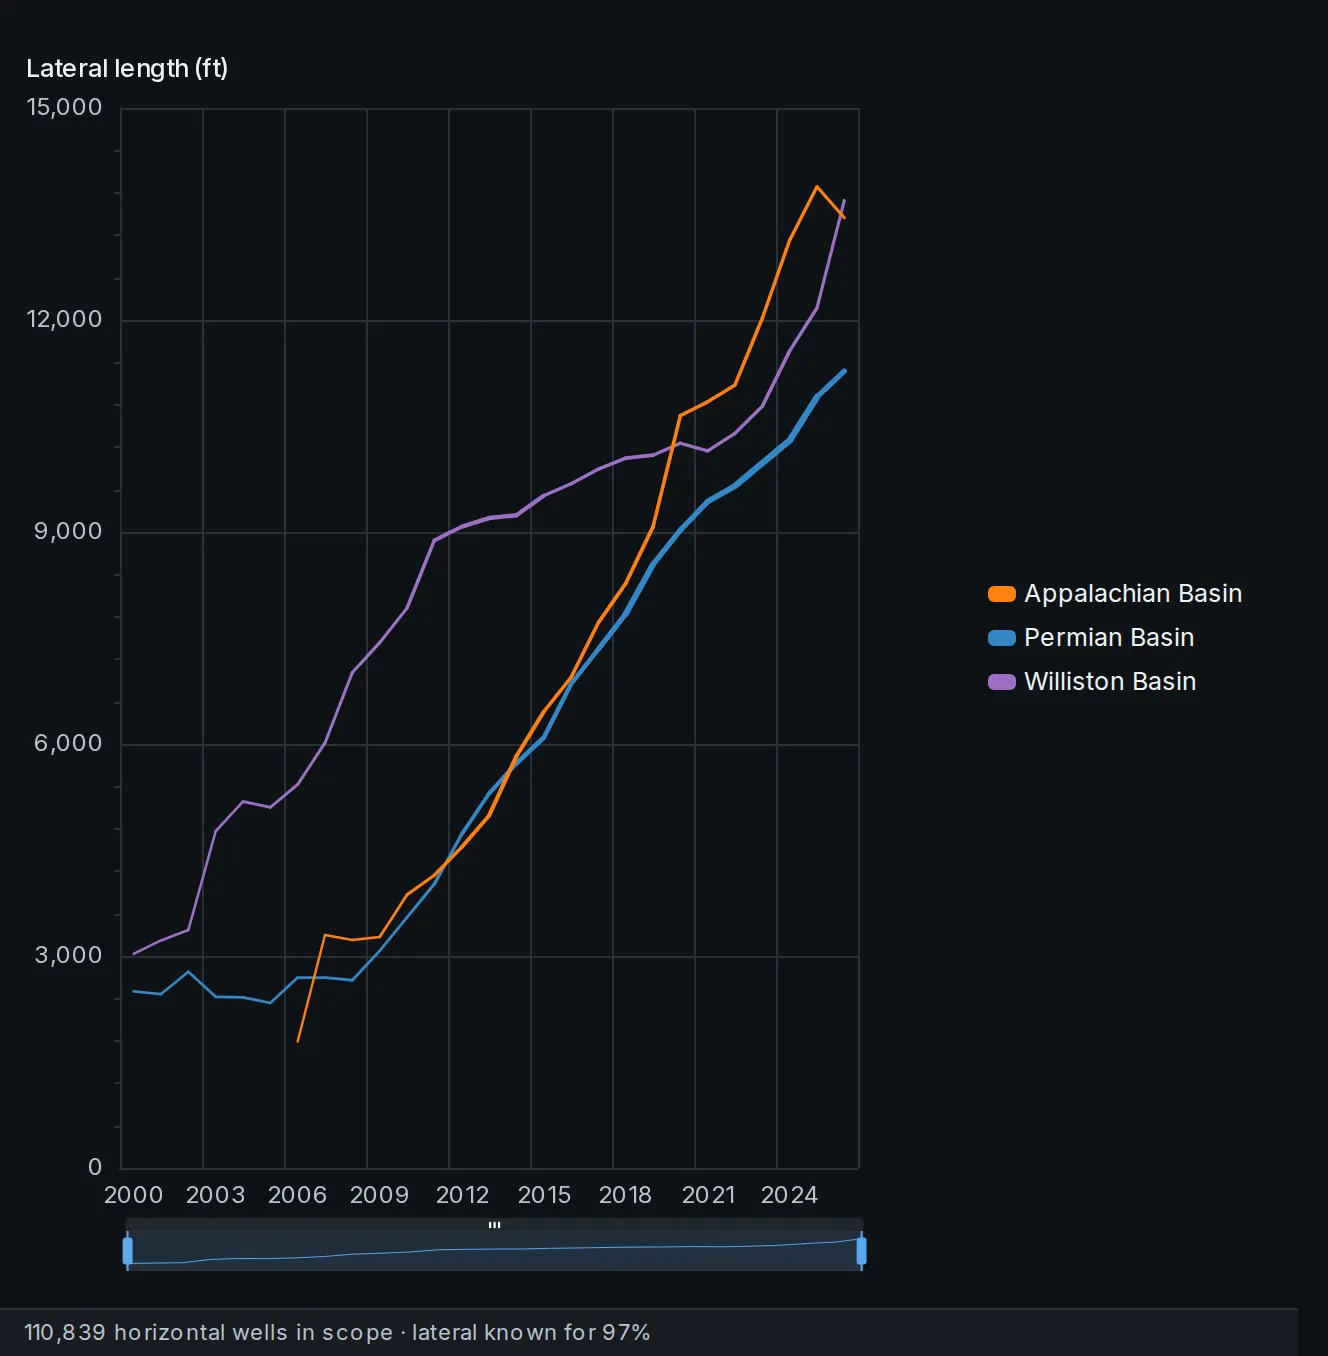
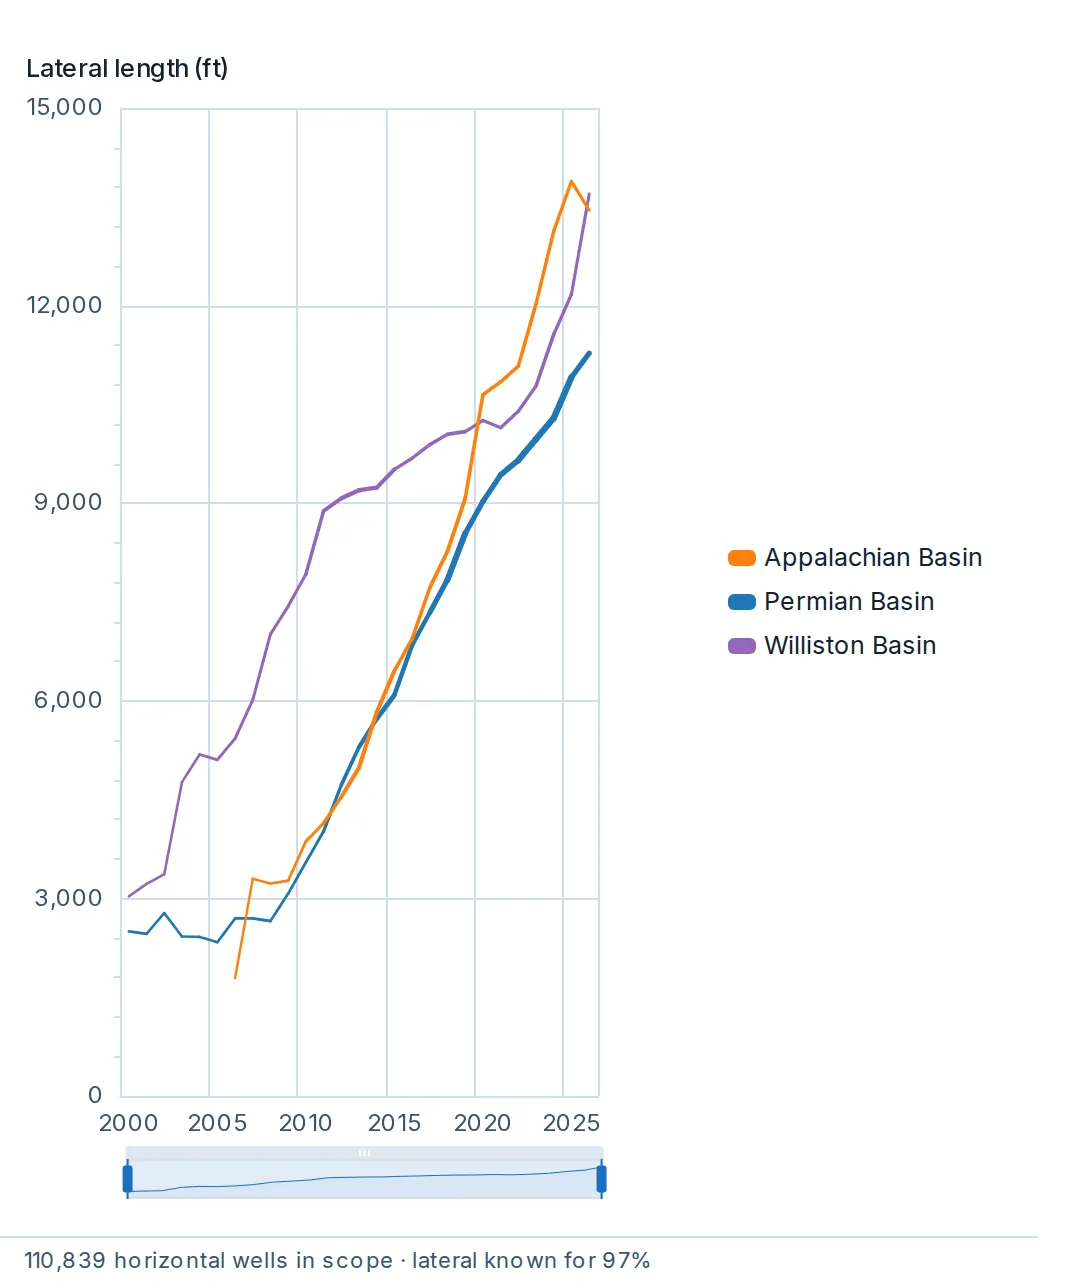
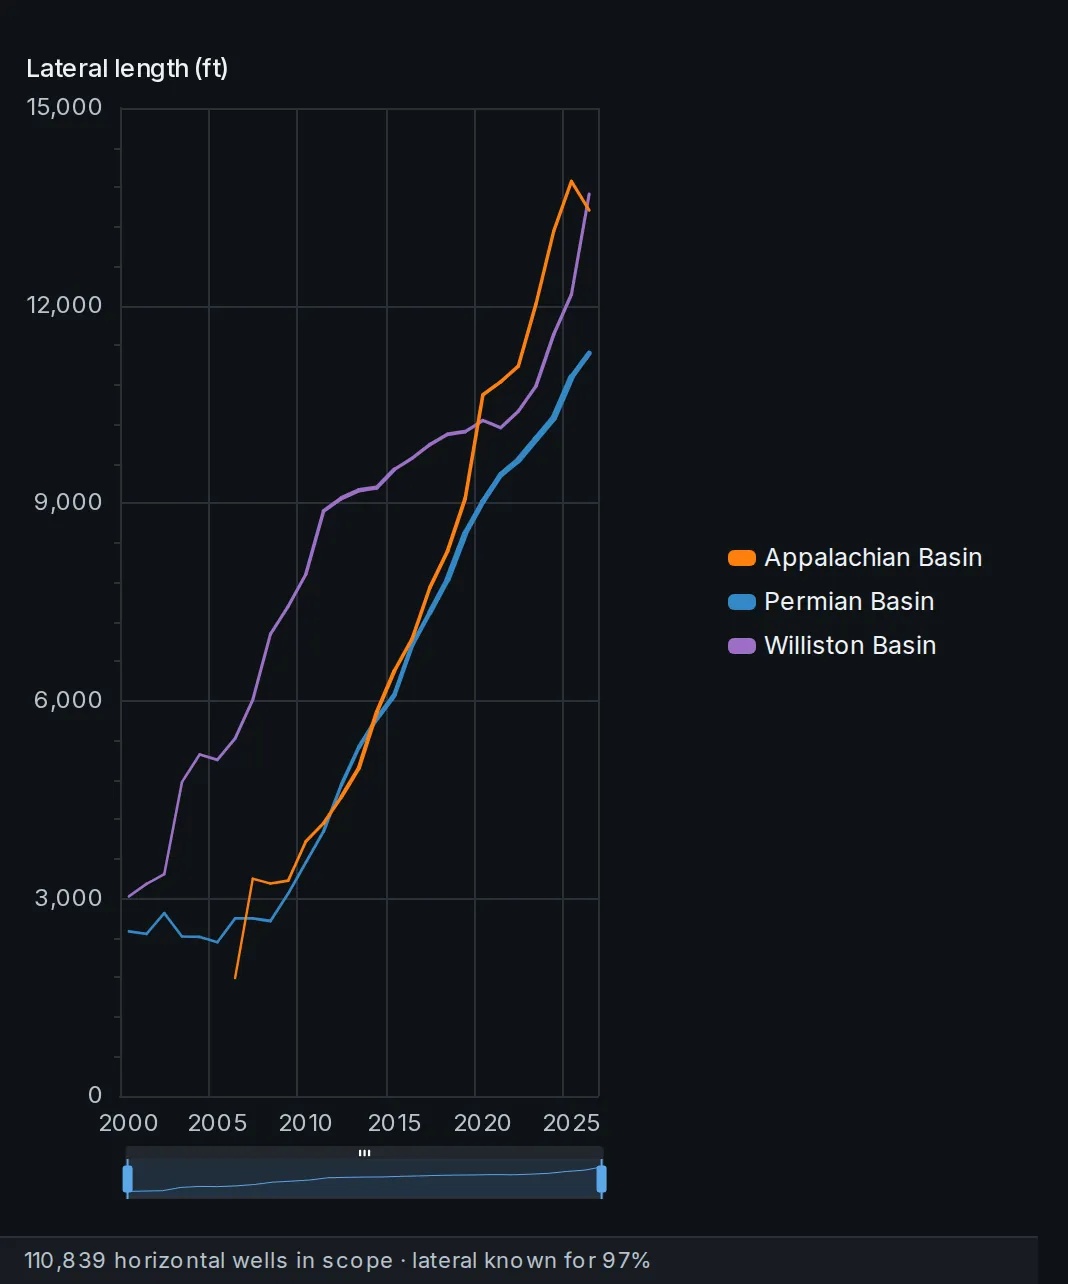
Completion design through time: proppant loading, lateral length, fluid volume.
Averages by first-production year for horizontal wells, with line thickness tracking how many wells each line is drawn from.
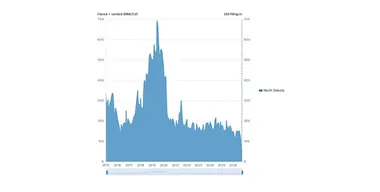
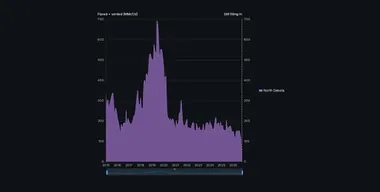 Gas reported flared and vented, as the regulators publish it, for the same wells as Total production.
Every filter and grouping reads here as on Total production, as a volume or as a share of the gas the filing wells produced in the months flaring was filed. Reporting bases differ by region, and the line under the chart says what is left out.
The typical gap to the nearest lateral beside each horizontal well, by the year production started and over time.
The typical gap to the nearest lateral beside each horizontal well, by the year production started and over time.
How the gaps are spread, how many benches hold laterals nearby, which benches the wells sit in, and productivity by bench, in the regions where spacing is measured. The map paints drilled lateral footage per square mile over surveyed laterals.
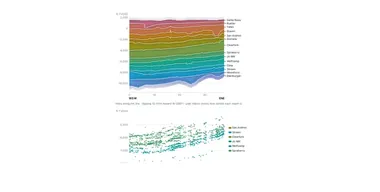
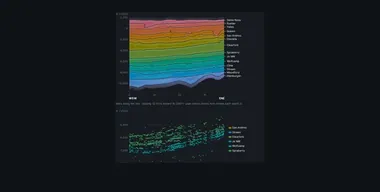 Draw a line on the map and get a cross-section of the formations along it.
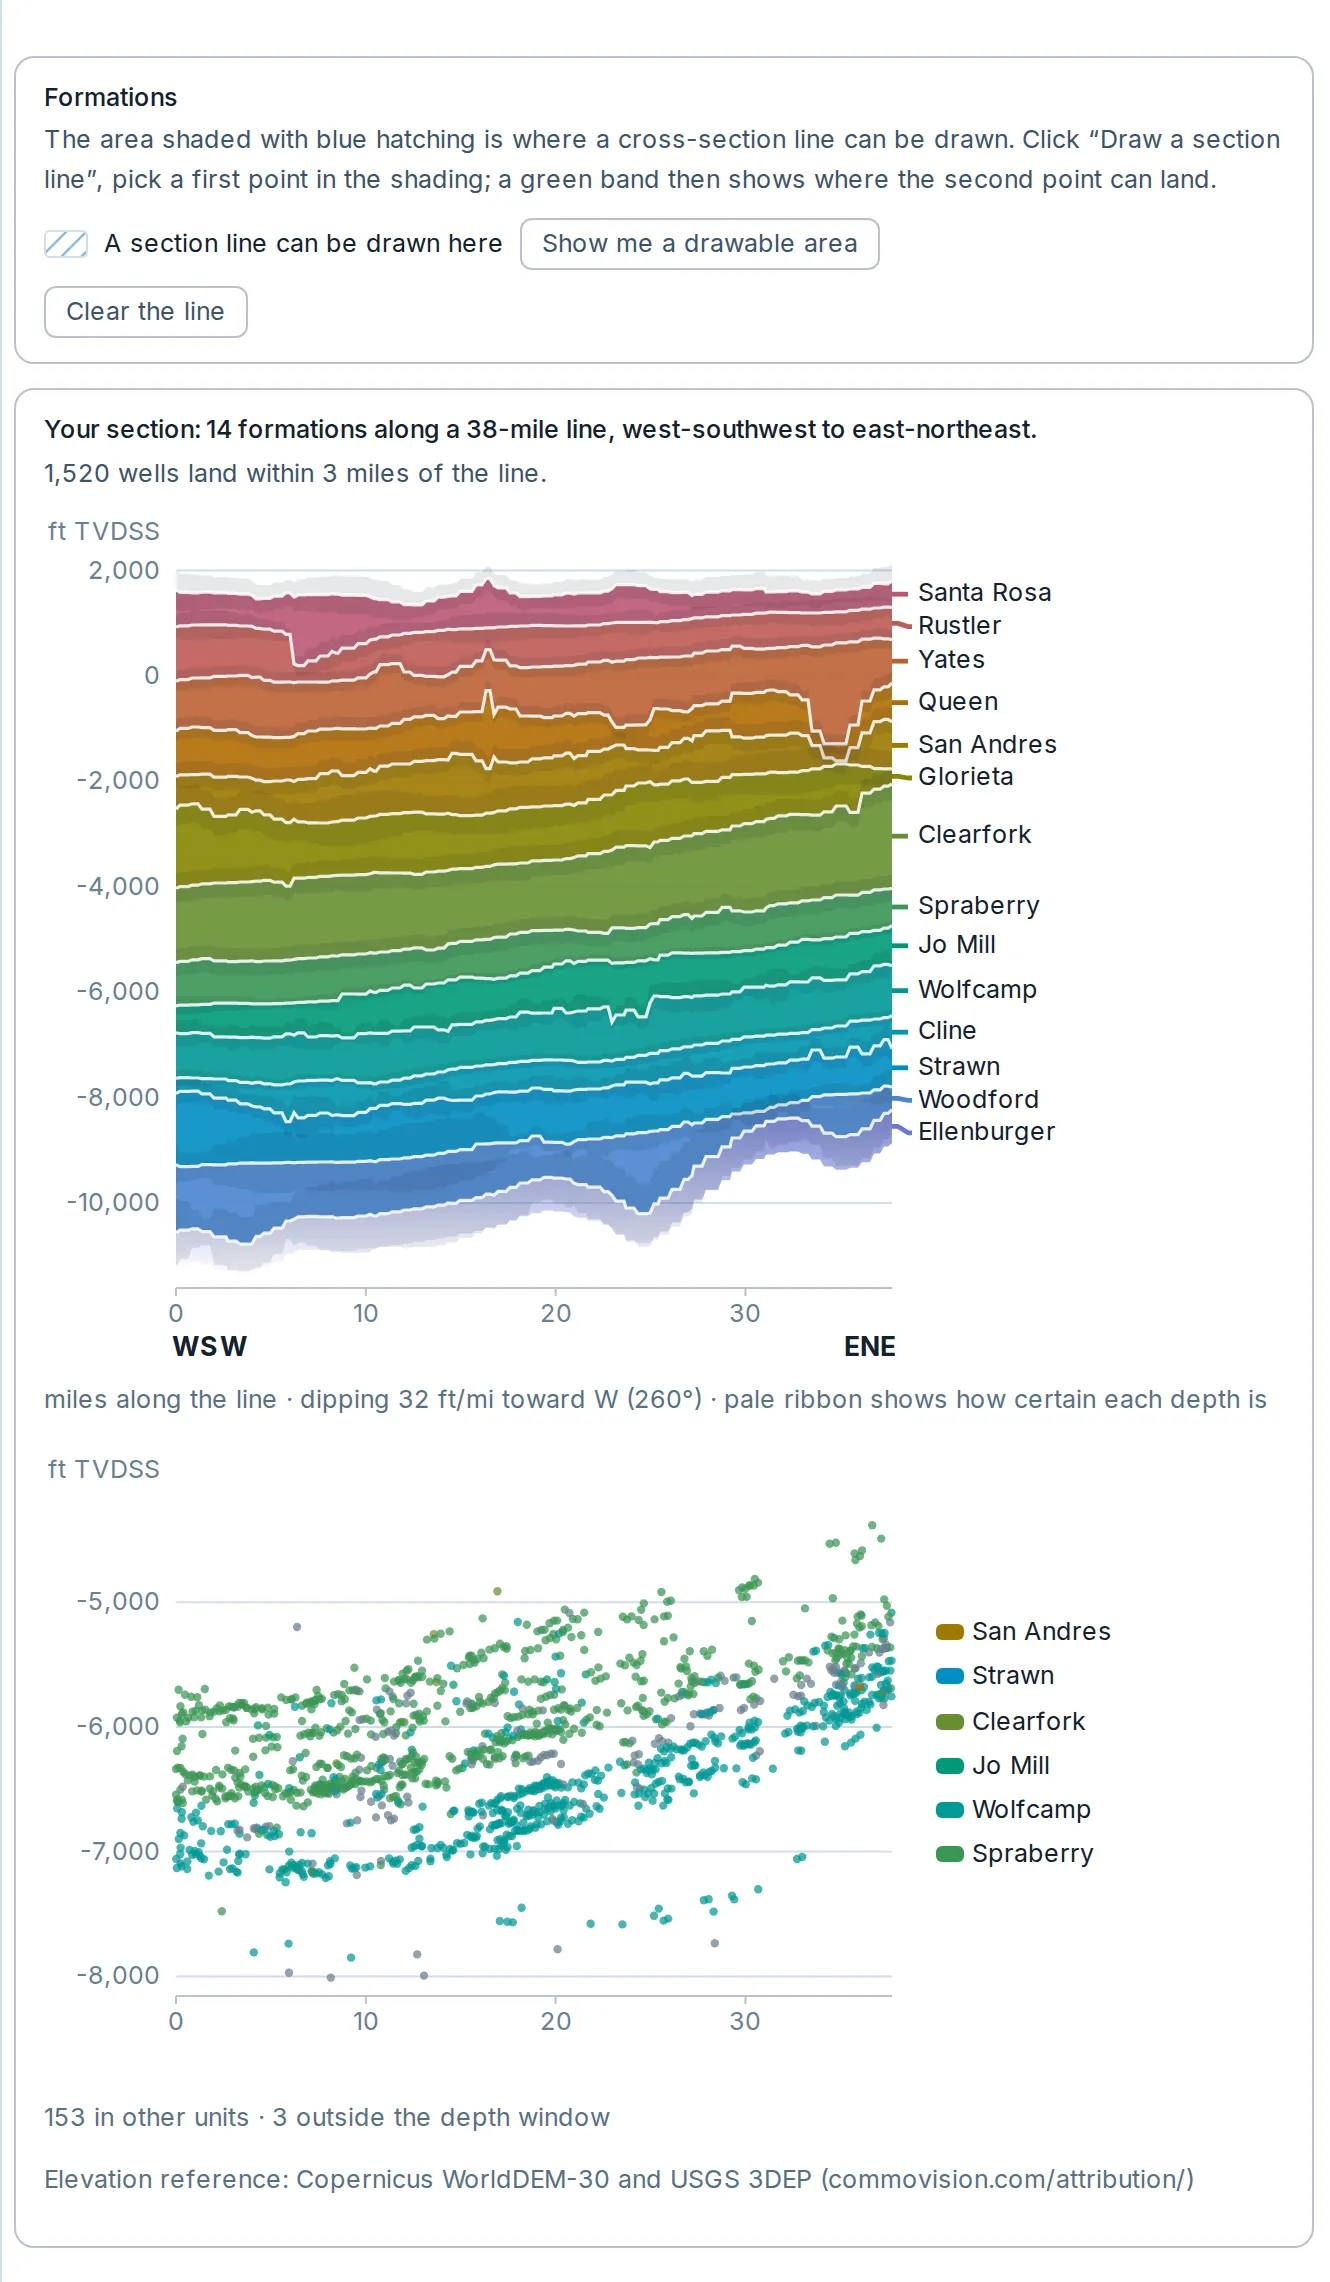
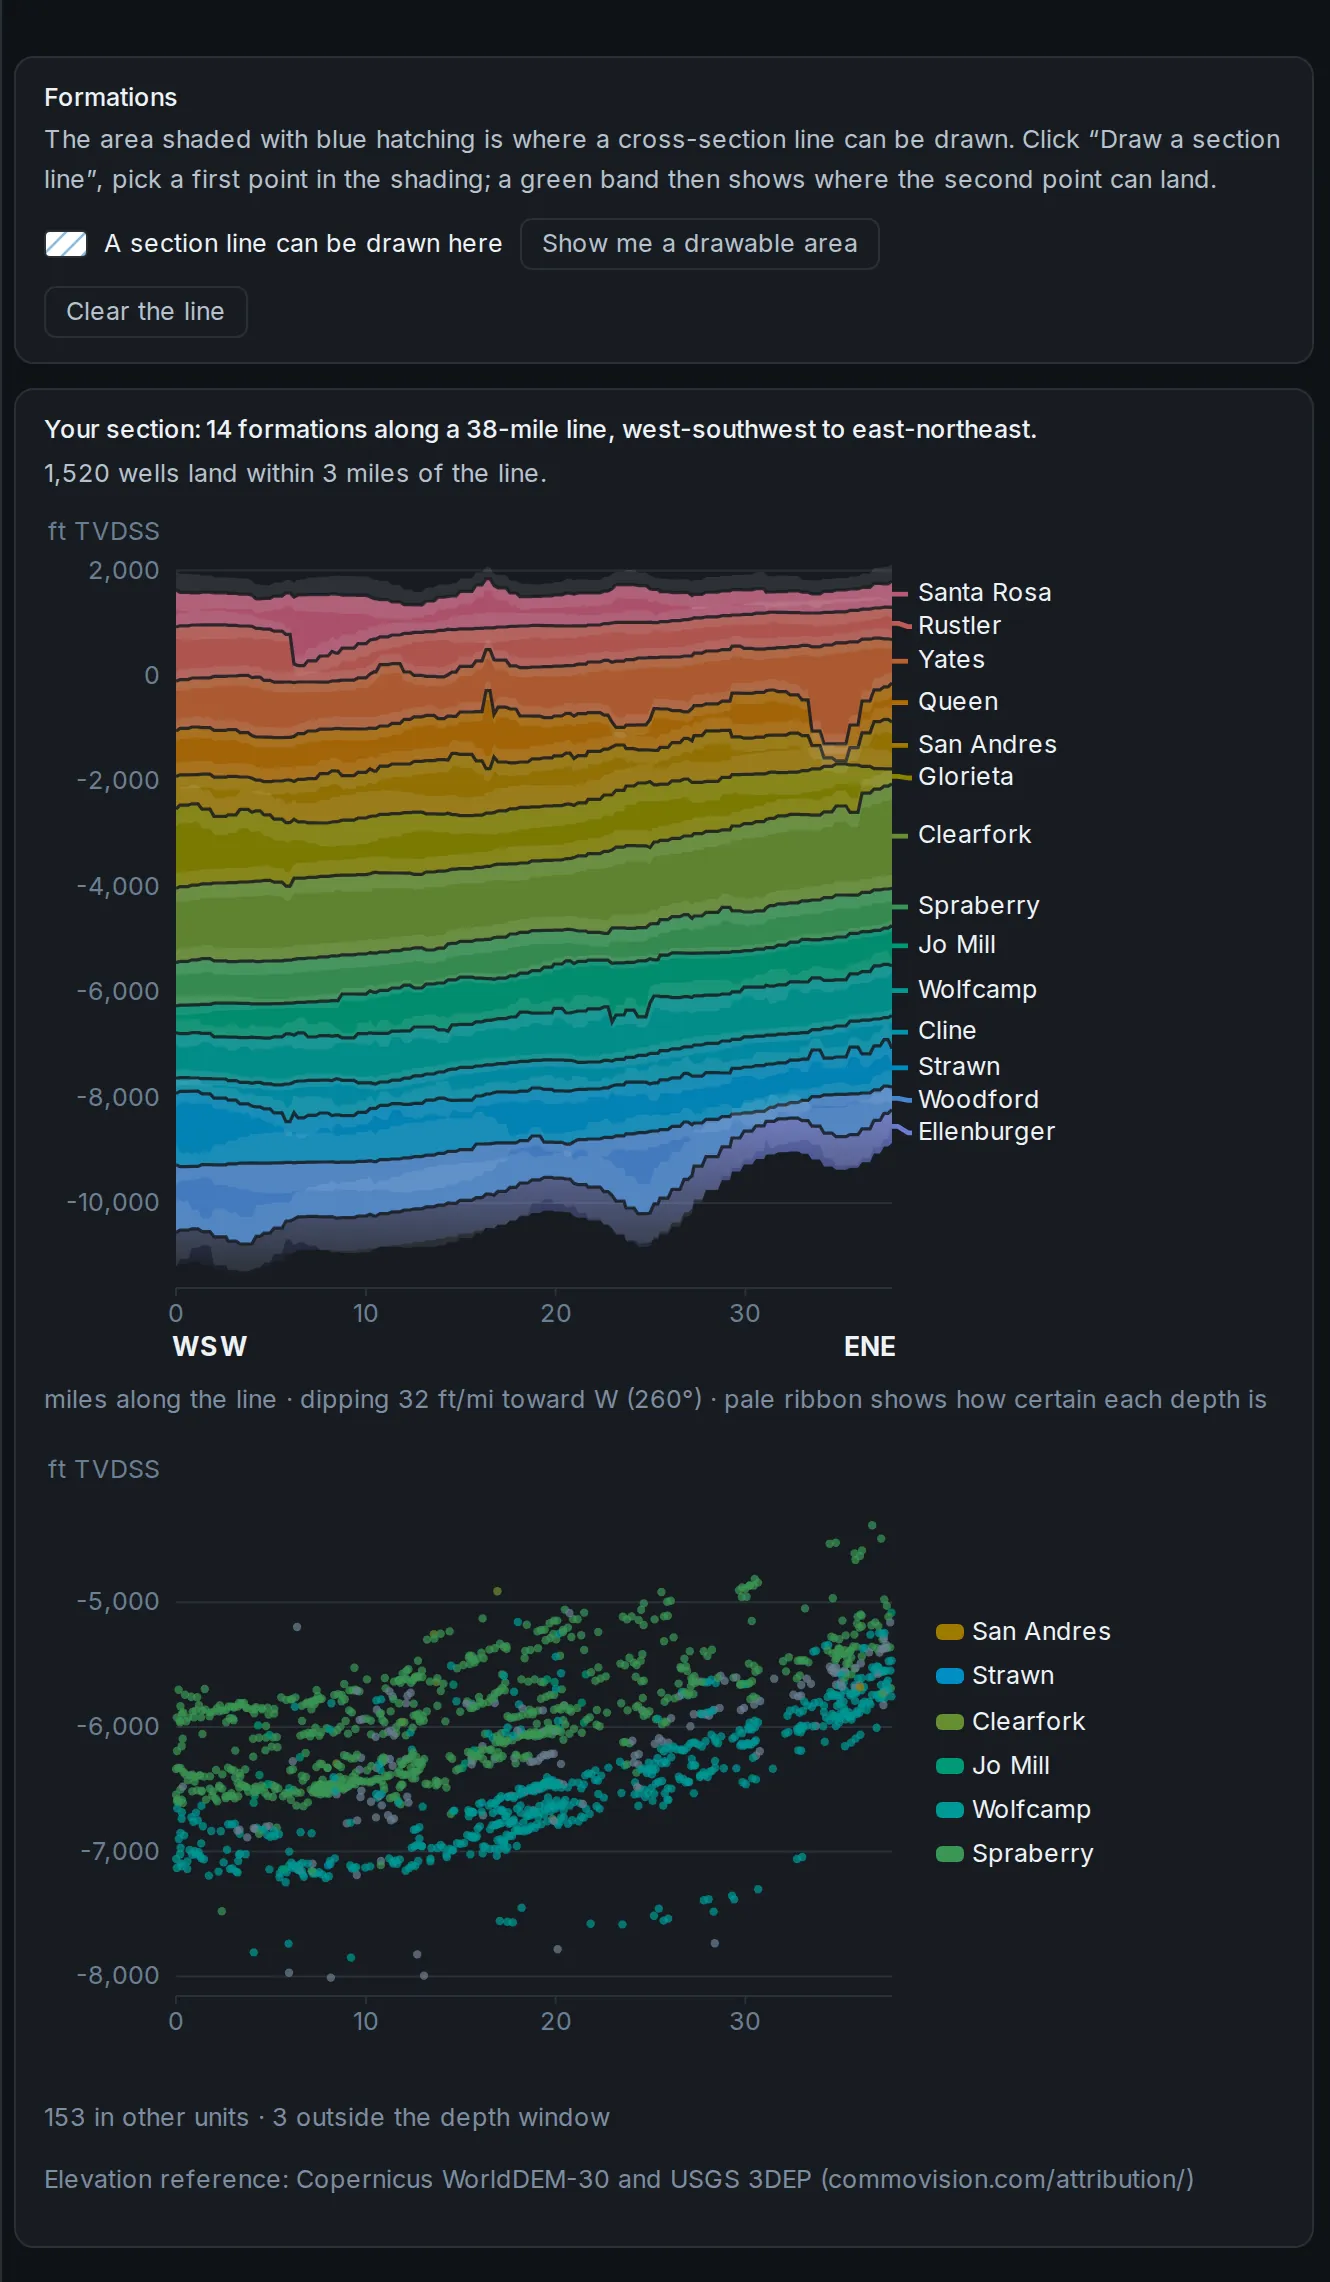
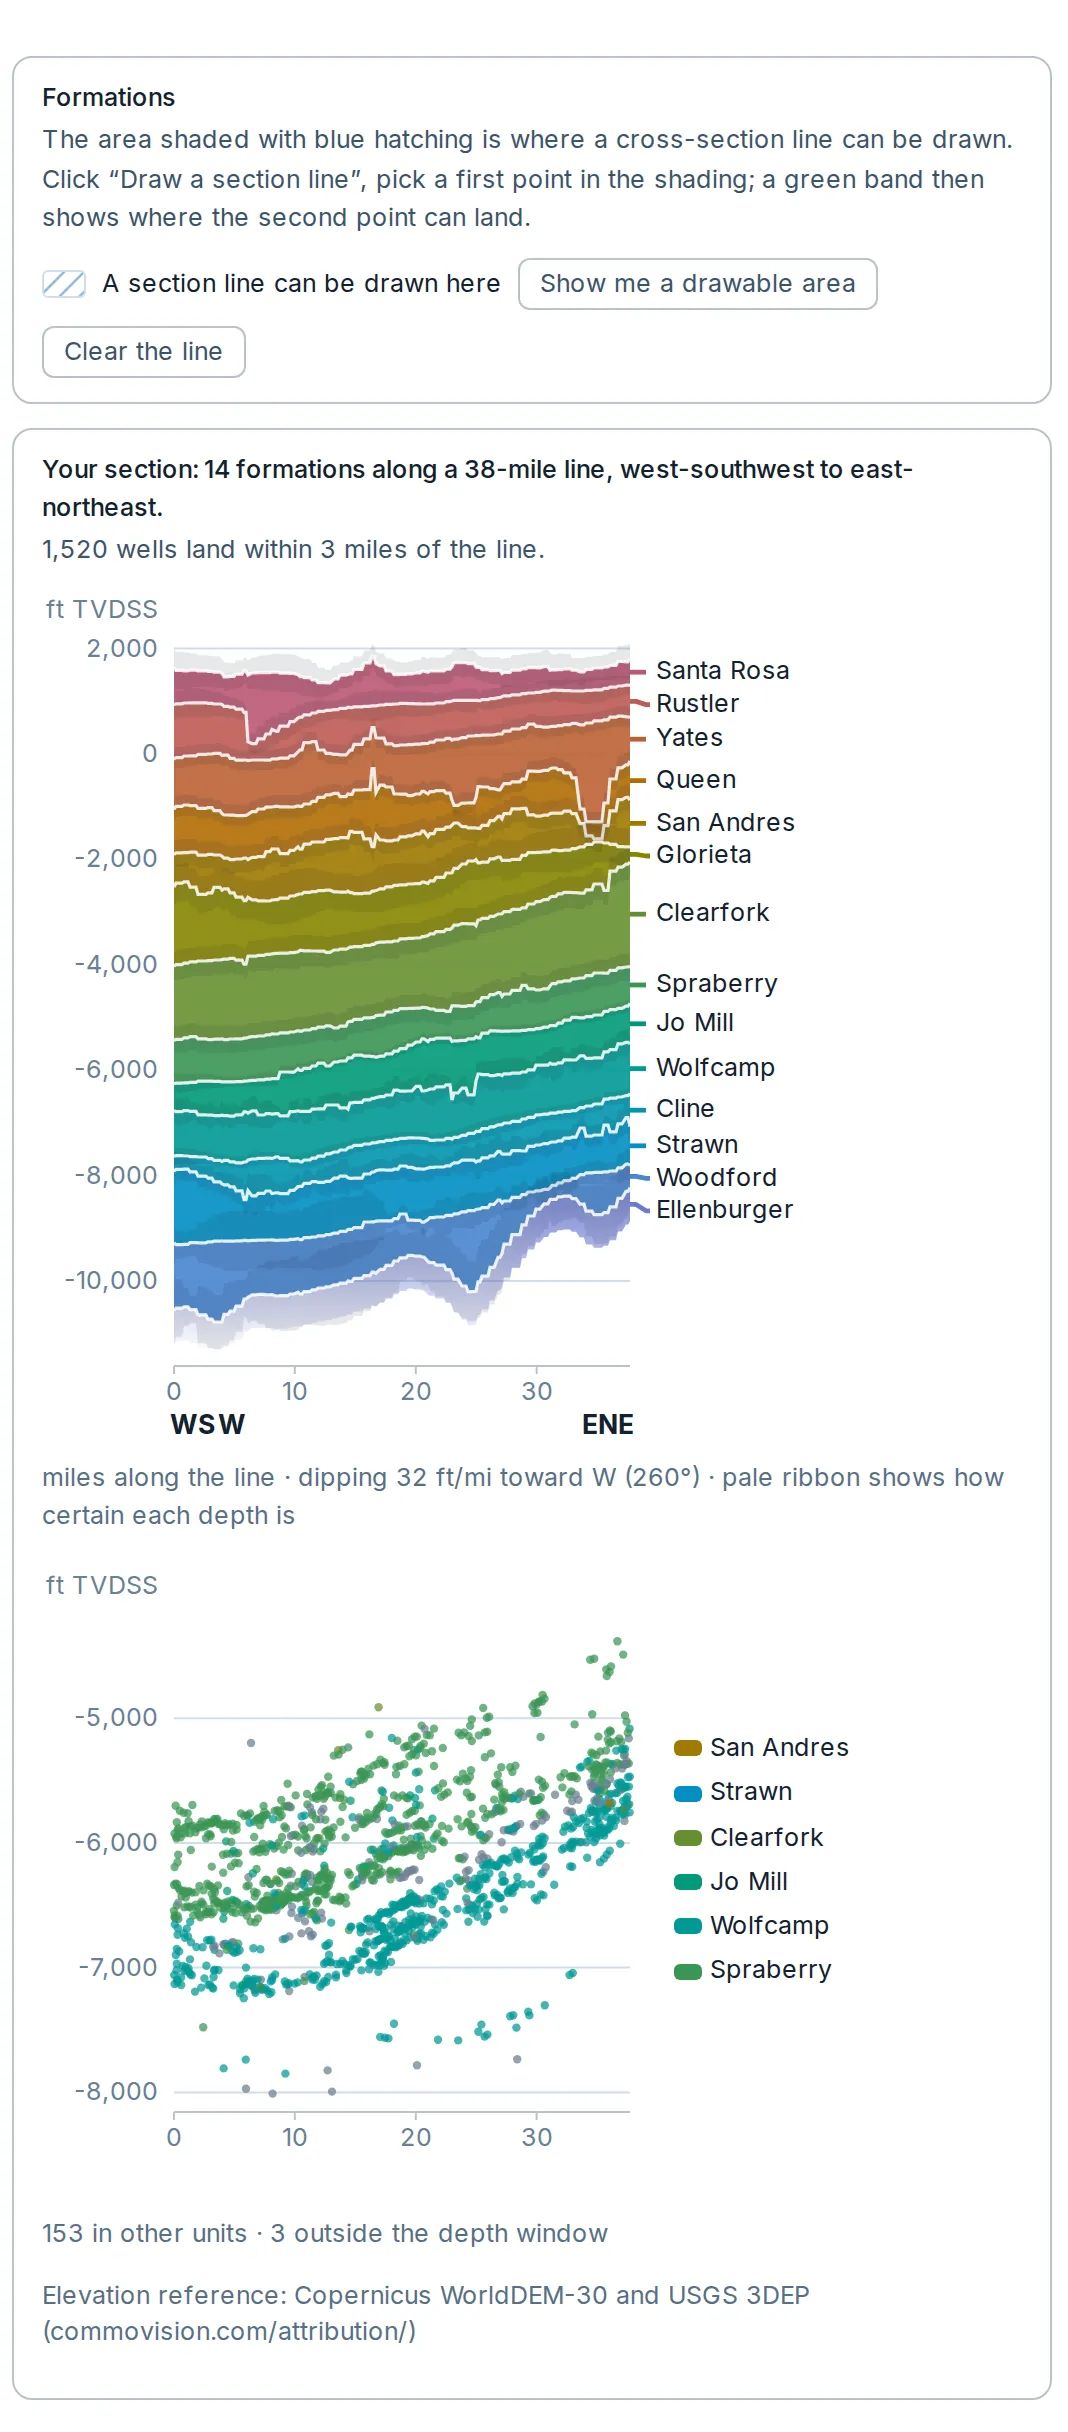
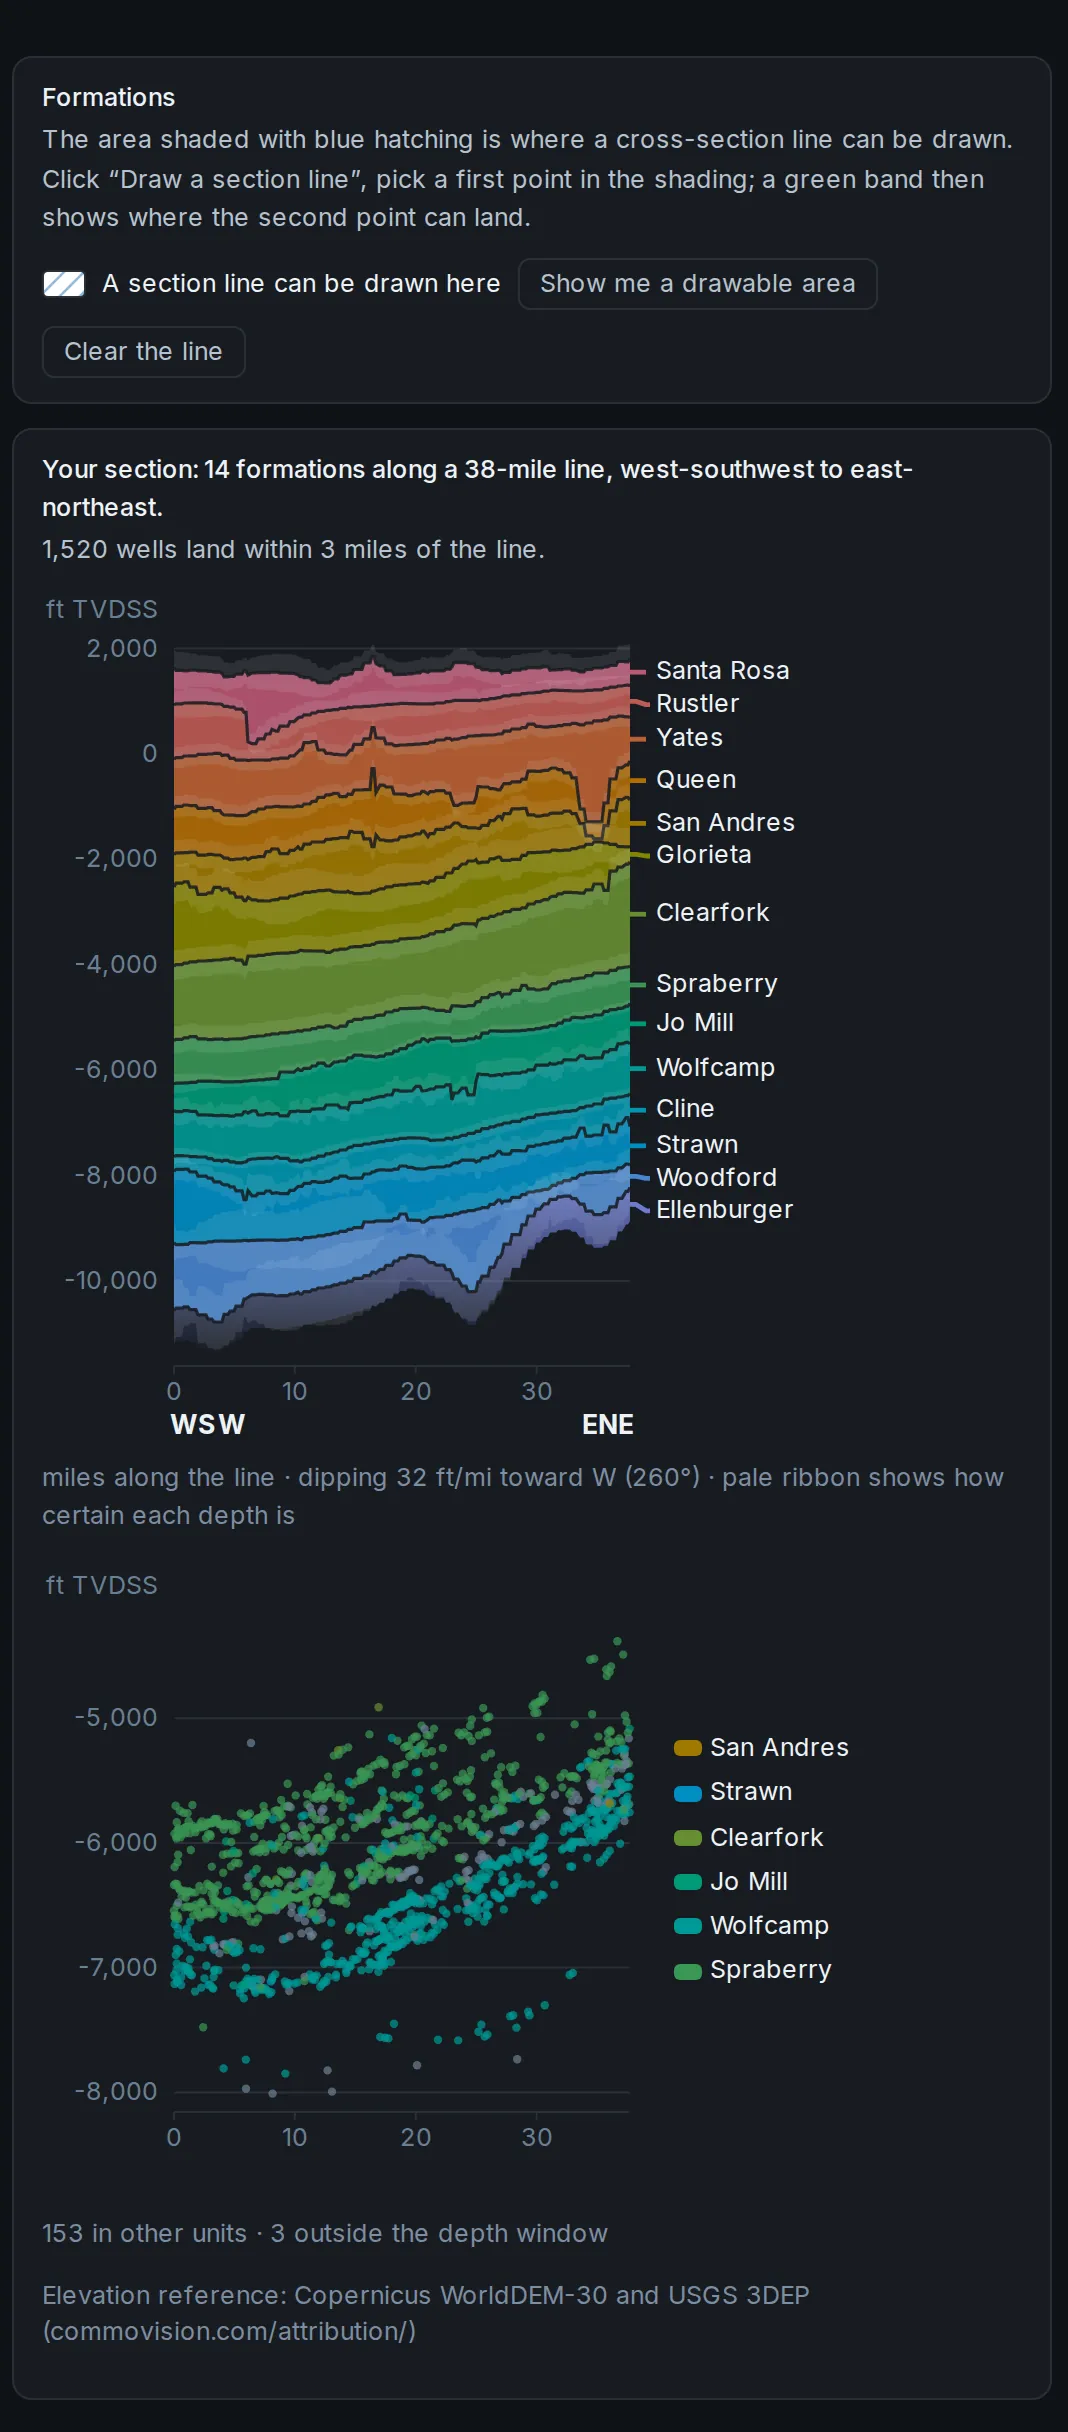
Draw a line on the map and get a cross-section of the formations along it.
The section draws the formation surfaces along your line over a chart of the wells within it.
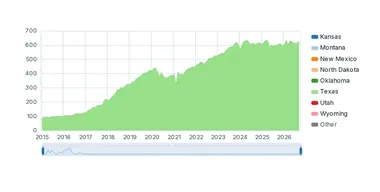
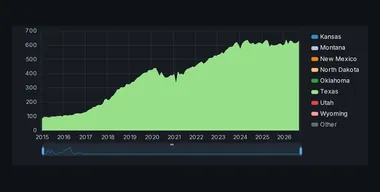 One company in one view: production, type curves, permitting and new wells, recent completions, well counts and company history.




One company in one view: production, type curves, permitting and new wells, recent completions, well counts and company history.
Pick an operator and every chart reads its wells, with your other filters carried: its production through time, type curves by first-production year, well counts by rows you pick, and the corporate history behind the name.
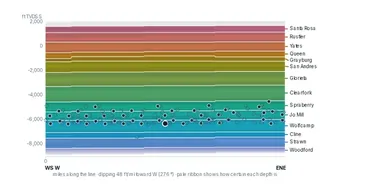
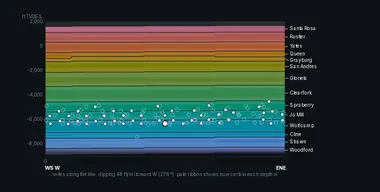 The wells you select, one card each.
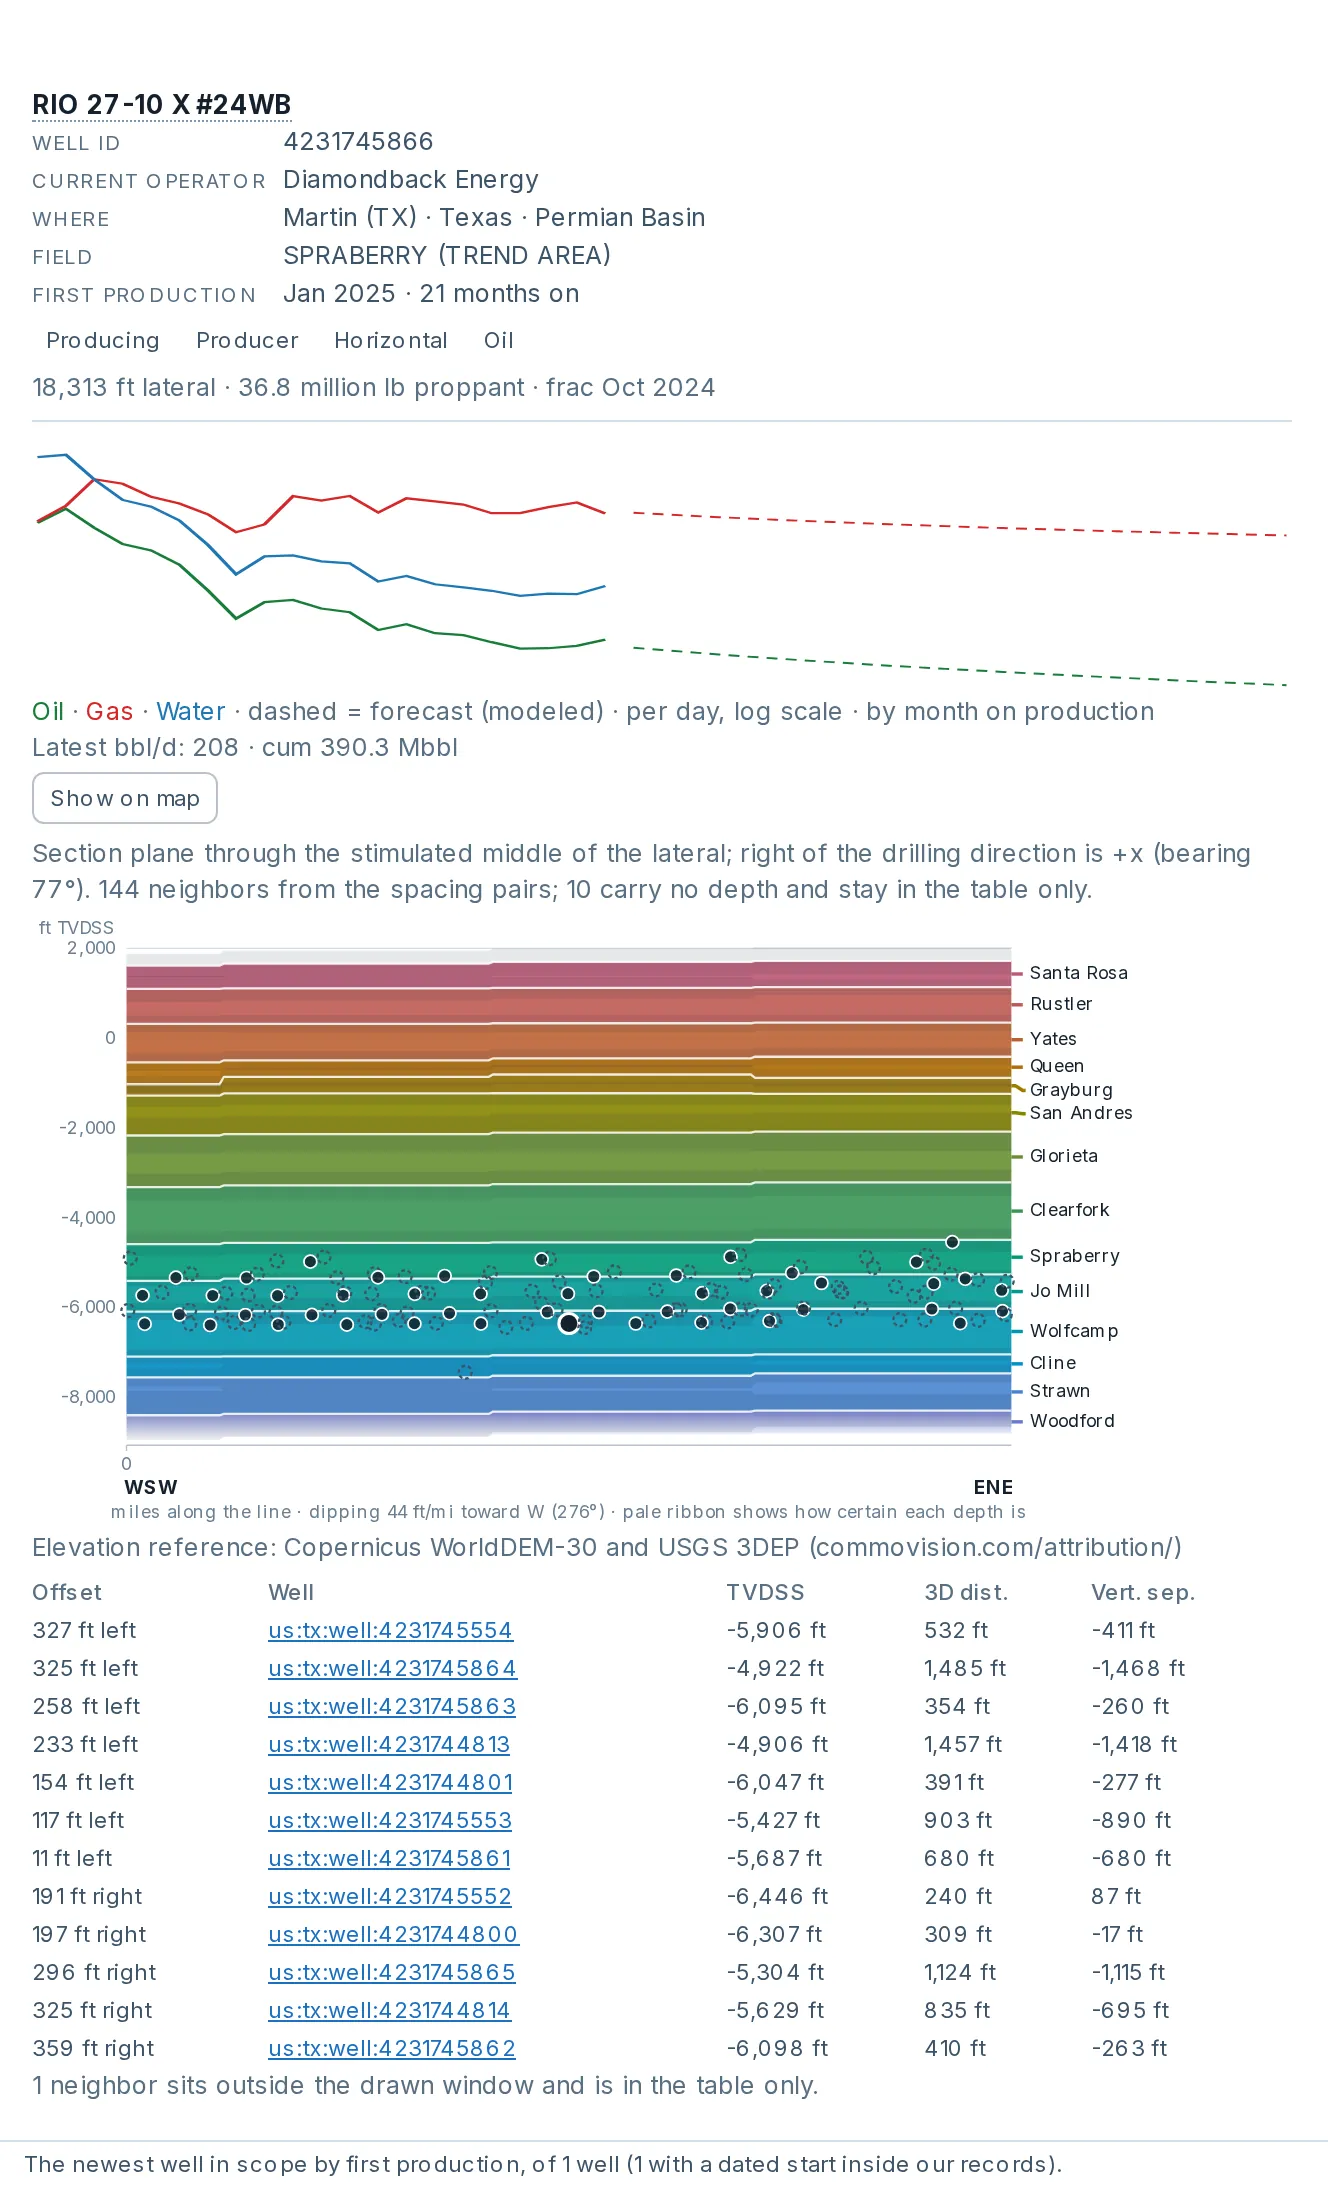
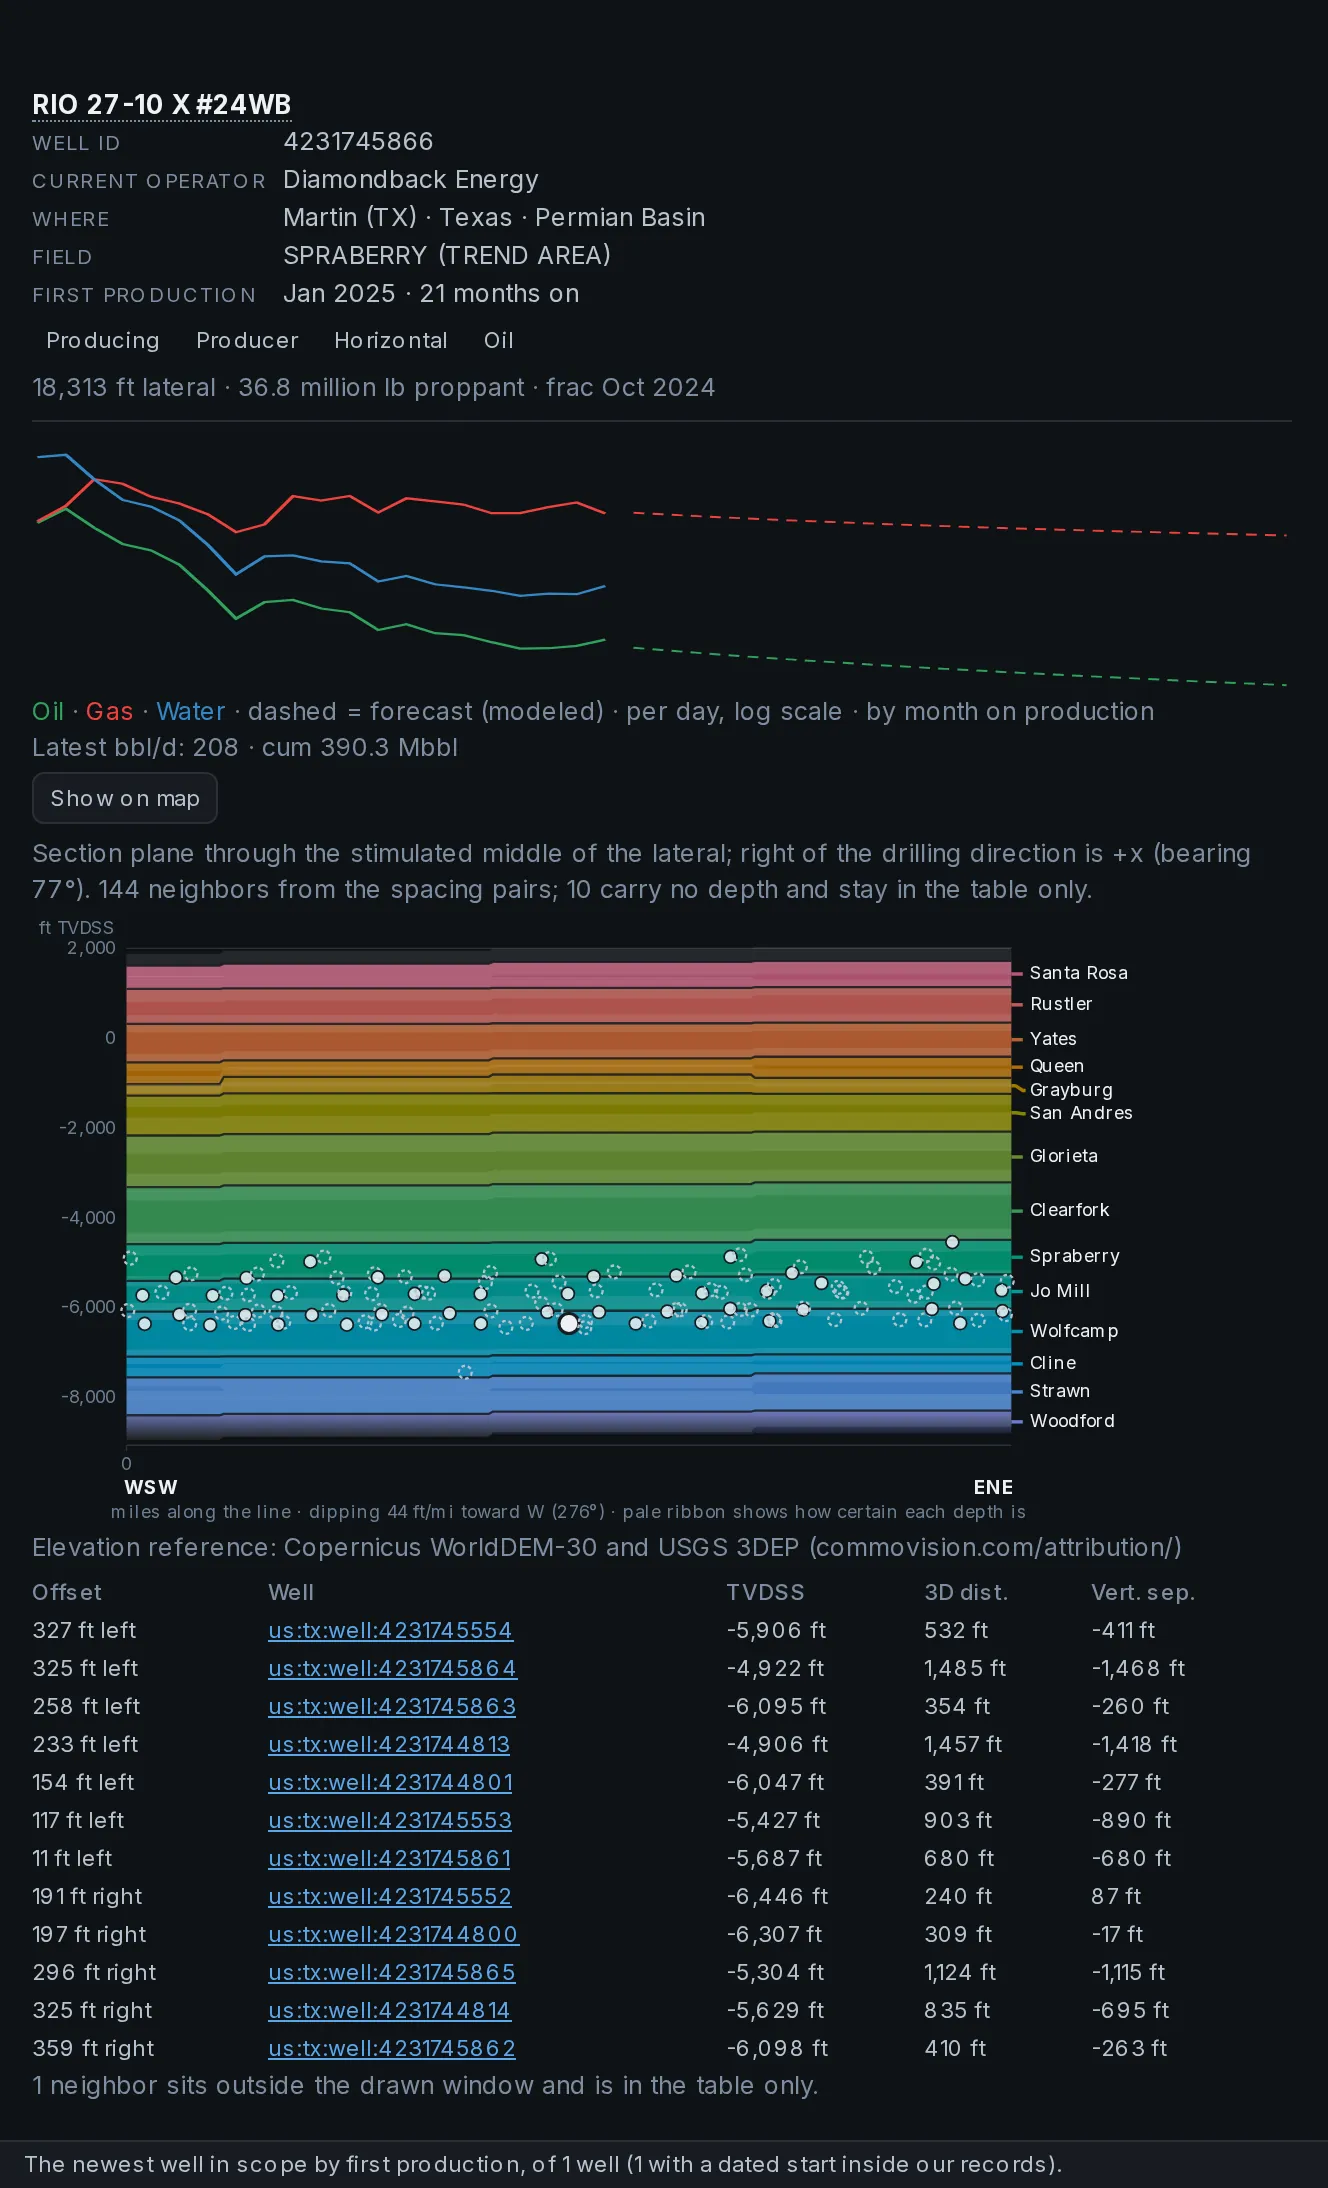
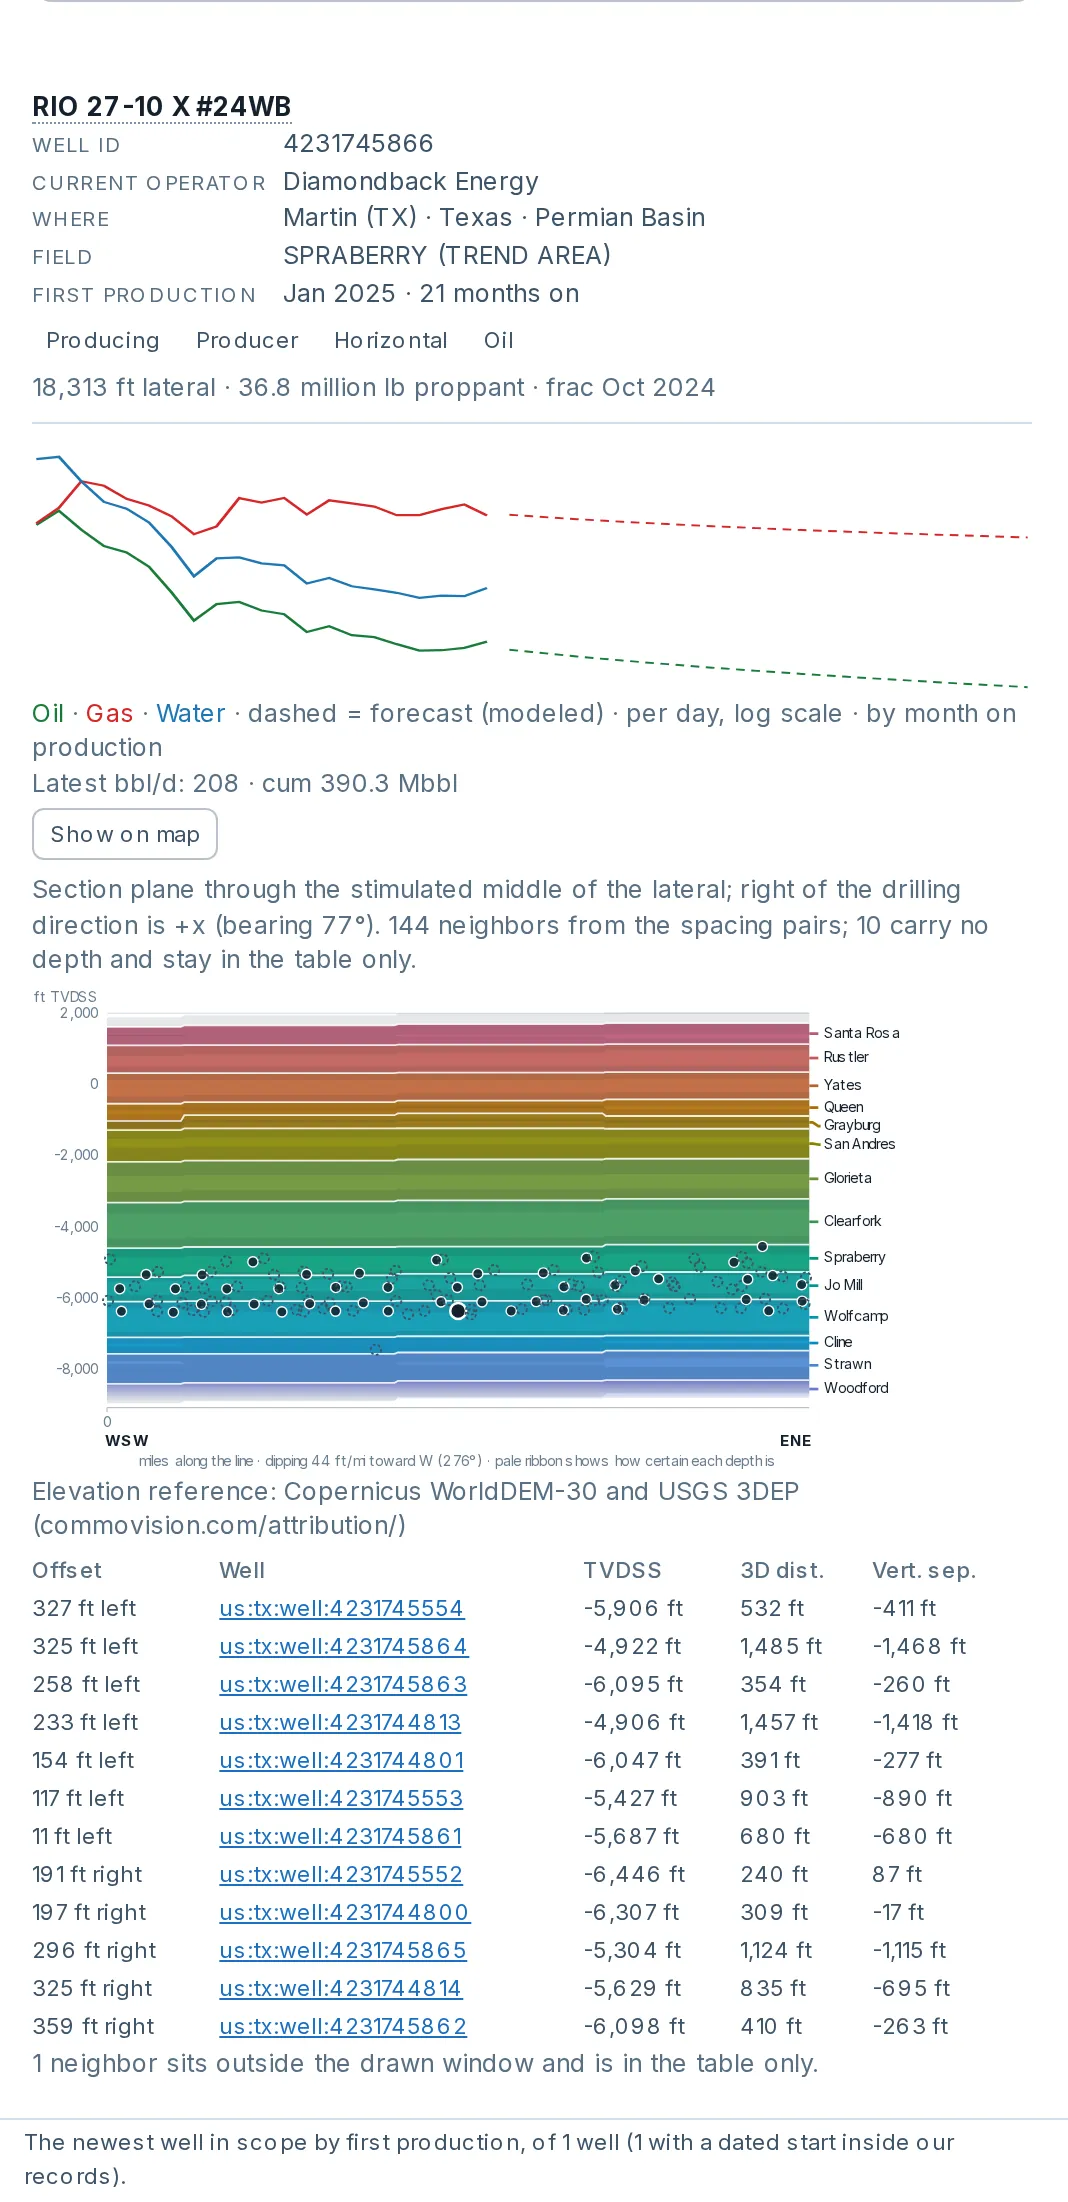
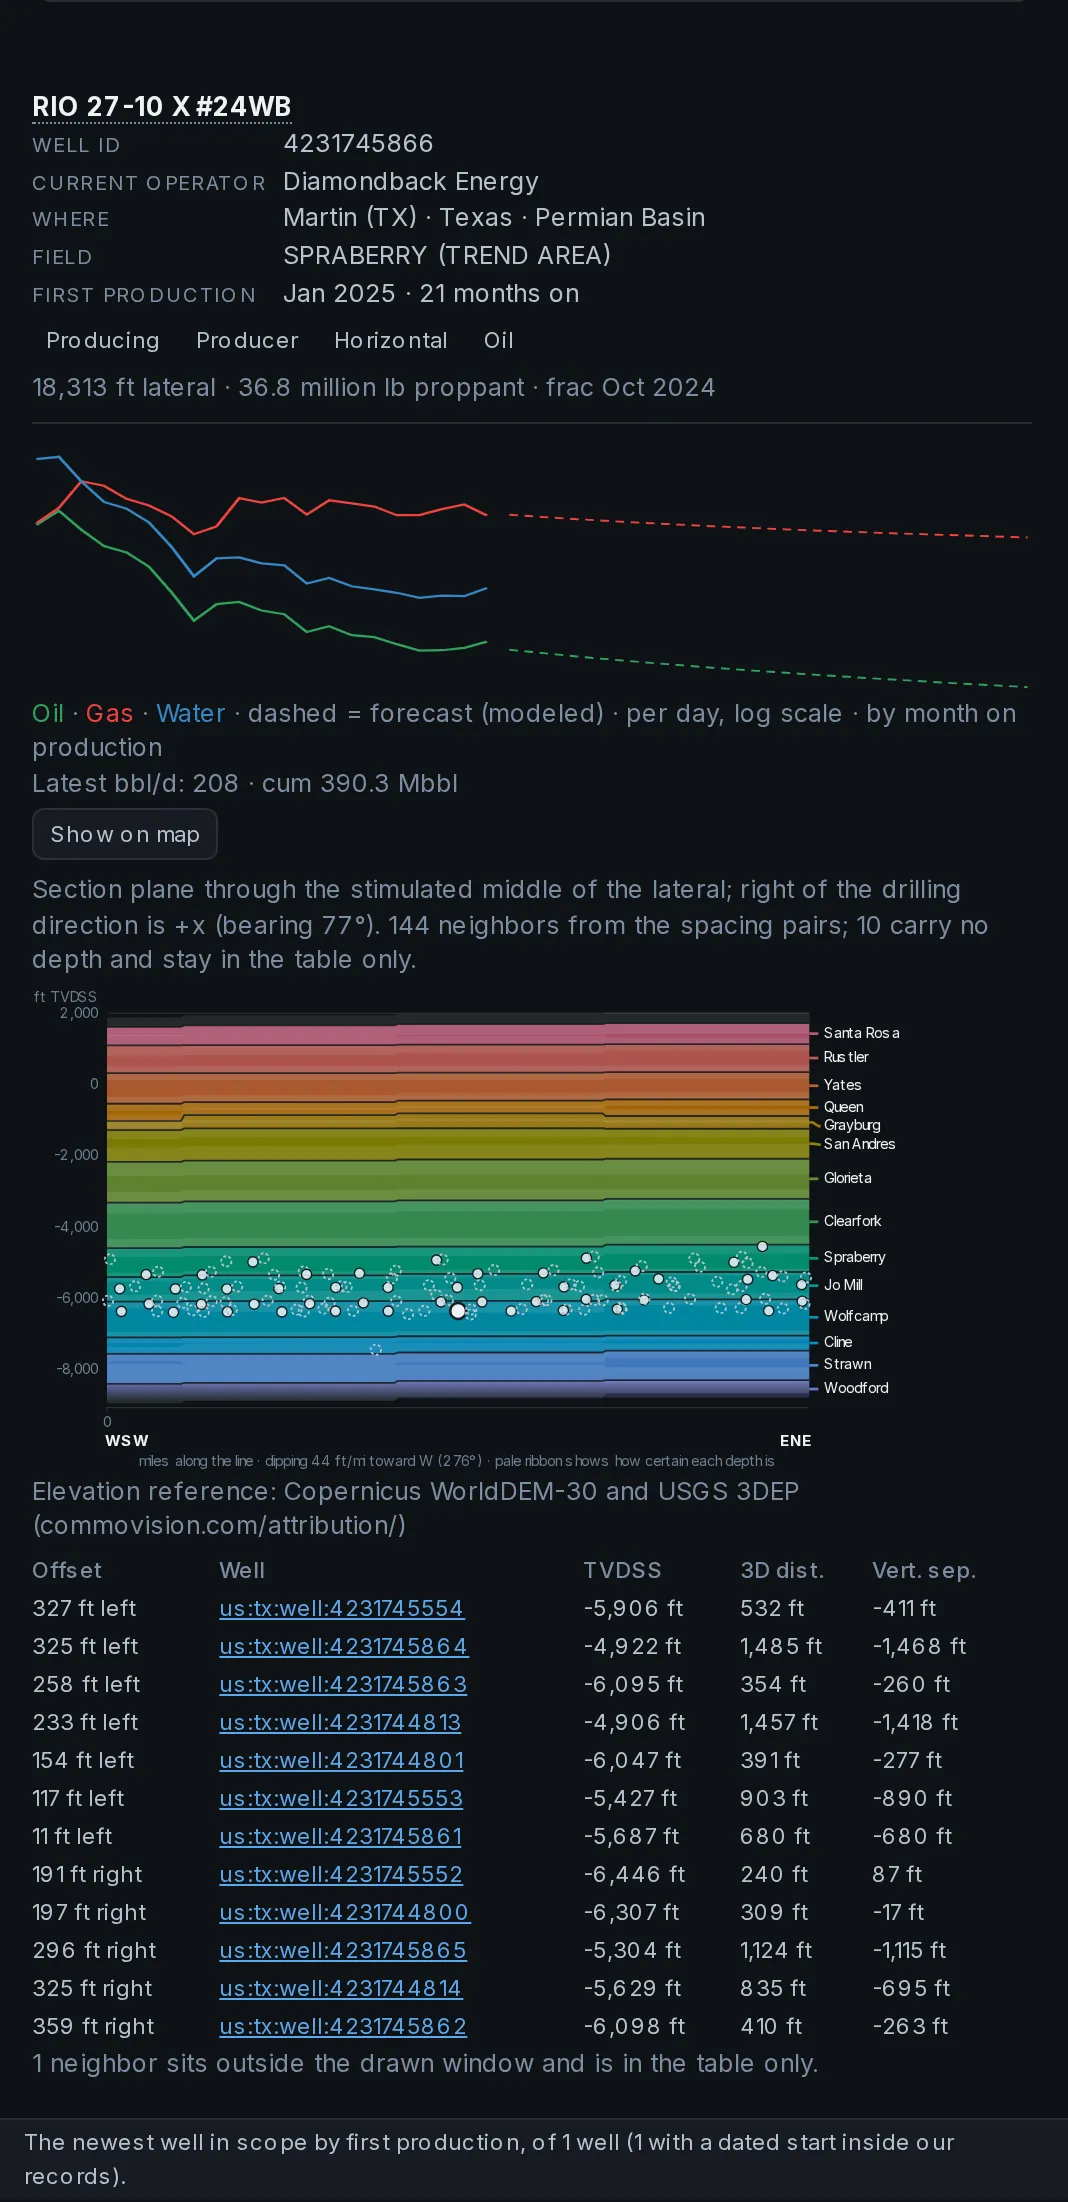
The wells you select, one card each.
Pick wells with the Well ID filter or draw a selection on the map. Each card shows the well’s key details and monthly rates, with the forecast dashed where the well has one, and can show a gun-barrel view of the well among its offset wells.
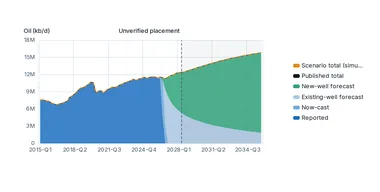
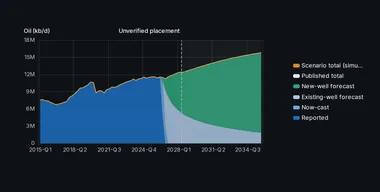
Rig-count and productivity scenarios on our type curves.
The Portal also reports freshness by region and data set: how quickly new data goes live, timed from publication at the official source to live in the product. Part of every paid plan.
Start a free trial: two weeks of the whole Portal.
The public site stays free: production for 1.1+ million producing wells, charts at every level from country to company, the live arrivals feed, the coverage matrix and the methodology. No account, no paywall on the aggregate picture.
Four plans: Free, Portal, Pro and Enterprise, with prices published on the pricing page. Every paid plan starts with a 14-day free trial.
Product updates by email. Nothing else, and you can stop them with one reply.