
Production across the Americas, well by well
Oil & gas production across the Americas: 10.26 Bbbl of oil and 62.23 Tcf of natural gas in 2025, from 18 countries. Tracked well by well where wells report, and at facility grain where the source publishes the facility as the unit. Reported data through March 2026; newer months arriving. 1,139,891 producing wells tracked, trailing 12 months per region.
No matches. Try a shorter part of the name.
Filings for the months past the chart are still arriving: Jul 2026 61%, Aug 2026 1%.
Interactive chart. Focus it and use the left and right arrow keys to read each month, Page Up and Page Down to move a year, Home and End for the ends of the series. The full figures are also in the table below.
best estimate incl. unsplit totals, allocated, source-estimated and source-withheld
All from what the source published. 78.2% held at well grain. In the United States it is 99.0%.
How the volume breaks down
- 66.3% Reported by the official source by well
- 21.8% Reported by the official source as a lease, facility, field or state total. Published without per-well detail.
- 11.5% Reported by the official source as a lease total, split across the lease's wells. The regional total shown is the reported number, to rounding.
- 0.29% Reported by the official source for a longer period, spread across its months. The period total is the reported number.
- under 0.01% A series adjusted so a total meets a published figure: a well's own cumulative from the official source, or a state's yearly total from a second official source.
- 0.17% Published by the official source as its own estimate rather than an operator-attested figure
- under 0.01% Filed with the official source, which withheld this period's production figure for one stream. That stream carries a placeholder zero.
Every barrel in the reported months starts from what the official source published for those months. Measured over January 2010 to March 2026.
Filings for the months past the chart are still arriving: Jul 2026 61%, Aug 2026 1%.
Interactive chart. Focus it and use the left and right arrow keys to read each month, Page Up and Page Down to move a year, Home and End for the ends of the series. The full figures are also in the table below.
best estimate incl. unsplit totals, allocated, source-estimated and source-withheld
All from what the source published. 97.9% held at well grain. In the United States it is 99.6%.
How the volume breaks down
- 84.5% Reported by the official source by well
- 2.1% Reported by the official source as a lease, facility, field or state total. Published without per-well detail.
- 8.8% Reported by the official source as a lease total, split across the lease's wells. The regional total shown is the reported number, to rounding.
- 4.6% Reported by the official source for a longer period, spread across its months. The period total is the reported number.
- 0.02% A series adjusted so a total meets a published figure: a well's own cumulative from the official source, or a state's yearly total from a second official source.
- 0.01% Published by the official source as its own estimate rather than an operator-attested figure
Every cubic foot in the reported months starts from what the official source published for those months. Measured over January 2010 to March 2026.
Gas figures for 10 countries and 13 US state totals stopped arriving, the latest of them after December 2024. The charts hold every month of their gas back until the feed is repaired. Their oil keeps arriving and stays in view.
Reported through March 2026. The newest filings arrive region by region in the table below.
About this chart
In the later months the filings already in are shown as reported and only the part not yet filed is estimated at each area's typical rate. Full definitions in the methodology.
Source: CommoVision · the Americas, data through March 2026.
- Producing areas across 18 countries in the Americas together produced 10.26 Bbbl of oil and 62.23 Tcf of natural gas in 2025.
- The Permian was the largest oil-producing area in our coverage in 2025 at 2.41 Bbbl, 23% of the Americas total.
- Appalachia led natural gas in 2025 at 13.44 Tcf, 22% of the Americas total.
- 1,139,891 producing wells tracked, trailing 12 months per region.
Every producing supply area in our coverage, 2025: full table best estimate incl. unsplit totals, allocated, source-estimated and source-withheld
| Supply area | Oil (MMbbl, 2025) | Gas produced (Bcf, 2025) | Share of output |
|---|---|---|---|
| Permian | 2406.4 | 10531.4 | 21.6% |
| Western Canada | 1775.9 | 7930.9 | 16.0% |
| Brazil Offshore | 1344.1 | 1995.4 | 10.3% |
| Appalachia | 69.1 | 13438.2 | 6.7% |
| Gulf of Mexico | 711 | 758.7 | 5.3% |
| Mexico | 629.5 | 1681.6 | 5.1% |
| Eagle Ford | 422.9 | 3031.9 | 4.3% |
| Bakken | 453.3 | 1306.1 | 3.8% |
| Niobrara | 264 | 2012.7 | 2.8% |
| Alaska | 154 | 3565.8 | 2.7% |
| Haynesville | 11.2 | 5517.1 | 2.6% |
| Venezuela | 355 | — | 2.5% |
| Vaca Muerta | 216.1 | 1306.8 | 2.1% |
| Colombia | 272.5 | 459.2 | 2.1% |
| Guyana | 261.1 | 378.9 | 2.0% |
| Anadarko | 131 | 2313.2 | 2.0% |
| Ecuador | 160.9 | — | 1.1% |
| California | 105.4 | 112.4 | 0.8% |
| Mid-Continent | 42 | 921.8 | 0.7% |
| Newfoundland & Labrador Offshore | 87.4 | 219.8 | 0.7% |
| Gulf Coast Onshore | 61.9 | 482.9 | 0.7% |
| Uinta | 63.3 | 308.2 | 0.6% |
| Golfo San Jorge | 66.8 | 125 | 0.5% |
| San Juan | 11.9 | 748.2 | 0.4% |
| Green River | 5.9 | 819.6 | 0.4% |
| Barnett | 7.5 | 792.3 | 0.4% |
| Brazil Onshore | 31 | 313.7 | 0.4% |
| Ark-La-Tex | 16.2 | 295.8 | 0.2% |
| US: without per-well detail | 25.9 | 104.1 | 0.2% |
| Other Rockies | 15.6 | 255.3 | 0.2% |
| Austral | 3.9 | 349.2 | 0.2% |
| Trinidad and Tobago | 18.7 | — | 0.1% |
| Peru | 16.1 | — | 0.1% |
| Rest of US | 5.3 | 80.8 | 0.1% |
| Cuba | 9.3 | — | 0.1% |
| Bolivia | 6.4 | — | 0.0% |
| Cuyana | 5.3 | 1.4 | 0.0% |
| Pacific OCS | 4.6 | 4.3 | 0.0% |
| Suriname | 4.4 | — | 0.0% |
| Noroeste | 1.1 | 39.6 | 0.0% |
| Black Warrior | 0.1 | 28.3 | 0.0% |
| Guatemala | 2 | — | 0.0% |
| Chile | 0.7 | — | 0.0% |
| Barbados | 0.4 | — | 0.0% |
| Belize | 0.3 | — | 0.0% |
| Rest of Canada | 0 | 1.7 | 0.0% |
Share of output counts oil and gas together, gas at its market-value weight.
— means no figure is published for that period.
Source: CommoVision (commovision.com)
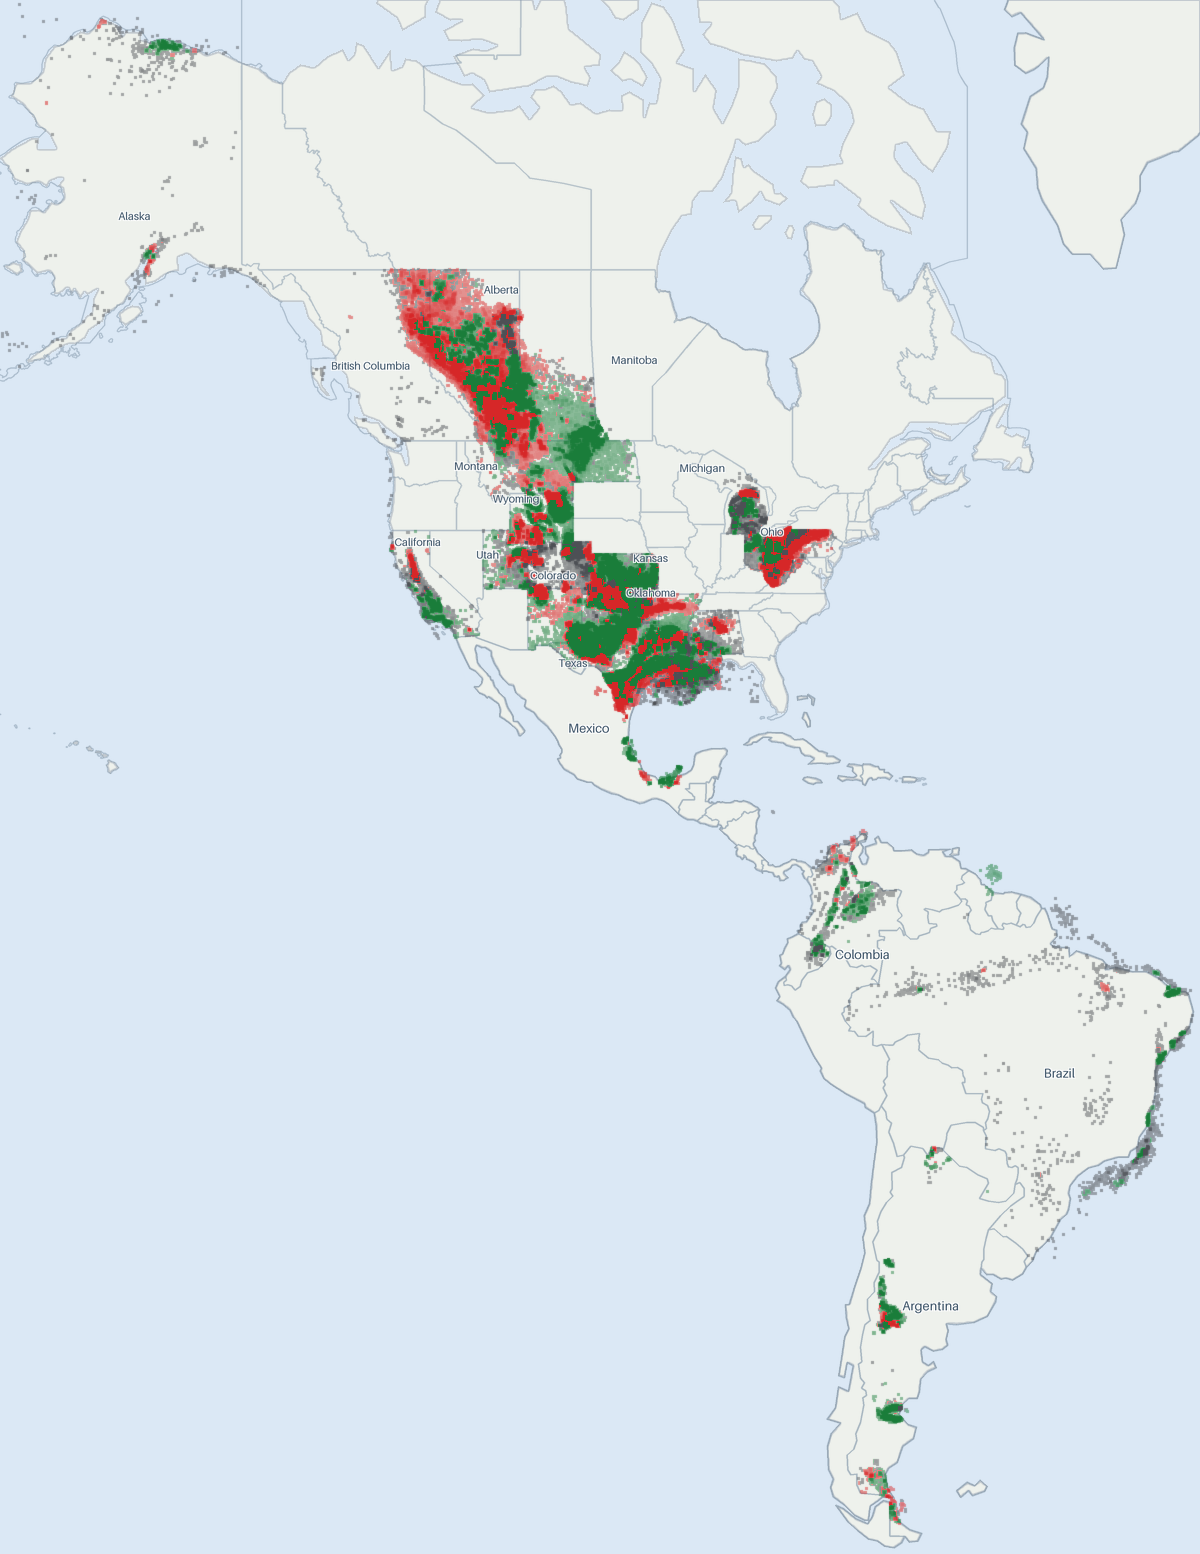
Well map
- Oil 2,287,817
- Natural gas 1,395,439
- Undetermined 815,524
Permits and rigs by region
Permits to drill a new well show what operators plan. Active rigs show what is being drilled now. Each row links to the page that carries the full series.
- These are counts of permits to drill a new well. Reworks, deepenings and plugging permits are counted on each area's own page.
- Of the 18 supply areas shown, the Permian footprint had the most permits to drill a new well: 2,319 in the 90 days to September 14, 2026. At its 12-month pace that window would hold 1,970.
- Each area's window ends at its own latest approval on record, between August 14, 2026 and September 14, 2026 across the rows. The dates are in the table. An area's 12-month pace includes the 90 days it is compared with, so the mark moves with the bar.
- Rest of Canada is not shown: it has no page of its own, and its 198 permits to drill a new well are counted on the Canada page.
- Rest of US is not shown: it has no page of its own, and its 15 permits to drill a new well are counted on the United States page.
New-well permits by supply area: full table
| Supply area | 90 days to | New-well permits | At the area's 12-month pace | New-well permits in the 365 days to the same date | All permit types, the same 90 days |
|---|---|---|---|---|---|
| Permian | September 14, 2026 | 2,319 | 1,970 | 7,990 | 2,444 |
| Western Canada | September 1, 2026 | 1,240 | 1,364 | 5,532 | 1,240 |
| Eagle Ford | September 11, 2026 | 383 | 337 | 1,365 | 390 |
| Appalachia | September 9, 2026 | 296 | 277 | 1,124 | 482 |
| Niobrara | September 10, 2026 | 292 | 318 | 1,289 | 292 |
| Bakken | September 11, 2026 | 281 | 256 | 1,037 | 308 |
| Mid-Continent | September 10, 2026 | 249 | 236 | 959 | 255 |
| Uinta | September 14, 2026 | 224 | 207 | 838 | 224 |
| Anadarko | September 14, 2026 | 172 | 152 | 618 | 176 |
| Haynesville | September 11, 2026 | 168 | 178 | 720 | 184 |
| California | September 14, 2026 | 83 | 107 | 435 | 1,013 |
| Gulf Coast Onshore | September 9, 2026 | 75 | 61 | 247 | 96 |
| Barnett | September 11, 2026 | 59 | 57 | 232 | 79 |
| San Juan | September 1, 2026 | 56 | 48 | 195 | 56 |
| Ark-La-Tex | September 11, 2026 | 49 | 38 | 153 | 78 |
| Alaska | September 9, 2026 | 40 | 38 | 153 | 40 |
| Green River | August 27, 2026 | 36 | 33 | 133 | 36 |
| Other Rockies | August 14, 2026 | 9 | 6 | 25 | 9 |
Source: CommoVision (commovision.com)
- Texas 284 +41
- Alberta 151 +21
- New Mexico 92 −2
- Oklahoma 51 +9
- Saskatchewan 34 −3
- Louisiana 30 +2
- North Dakota 28 +1
- Pennsylvania 15 −3
- Wyoming 15 +2
- British Columbia 14 +1
- Colorado 13 +1
- Utah 13 +3
- Alaska 12 +3
- Ohio 9 −3
- West Virginia 9 +2
- Gulf of Mexico 6 −4
- California 5 ±0
- Manitoba 5 +1
- Montana 4 +2
- Michigan 1 ±0
- Pacific OCS 1 −1
- Alabama 0 ±0
- Arkansas 0 −1
- Kansas 0 ±0
- Mississippi 0 −1
- In the week to September 11, 2026, Texas had the most active drilling rigs of the 25 reporting regions shown: 284, compared with 243 a year earlier.
- The largest rise from a year earlier was Texas (243 to 284). The largest fall was Gulf of Mexico (10 to 6).
- Counts cover land and inland-water rigs for 22 of the regions shown. For Gulf of Mexico and Pacific OCS they cover offshore rigs in federal waters. For Alaska they cover every rig reported. That includes rigs in Alaska's own waters.
- Alabama, Arkansas, Kansas and Mississippi show no active rig that week. A zero is a real count: the source lists only active rigs.
Active drilling rigs by reporting region: full table
| Reporting region | Rigs, week to September 11, 2026 | A year earlier | Change |
|---|---|---|---|
| Texas | 284 | 243 | +41 |
| Alberta | 151 | 130 | +21 |
| New Mexico | 92 | 94 | −2 |
| Oklahoma | 51 | 42 | +9 |
| Saskatchewan | 34 | 37 | −3 |
| Louisiana | 30 | 28 | +2 |
| North Dakota | 28 | 27 | +1 |
| Pennsylvania | 15 | 18 | −3 |
| Wyoming | 15 | 13 | +2 |
| British Columbia | 14 | 13 | +1 |
| Colorado | 13 | 12 | +1 |
| Utah | 13 | 10 | +3 |
| Alaska | 12 | 9 | +3 |
| Ohio | 9 | 12 | −3 |
| West Virginia | 9 | 7 | +2 |
| Gulf of Mexico | 6 | 10 | −4 |
| California | 5 | 5 | ±0 |
| Manitoba | 5 | 4 | +1 |
| Montana | 4 | 2 | +2 |
| Michigan | 1 | 1 | ±0 |
| Pacific OCS | 1 | 2 | −1 |
| Alabama | 0 | 0 | ±0 |
| Arkansas | 0 | 1 | −1 |
| Kansas | 0 | 0 | ±0 |
| Mississippi | 0 | 1 | −1 |
Source: CommoVision (commovision.com)
What each region has actually reported
Every region we publish, largest first. What it has reported and how far it is complete. Rates are for each region's newest complete month, so they are comparable across regions even though the months differ.
| Region | Oil (Mbbl/d) | Gas produced (MMcf/d) | Complete through | Newest month reported |
|---|---|---|---|---|
| Texas | 5,497.1 | 38,477.4 | 2026-06 | 2026-07 |
| Brazil | 4,472.5 | 7,671.9 | 2026-06 | 2026-07 |
| Alberta | 2,735.2 | 13,616.6 | 2026-07 | 2026-07 |
| New Mexico | 2,289.9 | 12,022.7 | 2026-06 | 2026-08 |
| Mexico | 1,764.9 | 4,986.1 | 2026-07 | 2026-07 |
| Gulf of Mexico | 1,914.0 | 1,981.9 | 2026-06 | 2026-06 |
| Alberta oil sands projects | 1,673.5 | — | 2026-05 | 2026-05 |
| Pennsylvania | 14.4 | 21,952.9 | 2025-12 | 2026-07 |
| Argentina | 915.6 | 5,581.7 | 2026-07 | 2026-08 |
| North Dakota | 1,008.1 | 3,422.6 | 2026-07 | 2026-08 |
| Venezuela | 1,160.0 | — | 2026-05 | 2026-05 |
| Alaska | 421.4 | 9,013.2 | 2026-07 | 2026-07 |
| Guyana | 885.6 | 1,376.3 | 2026-07 | 2026-07 |
| Oklahoma | 341.3 | 7,074.6 | 2026-06 | 2026-08 |
| Colombia | 727.9 | 1,096.0 | 2026-07 | 2026-07 |
| Colorado | 449.2 | 5,036.6 | 2026-06 | 2026-07 |
| West Virginia | 43.9 | 9,703.1 | 2025-12 | 2026-03 |
| Louisiana | 67.6 | 9,140.6 | 2026-05 | 2026-07 |
| British Columbia | 48.3 | 8,010.5 | 2026-07 | 2026-07 |
| Wyoming | 286.4 | 3,505.4 | 2026-06 | 2026-08 |
| Ohio | 119.7 | 5,758.7 | 2025-12 | 2026-06 |
| Ecuador | 459.9 | — | 2026-06 | 2026-08 |
| Saskatchewan | 423.9 | 323.4 | 2026-07 | 2026-07 |
| Newfoundland & Labrador Offshore | 260.5 | 707.1 | 2026-07 | 2026-07 |
| California | 240.8 | 280.9 | 2026-04 | 2026-08 |
| Utah | 198.9 | 896.1 | 2026-06 | 2026-07 |
| Kansas | 65.0 | 282.6 | 2026-05 | 2026-05 |
| Montana | 68.9 | 139.2 | 2026-05 | 2026-07 |
| Oklahoma: production filed by lease, held as a group | 45.5 | 369.9 | 2026-06 | 2026-08 |
| Arkansas | 5.9 | 883.5 | 2026-04 | 2026-06 |
| Trinidad and Tobago | 50.8 | — | 2026-05 | 2026-05 |
| Pacific OCS | 40.7 | 25.1 | 2026-06 | 2026-06 |
| Peru | 36.5 | — | 2026-05 | 2026-05 |
| Manitoba | 33.5 | 9.4 | 2026-07 | 2026-07 |
| Other US states (13 state totals) | 33.5 | — | 2026-04 | 2026-06 |
| Mississippi | 23.7 | 58.0 | 2026-06 | 2026-08 |
| Cuba | 23.0 | — | 2026-05 | 2026-05 |
| Alabama | 8.5 | 202.2 | 2026-06 | 2026-06 |
| Bolivia | 18.5 | — | 2026-05 | 2026-05 |
| Michigan | 7.0 | 146.7 | 2026-06 | 2026-08 |
| Suriname | 11.9 | — | 2026-05 | 2026-05 |
| Guatemala | 5.1 | — | 2026-05 | 2026-05 |
| Chile | 1.9 | — | 2026-05 | 2026-05 |
| Barbados | 1.0 | — | 2026-05 | 2026-05 |
| Belize | 0.8 | — | 2026-05 | 2026-05 |
No matches. Try a shorter part of the name.
By continent 2
| Name | Where | Oil | Gas | Latest data |
|---|---|---|---|---|
| North America | The Americas | 20.58 MMbbl/d | 156.89 Bcf/d | August 2026 |
| South America | The Americas | 7.52 MMbbl/d | 13.61 Bcf/d | May 2026 |
Oil and gas are last complete calendar year’s average daily rate.
Bcf/d = billion cubic feet per day · MMbbl/d = million barrels per day (units).
By country 18
| Name | Where | Oil | Gas | Latest data |
|---|---|---|---|---|
| United States | The Americas | 13.67 MMbbl/d | 129.94 Bcf/d | August 2026 |
| Canada | The Americas | 5.1 MMbbl/d | 22.34 Bcf/d | July 2026 |
| Brazil | The Americas | 3.77 MMbbl/d | 6.33 Bcf/d | July 2026 |
| Mexico | The Americas | 1.72 MMbbl/d | 4.61 Bcf/d | July 2026 |
| Argentina | The Americas | 803.4 Mbbl/d | 4.99 Bcf/d | August 2026 |
| Venezuela | The Americas | 0.97 MMbbl/d | — | May 2026 |
| Colombia | The Americas | 746.6 Mbbl/d | 1.26 Bcf/d | July 2026 |
| Guyana | The Americas | 715.4 Mbbl/d | 1.04 Bcf/d | July 2026 |
| Ecuador | The Americas | 440.8 Mbbl/d | — | June 2026 |
| Trinidad and Tobago | The Americas | 51.2 Mbbl/d | — | May 2026 |
| Peru | The Americas | 44.2 Mbbl/d | — | May 2026 |
| Cuba | The Americas | 25.5 Mbbl/d | — | May 2026 |
| Bolivia | The Americas | 17.7 Mbbl/d | — | May 2026 |
| Suriname | The Americas | 12.1 Mbbl/d | — | May 2026 |
| Guatemala | The Americas | 5.4 Mbbl/d | — | May 2026 |
| Chile | The Americas | 2 Mbbl/d | — | May 2026 |
| Barbados | The Americas | 1 Mbbl/d | — | May 2026 |
| Belize | The Americas | 787.1 bbl/d | — | May 2026 |
Oil and gas are last complete calendar year’s average daily rate.
Bcf/d = billion cubic feet per day · MMbbl/d = million barrels per day · Mbbl/d = thousand barrels per day · bbl/d = barrels per day (units).
By state & province 25
| Name | Where | Oil | Gas | Latest data |
|---|---|---|---|---|
| Texas | United States | 5.77 MMbbl/d | 37.39 Bcf/d | July 2026 |
| Alberta | Canada | 4.34 MMbbl/d | 13.28 Bcf/d | July 2026 |
| New Mexico | United States | 2.21 MMbbl/d | 11.19 Bcf/d | August 2026 |
| Gulf of Mexico | United States | 1.95 MMbbl/d | 2.08 Bcf/d | June 2026 |
| Pennsylvania | United States | 11.8 Mbbl/d | 21.48 Bcf/d | July 2026 |
| North Dakota | United States | 1.17 MMbbl/d | 3.46 Bcf/d | August 2026 |
| Alaska | United States | 422 Mbbl/d | 9.77 Bcf/d | July 2026 |
| Oklahoma | United States | 407 Mbbl/d | 7.29 Bcf/d | August 2026 |
| Colorado | United States | 475.7 Mbbl/d | 5.19 Bcf/d | July 2026 |
| Louisiana | United States | 71.6 Mbbl/d | 10.14 Bcf/d | July 2026 |
| West Virginia | United States | 40.5 Mbbl/d | 9.56 Bcf/d | March 2026 |
| British Columbia | Canada | 50.4 Mbbl/d | 8.11 Bcf/d | June 2026 |
| Wyoming | United States | 288.2 Mbbl/d | 3.6 Bcf/d | August 2026 |
| Ohio | United States | 137 Mbbl/d | 5.76 Bcf/d | June 2026 |
| Saskatchewan | Canada | 433.9 Mbbl/d | 336.8 MMcf/d | July 2026 |
| California | United States | 288.6 Mbbl/d | 307.8 MMcf/d | August 2026 |
| Utah | United States | 186 Mbbl/d | 896.4 MMcf/d | July 2026 |
| Kansas | United States | 69.2 Mbbl/d | 329 MMcf/d | May 2026 |
| Montana | United States | 77.6 Mbbl/d | 140.2 MMcf/d | July 2026 |
| Arkansas | United States | 6.7 Mbbl/d | 918.9 MMcf/d | June 2026 |
| Manitoba | Canada | 40.6 Mbbl/d | 10.4 MMcf/d | July 2026 |
| Mississippi | United States | 27.5 Mbbl/d | 67 MMcf/d | August 2026 |
| Alabama | United States | 8.6 Mbbl/d | 209.4 MMcf/d | June 2026 |
| Michigan | United States | 11 Mbbl/d | 166.4 MMcf/d | August 2026 |
| Pacific OCS | United States | 12.6 Mbbl/d | 11.9 MMcf/d | June 2026 |
Oil and gas are last complete calendar year’s average daily rate.
Bcf/d = billion cubic feet per day · MMbbl/d = million barrels per day · MMcf/d = million cubic feet per day · Mbbl/d = thousand barrels per day (units).
By county 115
| Name | Where | Oil | Gas | Latest data |
|---|---|---|---|---|
| Lea | New Mexico | 1.19 MMbbl/d | 4.32 Bcf/d | August 2026 |
| Eddy (NM) | New Mexico | 0.98 MMbbl/d | 5.19 Bcf/d | August 2026 |
| North Slope | Alaska | 414.3 Mbbl/d | 9.57 Bcf/d | July 2026 |
| Martin (TX) | Texas | 723.4 Mbbl/d | 2.08 Bcf/d | July 2026 |
| Midland (TX) | Texas | 677.9 Mbbl/d | 2.72 Bcf/d | July 2026 |
| Reeves | Texas | 497 Mbbl/d | 3.35 Bcf/d | July 2026 |
| Loving | Texas | 488 Mbbl/d | 1.92 Bcf/d | July 2026 |
| Weld | Colorado | 389.4 Mbbl/d | 2.98 Bcf/d | July 2026 |
| McKenzie | North Dakota | 365.7 Mbbl/d | 1.57 Bcf/d | August 2026 |
| Upton | Texas | 296.9 Mbbl/d | 1.26 Bcf/d | July 2026 |
| Howard (TX) | Texas | 271 Mbbl/d | 1.17 Bcf/d | July 2026 |
| Karnes | Texas | 273.2 Mbbl/d | 843.3 MMcf/d | July 2026 |
| Williams (ND) | North Dakota | 243.8 Mbbl/d | 749.5 MMcf/d | August 2026 |
| Dunn (ND) | North Dakota | 252.4 Mbbl/d | 509.8 MMcf/d | August 2026 |
| Reagan | Texas | 191.7 Mbbl/d | 1.39 Bcf/d | July 2026 |
| Webb | Texas | 57.1 Mbbl/d | 3.34 Bcf/d | July 2026 |
| Mountrail | North Dakota | 221.7 Mbbl/d | 521.2 MMcf/d | August 2026 |
| Susquehanna | Pennsylvania | — | 3.76 Bcf/d | July 2026 |
| De Soto | Louisiana | 144.3 bbl/d | 3.72 Bcf/d | July 2026 |
| Culberson | Texas | 139.3 Mbbl/d | 1.54 Bcf/d | July 2026 |
| Kern | California | 211.1 Mbbl/d | 249.5 MMcf/d | August 2026 |
| Andrews | Texas | 192.4 Mbbl/d | 413.7 MMcf/d | July 2026 |
| Washington (PA) | Pennsylvania | 7.3 Mbbl/d | 3.17 Bcf/d | July 2026 |
| Ward (TX) | Texas | 176.3 Mbbl/d | 593.2 MMcf/d | July 2026 |
| Bradford (PA) | Pennsylvania | — | 3.21 Bcf/d | July 2026 |
| Glasscock | Texas | 156.7 Mbbl/d | 860 MMcf/d | July 2026 |
| Greene (PA) | Pennsylvania | 58.9 bbl/d | 3.14 Bcf/d | July 2026 |
| La Salle | Texas | 143 Mbbl/d | 965.7 MMcf/d | July 2026 |
| DeWitt | Texas | 138.8 Mbbl/d | 737.2 MMcf/d | July 2026 |
| Caddo (LA) | Louisiana | 3 Mbbl/d | 2.13 Bcf/d | July 2026 |
| Duchesne | Utah | 128.8 Mbbl/d | 230.3 MMcf/d | July 2026 |
| Converse | Wyoming | 123.9 Mbbl/d | 295.1 MMcf/d | August 2026 |
| Dimmit | Texas | 101.9 Mbbl/d | 599.4 MMcf/d | July 2026 |
| Wetzel | West Virginia | 4.6 Mbbl/d | 2.01 Bcf/d | March 2026 |
| Canadian | Oklahoma | 46.9 Mbbl/d | 1.21 Bcf/d | August 2026 |
| Grady (OK) | Oklahoma | 54 Mbbl/d | 1.1 Bcf/d | July 2026 |
| Panola (TX) | Texas | 2.8 Mbbl/d | 1.74 Bcf/d | July 2026 |
| Sublette | Wyoming | 7.4 Mbbl/d | 1.66 Bcf/d | July 2026 |
| McMullen | Texas | 80.7 Mbbl/d | 550.2 MMcf/d | July 2026 |
| Lycoming | Pennsylvania | — | 1.63 Bcf/d | July 2026 |
| Tyler (WV) | West Virginia | 4.3 Mbbl/d | 1.53 Bcf/d | March 2026 |
| Harrison (OH) | Ohio | 35.9 Mbbl/d | 1.03 Bcf/d | June 2026 |
| Marshall (WV) | West Virginia | 13.2 Mbbl/d | 1.3 Bcf/d | March 2026 |
| Harrison (TX) | Texas | 3.3 Mbbl/d | 1.42 Bcf/d | July 2026 |
| Red River (LA) | Louisiana | 41.3 bbl/d | 1.42 Bcf/d | June 2026 |
| Belmont | Ohio | 2.7 Mbbl/d | 1.37 Bcf/d | May 2026 |
| Campbell (WY) | Wyoming | 66.1 Mbbl/d | 372.3 MMcf/d | July 2026 |
| Tioga (PA) | Pennsylvania | — | 1.35 Bcf/d | July 2026 |
| Winkler | Texas | 73.3 Mbbl/d | 214.5 MMcf/d | July 2026 |
| Pecos | Texas | 64.1 Mbbl/d | 276.2 MMcf/d | July 2026 |
| Atascosa | Texas | 77.1 Mbbl/d | 75.4 MMcf/d | July 2026 |
| Live Oak | Texas | 58.1 Mbbl/d | 357.7 MMcf/d | July 2026 |
| Jefferson (OH) | Ohio | 194.1 bbl/d | 1.22 Bcf/d | June 2026 |
| Gonzales | Texas | 74.5 Mbbl/d | 97.9 MMcf/d | July 2026 |
| Yoakum | Texas | 69.9 Mbbl/d | 162.8 MMcf/d | July 2026 |
| Uintah | Utah | 44.6 Mbbl/d | 539.6 MMcf/d | July 2026 |
| Westmoreland (PA) | Pennsylvania | 18.6 bbl/d | 1.12 Bcf/d | July 2026 |
| San Juan (NM) | New Mexico | 21.3 Mbbl/d | 776.1 MMcf/d | July 2026 |
| Blaine (OK) | Oklahoma | 20.9 Mbbl/d | 667.4 MMcf/d | July 2026 |
| Kingfisher | Oklahoma | 37.1 Mbbl/d | 415.8 MMcf/d | August 2026 |
| Guernsey | Ohio | 44.5 Mbbl/d | 295.7 MMcf/d | June 2026 |
| Dawson (TX) | Texas | 60.9 Mbbl/d | 40.4 MMcf/d | July 2026 |
| Ector | Texas | 55.2 Mbbl/d | 123.3 MMcf/d | July 2026 |
| Monroe (OH) | Ohio | 1 Mbbl/d | 932.2 MMcf/d | June 2026 |
| Doddridge | West Virginia | 1.8 Mbbl/d | 895.2 MMcf/d | March 2026 |
| Carroll (OH) | Ohio | 34 Mbbl/d | 386.1 MMcf/d | June 2026 |
| Garfield (CO) | Colorado | 2.3 Mbbl/d | 839.4 MMcf/d | July 2026 |
| Crane | Texas | 45.8 Mbbl/d | 172.9 MMcf/d | July 2026 |
| Monongalia | West Virginia | 6.4 bbl/d | 821.5 MMcf/d | March 2026 |
| Irion | Texas | 26.8 Mbbl/d | 396.5 MMcf/d | July 2026 |
| Bossier | Louisiana | 1.5 Mbbl/d | 772.9 MMcf/d | July 2026 |
| Gaines | Texas | 47.6 Mbbl/d | 58.7 MMcf/d | July 2026 |
| Tarrant | Texas | 6.2 bbl/d | 760.7 MMcf/d | July 2026 |
| Richland (MT) | Montana | 45.8 Mbbl/d | 64.3 MMcf/d | June 2026 |
| Rio Arriba | New Mexico | 4.9 Mbbl/d | 666.8 MMcf/d | July 2026 |
| San Augustine | Texas | 36 bbl/d | 0.73 Bcf/d | July 2026 |
| Butler (PA) | Pennsylvania | 0.7 Mbbl/d | 705.3 MMcf/d | July 2026 |
| Sweetwater | Wyoming | 8.7 Mbbl/d | 580.4 MMcf/d | July 2026 |
| Adams (CO) | Colorado | 36.1 Mbbl/d | 146.8 MMcf/d | July 2026 |
| Stephens (OK) | Oklahoma | 22.5 Mbbl/d | 326.9 MMcf/d | July 2026 |
| Sullivan (PA) | Pennsylvania | — | 645.6 MMcf/d | July 2026 |
| Garvin | Oklahoma | 20.5 Mbbl/d | 332.7 MMcf/d | July 2026 |
| Ritchie | West Virginia | 2.7 Mbbl/d | 592.4 MMcf/d | March 2026 |
| Bienville | Louisiana | 78.7 bbl/d | 627.3 MMcf/d | May 2026 |
| Wyoming (PA) | Pennsylvania | — | 587.2 MMcf/d | July 2026 |
| Carter (OK) | Oklahoma | 23.5 Mbbl/d | 231.5 MMcf/d | July 2026 |
| Washington (TX) | Texas | 20.4 Mbbl/d | 254.3 MMcf/d | July 2026 |
| Sabine (LA) | Louisiana | 61.7 bbl/d | 540.4 MMcf/d | July 2026 |
| Harrison (WV) | West Virginia | 94.6 bbl/d | 534.6 MMcf/d | March 2026 |
| La Plata | Colorado | 23.8 bbl/d | 522.9 MMcf/d | June 2026 |
| Marion (WV) | West Virginia | 7.3 bbl/d | 514.9 MMcf/d | December 2025 |
| Nacogdoches | Texas | 75.9 bbl/d | 509.2 MMcf/d | July 2026 |
| Armstrong (PA) | Pennsylvania | 34.1 bbl/d | 507.3 MMcf/d | July 2026 |
| Los Angeles | California | 31.8 Mbbl/d | 15.9 MMcf/d | July 2026 |
| Roger Mills | Oklahoma | 17.3 Mbbl/d | 212.5 MMcf/d | July 2026 |
| Lewis (WV) | West Virginia | 149.1 bbl/d | 461.2 MMcf/d | March 2026 |
| Custer (OK) | Oklahoma | 9.9 Mbbl/d | 303 MMcf/d | July 2026 |
| Wise (TX) | Texas | 1.4 Mbbl/d | 408.7 MMcf/d | July 2026 |
| Allegheny | Pennsylvania | 64.1 bbl/d | 425.7 MMcf/d | June 2026 |
| Pittsburg | Oklahoma | 22.1 bbl/d | 400.8 MMcf/d | July 2026 |
| Denton | Texas | 510.6 bbl/d | 358.2 MMcf/d | July 2026 |
| Natchitoches | Louisiana | 15 bbl/d | 341.7 MMcf/d | July 2026 |
| Kenai Peninsula | Alaska | 7.7 Mbbl/d | 193.4 MMcf/d | July 2026 |
| Plaquemines | Louisiana | 16.1 Mbbl/d | 19.8 MMcf/d | July 2026 |
| Van Buren (AR) | Arkansas | — | 198.8 MMcf/d | June 2026 |
| Conway | Arkansas | — | 164.4 MMcf/d | June 2026 |
| Fallon | Montana | 5.9 Mbbl/d | 10.9 MMcf/d | June 2026 |
| Jasper (MS) | Mississippi | 5 Mbbl/d | 4.5 MMcf/d | July 2026 |
| Mobile | Alabama | 1.4 Mbbl/d | 46 MMcf/d | June 2026 |
| Stevens (KS) | Kansas | 590.9 bbl/d | 49.7 MMcf/d | May 2026 |
| Otsego (MI) | Michigan | 1.2 Mbbl/d | 35.6 MMcf/d | July 2026 |
| Grant (KS) | Kansas | 314.8 bbl/d | 44.1 MMcf/d | May 2026 |
| Montmorency | Michigan | 14.1 bbl/d | 44.6 MMcf/d | July 2026 |
| Escambia (AL) | Alabama | 819.7 bbl/d | 7.1 MMcf/d | June 2026 |
| Jefferson Davis (MS) | Mississippi | 155.2 bbl/d | 13.7 MMcf/d | July 2026 |
Oil and gas are last complete calendar year’s average daily rate.
Bcf/d = billion cubic feet per day · MMbbl/d = million barrels per day · MMcf/d = million cubic feet per day · Mbbl/d = thousand barrels per day · bbl/d = barrels per day (units).
By supply area 30
Supply areas are the producing regions wells roll up to: Permian, Appalachia, Vaca Muerta. Every well belongs to exactly one.
| Name | Where | Oil | Gas | Latest data |
|---|---|---|---|---|
| Permian | 2 reporting regions | 6.59 MMbbl/d | 28.85 Bcf/d | August 2026 |
| Western Canada | 4 reporting regions | 4.87 MMbbl/d | 21.73 Bcf/d | July 2026 |
| Brazil Offshore | 1 reporting region | 3.68 MMbbl/d | 5.47 Bcf/d | July 2026 |
| Appalachia | 4 reporting regions | 189.2 Mbbl/d | 36.82 Bcf/d | December 2025 |
| Gulf of Mexico | 1 reporting region | 1.95 MMbbl/d | 2.08 Bcf/d | June 2026 |
| Eagle Ford | 1 reporting region | 1.16 MMbbl/d | 8.31 Bcf/d | July 2026 |
| Bakken | 2 reporting regions | 1.24 MMbbl/d | 3.58 Bcf/d | August 2026 |
| Mexico Offshore | 1 reporting region | 1.12 MMbbl/d | 2.22 Bcf/d | July 2026 |
| Niobrara | 4 reporting regions | 723.2 Mbbl/d | 5.51 Bcf/d | August 2026 |
| Alaska | 1 reporting region | 422 Mbbl/d | 9.77 Bcf/d | July 2026 |
| Haynesville | 3 reporting regions | 30.7 Mbbl/d | 15.12 Bcf/d | July 2026 |
| Vaca Muerta | 1 reporting region | 592.1 Mbbl/d | 3.58 Bcf/d | July 2026 |
| Anadarko | 2 reporting regions | 359 Mbbl/d | 6.34 Bcf/d | June 2026 |
| Mexico Onshore | 1 reporting region | 600.1 Mbbl/d | 2.39 Bcf/d | July 2026 |
| California | 1 reporting region | 288.6 Mbbl/d | 307.8 MMcf/d | August 2026 |
| Mid-Continent | 6 reporting regions | 115.1 Mbbl/d | 2.53 Bcf/d | April 2026 |
| Gulf Coast Onshore | 4 reporting regions | 169.7 Mbbl/d | 1.32 Bcf/d | June 2026 |
| Uinta | 1 reporting region | 173.5 Mbbl/d | 844.5 MMcf/d | July 2026 |
| Golfo San Jorge | 1 reporting region | 183 Mbbl/d | 342.5 MMcf/d | July 2026 |
| San Juan | 2 reporting regions | 32.5 Mbbl/d | 2.05 Bcf/d | July 2026 |
| Green River | 1 reporting region | 16.1 Mbbl/d | 2.25 Bcf/d | July 2026 |
| Barnett | 1 reporting region | 20.6 Mbbl/d | 2.17 Bcf/d | July 2026 |
| Brazil Onshore | 1 reporting region | 85 Mbbl/d | 859.5 MMcf/d | June 2026 |
| Ark-La-Tex | 4 reporting regions | 44.3 Mbbl/d | 810.3 MMcf/d | July 2026 |
| Other Rockies | 5 reporting regions | 42.6 Mbbl/d | 699.3 MMcf/d | July 2026 |
| Austral | 1 reporting region | 10.8 Mbbl/d | 956.7 MMcf/d | July 2026 |
| Cuyana | 1 reporting region | 14.5 Mbbl/d | 3.7 MMcf/d | July 2026 |
| Pacific OCS | 1 reporting region | 12.6 Mbbl/d | 11.9 MMcf/d | June 2026 |
| Noroeste | 1 reporting region | 3 Mbbl/d | 108.6 MMcf/d | July 2026 |
| Black Warrior | 2 reporting regions | 293.2 bbl/d | 77.6 MMcf/d | June 2026 |
Oil and gas are last complete calendar year’s average daily rate. Supply-area pages carry two well lenses, rock-evidenced and total footprint, explained on each page and in the methodology.
Bcf/d = billion cubic feet per day · MMbbl/d = million barrels per day · MMcf/d = million cubic feet per day · Mbbl/d = thousand barrels per day · bbl/d = barrels per day (units).
By company 111
| Name | Where | Oil | Gas | Latest data |
|---|---|---|---|---|
| Petrobras | 3 regions | 3.4 MMbbl/d | 5.79 Bcf/d | June 2026 |
| Petróleos Mexicanos | 1 region | 1.6 MMbbl/d | 4.46 Bcf/d | July 2026 |
| ExxonMobil | 24 regions | 1.57 MMbbl/d | 3.24 Bcf/d | April 2026 |
| Canadian Natural Resources | 4 regions | 1.11 MMbbl/d | 3.04 Bcf/d | July 2026 |
| EOG Resources | 20 regions | 734.9 Mbbl/d | 4.77 Bcf/d | February 2026 |
| Chevron | 23 regions | 833.3 Mbbl/d | 2.85 Bcf/d | April 2026 |
| Hilcorp Energy | 11 regions | 246.5 Mbbl/d | 9.84 Bcf/d | May 2026 |
| Diamondback Energy | 5 regions | 599.4 Mbbl/d | 2.23 Bcf/d | April 2026 |
| Expand Energy | 8 regions | 22.1 Mbbl/d | 10.81 Bcf/d | December 2025 |
| Cenovus Energy | 4 regions | 649.3 Mbbl/d | 923 MMcf/d | June 2026 |
| BP | 15 regions | 517.8 Mbbl/d | 2.33 Bcf/d | April 2026 |
| Shell | 24 regions | 590.3 Mbbl/d | 1.15 Bcf/d | May 2026 |
| XTO Energy | 16 regions | 472.6 Mbbl/d | 2.7 Bcf/d | April 2026 |
| Devon Energy | 19 regions | 460 Mbbl/d | 2.38 Bcf/d | April 2026 |
| Suncor Energy | 6 regions | 562.1 Mbbl/d | 170.2 MMcf/d | June 2026 |
| Occidental Petroleum | 13 regions | 418.1 Mbbl/d | 1.68 Bcf/d | April 2026 |
| Ecopetrol S.A. | 1 region | 466.9 Mbbl/d | 892.4 MMcf/d | July 2026 |
| Anadarko Petroleum | 16 regions | 448.8 Mbbl/d | 1.15 Bcf/d | April 2026 |
| EQT Corporation | 4 regions | 7.1 Mbbl/d | 7.39 Bcf/d | December 2025 |
| ConocoPhillips | 14 regions | 393.3 Mbbl/d | 1.35 Bcf/d | April 2026 |
| Continental Resources | 11 regions | 340.7 Mbbl/d | 2.11 Bcf/d | April 2026 |
| Imperial Oil | 5 regions | 454.2 Mbbl/d | 37.7 MMcf/d | April 2026 |
| YPF S.A. | 2 regions | 368.7 Mbbl/d | 1.13 Bcf/d | June 2026 |
| Mewbourne Oil Company | 4 regions | 328 Mbbl/d | 1.49 Bcf/d | April 2026 |
| Ovintiv | 10 regions | 205.6 Mbbl/d | 3.16 Bcf/d | May 2026 |
| Syncrude Canada Ltd. | 1 region | 382.9 Mbbl/d | — | May 2026 |
| Permian Resources | 2 regions | 265 Mbbl/d | 1.27 Bcf/d | June 2026 |
| EP Petroecuador | 1 region | 349.1 Mbbl/d | — | August 2026 |
| Concho Resources | 2 regions | 276.6 Mbbl/d | 1.09 Bcf/d | June 2026 |
| Coterra Energy | 4 regions | 127.9 Mbbl/d | 3.24 Bcf/d | April 2026 |
| Burlington Resources | 14 regions | 271.9 Mbbl/d | 1.02 Bcf/d | April 2026 |
| Antero Resources | 6 regions | 12.2 Mbbl/d | 4.14 Bcf/d | December 2025 |
| Civitas Resources | 3 regions | 201.6 Mbbl/d | 1.05 Bcf/d | June 2026 |
| Chord Energy Corporation | 9 regions | 221.2 Mbbl/d | 612.2 MMcf/d | June 2026 |
| APA Corporation | 16 regions | 180.9 Mbbl/d | 986.2 MMcf/d | April 2026 |
| Tourmaline Oil Corp | 2 regions | 17.9 Mbbl/d | 3.31 Bcf/d | June 2026 |
| Whitecap Resources | 3 regions | 150.1 Mbbl/d | 0.89 Bcf/d | June 2026 |
| Matador Resources Company | 4 regions | 159 Mbbl/d | 686.2 MMcf/d | May 2026 |
| WPX Energy | 6 regions | 122.9 Mbbl/d | 1.21 Bcf/d | June 2026 |
| SM Energy | 13 regions | 153.5 Mbbl/d | 645.1 MMcf/d | April 2026 |
| Aethon Energy | 4 regions | 296.5 bbl/d | 2.75 Bcf/d | May 2026 |
| Ascent Resources | 1 region | 28 Mbbl/d | 2.33 Bcf/d | February 2026 |
| Fort Hills Energy Corporation | 1 region | 183.1 Mbbl/d | — | May 2026 |
| Murphy Oil Corporation | 12 regions | 136.8 Mbbl/d | 672.7 MMcf/d | April 2026 |
| Arc Resources | 3 regions | 72.6 Mbbl/d | 1.48 Bcf/d | June 2026 |
| Hilcorp Alaska | 1 region | 85.2 Mbbl/d | 1.2 Bcf/d | June 2026 |
| Pan American Energy | 3 regions | 126.2 Mbbl/d | 571.2 MMcf/d | May 2026 |
| Noble Energy | 14 regions | 111.4 Mbbl/d | 788.3 MMcf/d | April 2026 |
| ConocoPhillips Canada Resources | 2 regions | 149.1 Mbbl/d | 176.8 MMcf/d | June 2026 |
| Range Resources Corporation | 7 regions | 7 Mbbl/d | 2.21 Bcf/d | January 2026 |
| Kerr-McGee Corporation | 16 regions | 92.7 Mbbl/d | 867.2 MMcf/d | April 2026 |
| Cimarex Energy | 14 regions | 91.7 Mbbl/d | 800.6 MMcf/d | May 2026 |
| Vital Energy | 1 region | 103.4 Mbbl/d | 561.5 MMcf/d | December 2025 |
| Crescent Energy Company | 9 regions | 67.6 Mbbl/d | 0.92 Bcf/d | April 2026 |
| Strathcona Resources | 3 regions | 113.8 Mbbl/d | 217.2 MMcf/d | June 2026 |
| Comstock Resources | 5 regions | 102.7 bbl/d | 1.83 Bcf/d | April 2026 |
| California Resources Corporation | 2 regions | 100.4 Mbbl/d | 247.2 MMcf/d | April 2026 |
| Hess Corporation | 11 regions | 166 Mbbl/d | 510.7 MMcf/d | July 2025 |
| Talos Energy | 4 regions | 100.3 Mbbl/d | 236.7 MMcf/d | June 2026 |
| Javelin Energy Partners | 2 regions | 83.5 Mbbl/d | 441.6 MMcf/d | June 2026 |
| CNX Resources Corporation | 4 regions | 221.2 bbl/d | 1.69 Bcf/d | December 2025 |
| Baytex Energy | 7 regions | 96.5 Mbbl/d | 184.9 MMcf/d | June 2026 |
| Seneca Resources | 8 regions | 5.6 bbl/d | 1.41 Bcf/d | April 2026 |
| Gulfport Energy Corporation | 4 regions | 7.9 Mbbl/d | 1.24 Bcf/d | February 2026 |
| MEG Energy | 1 region | 95.5 Mbbl/d | 46 MMcf/d | November 2025 |
| TotalEnergies Austral S.A. | 1 region | 10 Mbbl/d | 1.19 Bcf/d | July 2026 |
| Prio S.A. | 1 region | 85.6 Mbbl/d | 39 MMcf/d | June 2026 |
| TGNR East Texas | 1 region | 426.4 bbl/d | 1.28 Bcf/d | June 2026 |
| Repsol S.A. | 3 regions | 15 Mbbl/d | 1.01 Bcf/d | April 2026 |
| LLOG Exploration Offshore | 4 regions | 76.5 Mbbl/d | 84.7 MMcf/d | June 2026 |
| Diversified Energy Company | 13 regions | 10.6 Mbbl/d | 1.05 Bcf/d | December 2025 |
| Petronas | 2 regions | 8 Mbbl/d | 1.07 Bcf/d | June 2026 |
| Tecpetrol S.A. | 4 regions | 31.7 Mbbl/d | 668.7 MMcf/d | May 2026 |
| CNOOC Limited | 2 regions | 75.4 Mbbl/d | 4.5 MMcf/d | June 2026 |
| Eni S.p.A. | 5 regions | 71.3 Mbbl/d | 53.7 MMcf/d | May 2026 |
| Vista Energy | 4 regions | 69.2 Mbbl/d | 44.7 MMcf/d | June 2026 |
| Magnolia Oil & Gas | 1 region | 49.1 Mbbl/d | 345 MMcf/d | June 2026 |
| Kraken Operating, LLC | 2 regions | 64 Mbbl/d | 118.6 MMcf/d | May 2026 |
| Pluspetrol S.A. | 1 region | 44 Mbbl/d | 382.8 MMcf/d | July 2026 |
| Mach Natural Resources LP | 6 regions | 29.3 Mbbl/d | 561.5 MMcf/d | April 2026 |
| Surge Operating | 1 region | 53 Mbbl/d | 189.7 MMcf/d | June 2026 |
| Lewis Petro Properties | 1 region | 5 Mbbl/d | 862.9 MMcf/d | June 2026 |
| Scout Energy Management | 8 regions | 40.5 Mbbl/d | 323 MMcf/d | April 2026 |
| Tamarack Valley Energy | 2 regions | 54.7 Mbbl/d | 85.5 MMcf/d | June 2026 |
| The Anschutz Corporation | 8 regions | 49.1 Mbbl/d | 168.8 MMcf/d | June 2026 |
| BTA Oil Producers | 12 regions | 44.9 Mbbl/d | 198.8 MMcf/d | May 2026 |
| Validus Energy | 2 regions | 20 Mbbl/d | 530.4 MMcf/d | June 2026 |
| Trinity Operating (USG) | 3 regions | 12.4 Mbbl/d | 619.3 MMcf/d | May 2026 |
| Merit Energy Company | 14 regions | 21.1 Mbbl/d | 465.6 MMcf/d | April 2026 |
| Peyto Exploration & Development | 2 regions | 143.9 bbl/d | 771.7 MMcf/d | June 2026 |
| Sabine Oil & Gas | 8 regions | 1.5 Mbbl/d | 729.1 MMcf/d | April 2026 |
| Birch Operations | 1 region | 32 Mbbl/d | 233.9 MMcf/d | June 2026 |
| PureWest Energy | 1 region | 4.3 Mbbl/d | 609.5 MMcf/d | June 2026 |
| EXCO Resources | 11 regions | 12 Mbbl/d | 493 MMcf/d | April 2026 |
| Verdun Oil & Gas | 1 region | 29.1 Mbbl/d | 220.7 MMcf/d | June 2026 |
| Penn Energy Resources | 2 regions | 0.6 Mbbl/d | 634.5 MMcf/d | January 2026 |
| Silver Hill Energy Operating, LLC | 3 regions | 14.3 Mbbl/d | 400 MMcf/d | May 2026 |
| Northeast Natural Energy LLC | 2 regions | — | 610 MMcf/d | December 2025 |
| Jonah Energy | 3 regions | 12.5 Mbbl/d | 411.1 MMcf/d | June 2026 |
| BKV Barnett | 1 region | 515.7 bbl/d | 572.5 MMcf/d | June 2026 |
| Pampa Energía S.A. | 1 region | 9.6 Mbbl/d | 434.5 MMcf/d | July 2026 |
| Camino Natural Resources | 1 region | 15.1 Mbbl/d | 335.2 MMcf/d | June 2026 |
| Flywheel Energy | 1 region | — | 556.5 MMcf/d | April 2026 |
| Vermilion Energy | 5 regions | 9.8 Mbbl/d | 391.1 MMcf/d | June 2026 |
| Advantage Energy | 3 regions | 7.3 Mbbl/d | 423.3 MMcf/d | June 2026 |
| Crestone Peak Resources | 1 region | 26.5 Mbbl/d | 206.2 MMcf/d | October 2021 |
| GEP Haynesville II | 1 region | — | 477.4 MMcf/d | May 2026 |
| Birchcliff Energy | 1 region | 2.2 Mbbl/d | 421.2 MMcf/d | June 2026 |
| TEP Barnett USA | 1 region | 12.6 bbl/d | 447.7 MMcf/d | June 2026 |
| Pacific Canbriam Energy | 1 region | 23.1 bbl/d | 441.4 MMcf/d | July 2026 |
| QB Energy Operating | 1 region | 1.1 Mbbl/d | 404.8 MMcf/d | June 2026 |
Oil and gas are last complete calendar year’s average daily rate.
Bcf/d = billion cubic feet per day · MMbbl/d = million barrels per day · MMcf/d = million cubic feet per day · Mbbl/d = thousand barrels per day · bbl/d = barrels per day (units).
Get early access
Watch supply move as soon as its sources publish, with forecasts on 1.1+ million producing wells. The portal, an API and MCP access for AI tools open on October 1, 2026.
Data use is subject to our Terms of Service.