CommoVision

See the future in real time

Alberta

Alberta produced 1.58 Bbbl of oil and 4.85 Tcf of natural gas in 2025. 142,031 producing wells tracked, 12 months to Jul 2026.

  • Largest oil-producing province among the Canadian provinces we publish, 2025.
  • 85.0% of the oil produced in Canada, 2025.
  • Oil production rose 4% in 2025 from 2024.
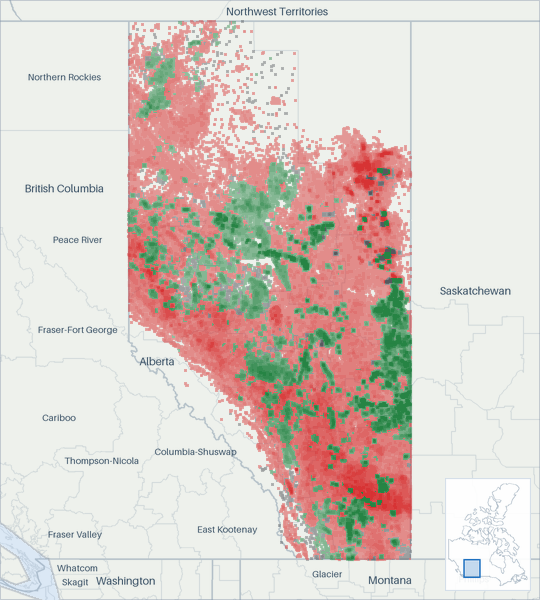
Well map of Alberta. The full map is further down this page.

Production

Alberta oil production (MMbbl/d, grouped by when each well first produced)
  • filling in (est. · missed) . Hatching marks our estimate of the volume still to be filed. That estimate draws on our own production forecast. A check on the forecast behind this estimate measured a miss. It updates as filings arrive
Alberta oil production: million barrels per day, by first-production vintage filed in full 246 MMbbl/d 2017201820192020202120222023202420252026 Oct 2016: 3.28 MMbbl/d total Nov 2016: 3.48 MMbbl/d total Dec 2016: 3.33 MMbbl/d total Jan 2017: 3.45 MMbbl/d total Feb 2017: 3.49 MMbbl/d total Mar 2017: 3.24 MMbbl/d total Apr 2017: 2.89 MMbbl/d total May 2017: 3.02 MMbbl/d total Jun 2017: 3.13 MMbbl/d total Jul 2017: 3.36 MMbbl/d total Aug 2017: 3.58 MMbbl/d total Sep 2017: 3.36 MMbbl/d total Oct 2017: 3.24 MMbbl/d total Nov 2017: 3.6 MMbbl/d total Dec 2017: 3.65 MMbbl/d total Jan 2018: 3.46 MMbbl/d total Feb 2018: 3.6 MMbbl/d total Mar 2018: 3.62 MMbbl/d total Apr 2018: 3.28 MMbbl/d total May 2018: 3.51 MMbbl/d total Jun 2018: 3.51 MMbbl/d total Jul 2018: 3.62 MMbbl/d total Aug 2018: 3.89 MMbbl/d total Sep 2018: 3.56 MMbbl/d total Oct 2018: 3.82 MMbbl/d total Nov 2018: 3.89 MMbbl/d total Dec 2018: 3.83 MMbbl/d total Jan 2019: 3.59 MMbbl/d total Feb 2019: 3.61 MMbbl/d total Mar 2019: 3.63 MMbbl/d total Apr 2019: 3.71 MMbbl/d total May 2019: 3.55 MMbbl/d total Jun 2019: 3.71 MMbbl/d total Jul 2019: 3.76 MMbbl/d total Aug 2019: 3.79 MMbbl/d total Sep 2019: 3.65 MMbbl/d total Oct 2019: 3.58 MMbbl/d total Nov 2019: 3.71 MMbbl/d total Dec 2019: 3.9 MMbbl/d total Jan 2020: 3.76 MMbbl/d total Feb 2020: 3.82 MMbbl/d total Mar 2020: 3.73 MMbbl/d total Apr 2020: 3.25 MMbbl/d total May 2020: 3.03 MMbbl/d total Jun 2020: 3.24 MMbbl/d total Jul 2020: 3.26 MMbbl/d total Aug 2020: 3.18 MMbbl/d total Sep 2020: 3.29 MMbbl/d total Oct 2020: 3.48 MMbbl/d total Nov 2020: 3.83 MMbbl/d total Dec 2020: 3.99 MMbbl/d total Jan 2021: 3.92 MMbbl/d total Feb 2021: 3.75 MMbbl/d total Mar 2021: 3.79 MMbbl/d total Apr 2021: 3.42 MMbbl/d total May 2021: 3.51 MMbbl/d total Jun 2021: 3.77 MMbbl/d total Jul 2021: 3.83 MMbbl/d total Aug 2021: 3.74 MMbbl/d total Sep 2021: 3.7 MMbbl/d total Oct 2021: 4.06 MMbbl/d total Nov 2021: 4.02 MMbbl/d total Dec 2021: 3.81 MMbbl/d total Jan 2022: 3.73 MMbbl/d total Feb 2022: 3.92 MMbbl/d total Mar 2022: 3.9 MMbbl/d total Apr 2022: 3.8 MMbbl/d total May 2022: 3.61 MMbbl/d total Jun 2022: 3.72 MMbbl/d total Jul 2022: 3.93 MMbbl/d total Aug 2022: 3.96 MMbbl/d total Sep 2022: 3.97 MMbbl/d total Oct 2022: 3.99 MMbbl/d total Nov 2022: 4.12 MMbbl/d total Dec 2022: 3.96 MMbbl/d total Jan 2023: 3.89 MMbbl/d total Feb 2023: 4.02 MMbbl/d total Mar 2023: 4.04 MMbbl/d total Apr 2023: 3.72 MMbbl/d total May 2023: 3.59 MMbbl/d total Jun 2023: 3.8 MMbbl/d total Jul 2023: 4.1 MMbbl/d total Aug 2023: 4.09 MMbbl/d total Sep 2023: 4.01 MMbbl/d total Oct 2023: 3.95 MMbbl/d total Nov 2023: 4.37 MMbbl/d total Dec 2023: 4.39 MMbbl/d total Jan 2024: 4.02 MMbbl/d total Feb 2024: 4.15 MMbbl/d total Mar 2024: 4.24 MMbbl/d total Apr 2024: 4.11 MMbbl/d total May 2024: 3.83 MMbbl/d total Jun 2024: 4.08 MMbbl/d total Jul 2024: 4.2 MMbbl/d total Aug 2024: 4.25 MMbbl/d total Sep 2024: 4.04 MMbbl/d total Oct 2024: 4.31 MMbbl/d total Nov 2024: 4.41 MMbbl/d total Dec 2024: 4.47 MMbbl/d total Jan 2025: 4.39 MMbbl/d total Feb 2025: 4.21 MMbbl/d total Mar 2025: 4.39 MMbbl/d total Apr 2025: 4.2 MMbbl/d total May 2025: 3.78 MMbbl/d total Jun 2025: 4.23 MMbbl/d total Jul 2025: 4.5 MMbbl/d total Aug 2025: 4.44 MMbbl/d total Sep 2025: 4.42 MMbbl/d total Oct 2025: 4.34 MMbbl/d total Nov 2025: 4.59 MMbbl/d total Dec 2025: 4.6 MMbbl/d total Jan 2026: 4.43 MMbbl/d total Feb 2026: 4.35 MMbbl/d total Mar 2026: 4.38 MMbbl/d total Apr 2026: 4.36 MMbbl/d total May 2026: 4.18 MMbbl/d total Jun 2026: ≈4.42 MMbbl/d total (73% arrived, remainder estimated) Jul 2026: ≈4.68 MMbbl/d total (73% arrived, remainder estimated) Aug 2026: ≈4.63 MMbbl/d total (<1% arrived, remainder estimated) Sep 2026: ≈4.49 MMbbl/d total (<1% arrived, remainder estimated)

All from what the source published. 76.9% held at well grain.

How the volume breaks down
  • 76.9% Reported by the official source by well
  • 23.1% Reported by the official source as a lease, facility, field or state total. Published without per-well detail.

Every barrel through May 2026 starts from what the official source published for those months. Measured over January 1962 to May 2026.

The gray “without per-well detail” band is volume the source reports above the well: fields, facilities, or leases the source publishes as one total. It is included so the stack still sums to the whole entity.

Alberta natural gas production (Bcf/d, grouped by when each well first produced)
  • filling in (est. · missed) . Hatching marks our estimate of the volume still to be filed. That estimate draws on our own production forecast. A check on the forecast behind this estimate measured a miss. It updates as filings arrive
Alberta natural gas production: billion cubic feet per day, by first-production vintage filed in full 51015 Bcf/d 2017201820192020202120222023202420252026 Oct 2016: 11.8 Bcf/d total Nov 2016: 12.1 Bcf/d total Dec 2016: 12.2 Bcf/d total Jan 2017: 12.4 Bcf/d total Feb 2017: 12.4 Bcf/d total Mar 2017: 12.6 Bcf/d total Apr 2017: 12.5 Bcf/d total May 2017: 12.1 Bcf/d total Jun 2017: 12.3 Bcf/d total Jul 2017: 12.5 Bcf/d total Aug 2017: 12.1 Bcf/d total Sep 2017: 12.4 Bcf/d total Oct 2017: 12.4 Bcf/d total Nov 2017: 13 Bcf/d total Dec 2017: 13.1 Bcf/d total Jan 2018: 13 Bcf/d total Feb 2018: 12.9 Bcf/d total Mar 2018: 12.9 Bcf/d total Apr 2018: 12.7 Bcf/d total May 2018: 12.1 Bcf/d total Jun 2018: 12.1 Bcf/d total Jul 2018: 12.3 Bcf/d total Aug 2018: 12.5 Bcf/d total Sep 2018: 12.3 Bcf/d total Oct 2018: 12.5 Bcf/d total Nov 2018: 12.7 Bcf/d total Dec 2018: 12.9 Bcf/d total Jan 2019: 12.7 Bcf/d total Feb 2019: 12.2 Bcf/d total Mar 2019: 12.6 Bcf/d total Apr 2019: 12.5 Bcf/d total May 2019: 12.1 Bcf/d total Jun 2019: 11.8 Bcf/d total Jul 2019: 11.9 Bcf/d total Aug 2019: 11.9 Bcf/d total Sep 2019: 11.7 Bcf/d total Oct 2019: 12.1 Bcf/d total Nov 2019: 12.4 Bcf/d total Dec 2019: 12.5 Bcf/d total Jan 2020: 12 Bcf/d total Feb 2020: 12.3 Bcf/d total Mar 2020: 12.1 Bcf/d total Apr 2020: 11.7 Bcf/d total May 2020: 11.4 Bcf/d total Jun 2020: 11.4 Bcf/d total Jul 2020: 11.3 Bcf/d total Aug 2020: 11.3 Bcf/d total Sep 2020: 11.2 Bcf/d total Oct 2020: 11.7 Bcf/d total Nov 2020: 11.9 Bcf/d total Dec 2020: 12 Bcf/d total Jan 2021: 12 Bcf/d total Feb 2021: 11.7 Bcf/d total Mar 2021: 12.2 Bcf/d total Apr 2021: 12.2 Bcf/d total May 2021: 11.9 Bcf/d total Jun 2021: 11.8 Bcf/d total Jul 2021: 12.1 Bcf/d total Aug 2021: 12.2 Bcf/d total Sep 2021: 11.9 Bcf/d total Oct 2021: 12.3 Bcf/d total Nov 2021: 12.5 Bcf/d total Dec 2021: 12.3 Bcf/d total Jan 2022: 12.4 Bcf/d total Feb 2022: 12.6 Bcf/d total Mar 2022: 12.8 Bcf/d total Apr 2022: 13 Bcf/d total May 2022: 12.6 Bcf/d total Jun 2022: 12.4 Bcf/d total Jul 2022: 12.9 Bcf/d total Aug 2022: 12.8 Bcf/d total Sep 2022: 12.9 Bcf/d total Oct 2022: 13 Bcf/d total Nov 2022: 13.1 Bcf/d total Dec 2022: 12.8 Bcf/d total Jan 2023: 13.2 Bcf/d total Feb 2023: 13.3 Bcf/d total Mar 2023: 13.2 Bcf/d total Apr 2023: 13.2 Bcf/d total May 2023: 11.5 Bcf/d total Jun 2023: 12.2 Bcf/d total Jul 2023: 13.1 Bcf/d total Aug 2023: 13.1 Bcf/d total Sep 2023: 12.7 Bcf/d total Oct 2023: 12.9 Bcf/d total Nov 2023: 13.4 Bcf/d total Dec 2023: 13.5 Bcf/d total Jan 2024: 12.8 Bcf/d total Feb 2024: 13.2 Bcf/d total Mar 2024: 13.1 Bcf/d total Apr 2024: 13.1 Bcf/d total May 2024: 12.7 Bcf/d total Jun 2024: 12.8 Bcf/d total Jul 2024: 12.7 Bcf/d total Aug 2024: 12.8 Bcf/d total Sep 2024: 12.1 Bcf/d total Oct 2024: 13 Bcf/d total Nov 2024: 13.3 Bcf/d total Dec 2024: 13.5 Bcf/d total Jan 2025: 13.5 Bcf/d total Feb 2025: 13.2 Bcf/d total Mar 2025: 13.6 Bcf/d total Apr 2025: 13.4 Bcf/d total May 2025: 13.1 Bcf/d total Jun 2025: 12.7 Bcf/d total Jul 2025: 13 Bcf/d total Aug 2025: 13 Bcf/d total Sep 2025: 13 Bcf/d total Oct 2025: 13.3 Bcf/d total Nov 2025: 13.8 Bcf/d total Dec 2025: 13.7 Bcf/d total Jan 2026: 14 Bcf/d total Feb 2026: 14 Bcf/d total Mar 2026: 13.8 Bcf/d total Apr 2026: 13.8 Bcf/d total May 2026: 13.1 Bcf/d total Jun 2026: ≈13.2 Bcf/d total (73% arrived, remainder estimated) Jul 2026: ≈13.7 Bcf/d total (73% arrived, remainder estimated) Aug 2026: ≈13.3 Bcf/d total (<1% arrived, remainder estimated) Sep 2026: ≈13.1 Bcf/d total (<1% arrived, remainder estimated)

All from what the source published. All held at well grain.

How the volume breaks down
  • 100% Reported by the official source by well

Every cubic foot through May 2026 starts from what the official source published for those months. Measured over January 1962 to May 2026.

The bands group wells by when they first produced.

About this chart

The stack shows what is holding today's rate up and how much of it is new drilling. In the reported months the bands draw the filings already in. The months still filling in are marked.

Annual table (full history)

best estimate incl. unsplit totals

YearOil (MMbbl)Gas produced (Bcf)
20251,584.34,847
20241,527.54,733
20231,459.24,723
20221,417.04,664
20211,378.74,414
20201,276.44,279
20191,343.94,452
20181,326.24,591
20171,217.04,555
20161,111.04,449
20151,131.24,476
20141,066.74,368
2013982.54,249
2012918.14,341
2011823.14,530
2010763.74,721
2009710.44,991
2008671.05,391
2007678.65,666
2006383.45,796
2005372.75,765
2004363.95,771
2003360.05,712
2002355.95,886
2001378.66,008
2000382.36,048
1999378.86,073
1998419.05,994
1997424.15,861
1996407.85,791
1995405.65,603
1994399.25,434
1993393.75,109
1992382.24,698
1991373.24,304
1990383.54,160
1989393.34,135
1988410.04,082
1987389.43,611
1986368.23,394
1985378.63,509
1984389.03,287
1983357.03,086
1982349.53,196
1981363.53,137
1980401.03,153
1979434.43,304
1978380.23,140
1977383.53,176
1976385.93,037
1975425.83,003
1974498.02,983
1973522.92,970
1972425.32,762
1971357.62,372
1970330.32,188
1969287.41,891
1968260.91,644
1967242.71,462
1966212.21,340
1965188.71,274
1964176.11,164
1963171.5995
1962171.2826

Source: CommoVision (commovision.com)

Monthly table (last 24 months)
MonthOil (Mbbl)Gas produced (MMcf)
2026-05129,625.8405,257
2026-04130,808.9413,852
2026-03135,715.2429,318
2026-02121,712.0390,951
2026-01137,234.6433,282
2025-12142,635.6425,121
2025-11137,642.9413,531
2025-10134,583.9413,252
2025-09132,583.9389,908
2025-08137,461.4402,521
2025-07139,466.1404,093
2025-06126,911.2380,883
2025-05117,114.1406,811
2025-04125,900.1402,701
2025-03136,104.0421,667
2025-02117,740.9368,588
2025-01136,119.5417,492
2024-12138,405.3417,569
2024-11132,347.4399,555
2024-10133,643.9402,648
2024-09121,095.5363,140
2024-08131,785.0398,097
2024-07130,045.0394,902
2024-06122,365.6382,927

Source: CommoVision (commovision.com)

Source: CommoVision · Alberta, data through July 2026.

Well map

A map of 500,712 well locations in Alberta for which CommoVision holds a published surface coordinate, each drawn where it is and colored by its primary product (green for oil, red for natural gas, gray where undetermined; a spot shared by more than one product shows the one with the most wells there), on a ground of land and water over faint state, province, county and census-division outlines and place names for orientation, with a small inset map locating this frame in Canada.
  • Oil 152,877
  • Natural gas 292,412
  • Undetermined 55,423
500,712 well locations in Alberta, colored by primary product.
About this map

Undetermined means not enough signal to settle it. Producing wells are the ones that reported oil or gas in the 12 months to Jul 2026.

4.18 MMbbl/d May 2026 oil production +10.7% vs May last year best estimate incl. unsplit totals
13.07 Bcf/d May 2026 gas production -0.4% vs May last year
4.34 MMbbl/d 2025 oil production best estimate incl. unsplit totals
13.28 Bcf/d 2025 gas production
142,031 wells Producing wells tracked 12 months to Jul 2026

Type curves

Alberta oil type curves (bbl/d per well, log scale, against months on production; cohorts 2010–2026)
Alberta oil type curves: average barrels per day per well on a log scale against months on production 2010-2014: 16,530 wells; starts at 63.4 bbl/d per well, 159 Mbbl cumulative through month 140 (100% of its wells old enough at that month); the dashed curve runs through month 200, on our forecast where a well’s own record ends2015: 2,394 wells; starts at 51.9 bbl/d per well, 355 Mbbl cumulative through month 128 (100% of its wells old enough at that month); the dashed curve runs through month 188, on our forecast where a well’s own record ends2016: 1,616 wells; starts at 67.4 bbl/d per well, 330 Mbbl cumulative through month 116 (100% of its wells old enough at that month); the dashed curve runs through month 176, on our forecast where a well’s own record ends2017: 2,911 wells; starts at 68.5 bbl/d per well, 191 Mbbl cumulative through month 104 (100% of its wells old enough at that month); the dashed curve runs through month 164, on our forecast where a well’s own record ends2018: 2,704 wells; starts at 78.5 bbl/d per well, 188 Mbbl cumulative through month 92 (100% of its wells old enough at that month); the dashed curve runs through month 152, on our forecast where a well’s own record ends2019: 2,332 wells; starts at 101 bbl/d per well, 226 Mbbl cumulative through month 80 (100% of its wells old enough at that month); the dashed curve runs through month 140, on our forecast where a well’s own record ends2020: 1,361 wells; starts at 82 bbl/d per well, 238 Mbbl cumulative through month 68 (100% of its wells old enough at that month); the dashed curve runs through month 128, on our forecast where a well’s own record ends2021: 2,223 wells; starts at 86.6 bbl/d per well, 196 Mbbl cumulative through month 56 (100% of its wells old enough at that month); the dashed curve runs through month 116, on our forecast where a well’s own record ends2022: 2,878 wells; starts at 85.7 bbl/d per well, 140 Mbbl cumulative through month 44 (100% of its wells old enough at that month); the dashed curve runs through month 104, on our forecast where a well’s own record ends2023: 2,874 wells; starts at 92.3 bbl/d per well, 133 Mbbl cumulative through month 32 (100% of its wells old enough at that month); the dashed curve runs through month 92, on our forecast where a well’s own record ends2024: 2,900 wells; starts at 105 bbl/d per well, 102 Mbbl cumulative through month 20 (100% of its wells old enough at that month); the dashed curve runs through month 80, on our forecast where a well’s own record ends2025: 2,912 wells; starts at 96.7 bbl/d per well, 49.2 Mbbl cumulative through month 8 (100% of its wells old enough at that month); the dashed curve runs through month 68, on our forecast where a well’s own record ends2026: 1,592 wells; starts at 107 bbl/d per well, 3.2 Mbbl cumulative through month 1 (100% of its wells old enough at that month); the dashed curve runs through month 61, on our forecast where a well’s own record ends5102050100200300bbl/d24487296120144168192216Months on production
Alberta natural gas type curves (Mcf/d per well, log scale, against months on production; cohorts 2010–2026)
Alberta natural gas type curves: average thousand cubic feet per day per well on a log scale against months on production 2010-2014: 16,530 wells; starts at 364 Mcf/d per well, 0.7 Bcf cumulative through month 140 (100% of its wells old enough at that month); the dashed curve runs through month 200, on our forecast where a well’s own record ends2015: 2,394 wells; starts at 661 Mcf/d per well, 1.2 Bcf cumulative through month 128 (100% of its wells old enough at that month); the dashed curve runs through month 188, on our forecast where a well’s own record ends2016: 1,616 wells; starts at 860 Mcf/d per well, 1.4 Bcf cumulative through month 116 (100% of its wells old enough at that month); the dashed curve runs through month 176, on our forecast where a well’s own record ends2017: 2,911 wells; starts at 698 Mcf/d per well, 1.2 Bcf cumulative through month 104 (100% of its wells old enough at that month); the dashed curve runs through month 164, on our forecast where a well’s own record ends2018: 2,704 wells; starts at 549 Mcf/d per well, 1.1 Bcf cumulative through month 92 (100% of its wells old enough at that month); the dashed curve runs through month 152, on our forecast where a well’s own record ends2019: 2,332 wells; starts at 539 Mcf/d per well, 0.9 Bcf cumulative through month 80 (100% of its wells old enough at that month); the dashed curve runs through month 140, on our forecast where a well’s own record ends2020: 1,361 wells; starts at 755 Mcf/d per well, 1.2 Bcf cumulative through month 68 (100% of its wells old enough at that month); the dashed curve runs through month 128, on our forecast where a well’s own record ends2021: 2,223 wells; starts at 718 Mcf/d per well, 1.1 Bcf cumulative through month 56 (100% of its wells old enough at that month); the dashed curve runs through month 116, on our forecast where a well’s own record ends2022: 2,878 wells; starts at 602 Mcf/d per well, 0.8 Bcf cumulative through month 44 (100% of its wells old enough at that month); the dashed curve runs through month 104, on our forecast where a well’s own record ends2023: 2,874 wells; starts at 566 Mcf/d per well, 0.7 Bcf cumulative through month 32 (100% of its wells old enough at that month); the dashed curve runs through month 92, on our forecast where a well’s own record ends2024: 2,900 wells; starts at 612 Mcf/d per well, 0.6 Bcf cumulative through month 20 (100% of its wells old enough at that month); the dashed curve runs through month 80, on our forecast where a well’s own record ends2025: 2,912 wells; starts at 603 Mcf/d per well, 0.3 Bcf cumulative through month 8 (100% of its wells old enough at that month); the dashed curve runs through month 68, on our forecast where a well’s own record ends2026: 1,592 wells; starts at 615 Mcf/d per well, 0.0 Bcf cumulative through month 1 (100% of its wells old enough at that month); the dashed curve runs through month 61, on our forecast where a well’s own record ends30501002005001,0002,000Mcf/d24487296120144168192216Months on production

Horizontal wells only. Average production per well, for wells grouped by when they first produced.

How these curves are built

Horizontal wells only: 45,227 of the 62,494 wells in these cohorts. Average daily production per well, for wells grouped by when they first produced. Includes every well of the cohort that is old enough at each month. Wells that are shut in or have stopped producing count as zero, so the average reflects the full cohort, not just survivors. Rates are calendar-day (volume ÷ days in month). The cumulative axis accumulates those same monthly averages at the average month length. Months not yet fully reported are excluded. The 2010-2014 curve draws those years as one group. The chart opens on average daily rate against months on production, the rate on a log scale. The view control switches to rate against cumulative production per well, on the same log rate scale, or to cumulative production per well against months on production, on a linear scale. Every view draws the same cohorts from the same production history. Each cohort is solid through the last month all of its wells sit inside fully reported data. Past it the dashed curve carries the same wells forward, on our forecast where a well’s own record ends, for up to five years. A dashed curve runs as far as at least nine in ten of its wells are accounted for. A well that is old enough but shut in still counts, as zero. The measured months are what these wells reported. In the forward months each well counts its own reported figure for each month it has one, our forecast for each month it has only that, and zero for the rest. The forward average counts every well of the cohort. The drawn forecast runs up to five years past the measured months. Line thickness tracks the size of each cohort. 73 wells are counted here but not shown on the age axis: they started producing in 1964 or earlier, too close to the start of our records for their region to verify their true age.

Cohort summary table
First produced Wells Peak oil (bbl/d per well) Month-12 oil (bbl/d per well) Cum oil in series (Mbbl per well) Peak gas (Mcf/d per well) Month-12 gas (Mcf/d per well) Cum gas in series (Bcf per well) Months in series Wells old enough at last month in series Forecast months drawn
2026 1,592 107 3.2 615 0.0 1 100% 60
2025 2,912 226 49.2 1,498 0.3 8 100% 60
2024 2,900 228 156 102 1,440 834 0.6 20 100% 60
2023 2,874 205 146 133 1,414 792 0.7 32 100% 60
2022 2,878 195 125 140 1,456 805 0.8 44 100% 60
2021 2,223 203 144 196 1,756 987 1.1 56 100% 60
2020 1,361 181 159 238 1,701 978 1.2 68 100% 60
2019 2,332 184 142 226 1,201 686 0.9 80 100% 60
2018 2,704 165 103 188 1,210 788 1.1 92 100% 60
2017 2,911 137 110 191 1,438 804 1.2 104 100% 60
2016 1,616 174 161 330 1,556 894 1.4 116 100% 60
2015 2,394 139 138 355 1,269 782 1.2 128 100% 60
2010-2014 16,530 111 77.3 159 655 379 0.7 140 100% 60

Source: CommoVision (commovision.com)

Source: CommoVision · Alberta type curves, per-well production by first-production cohort.

Top operators in Alberta, 2025 best estimate incl. unsplit totals

  1. Canadian Natural Resources 23.3%
  2. Cenovus Energy 11.0%
  3. Suncor Energy 10.3%
  4. Imperial Oil 8.7%
  5. Syncrude Canada Ltd. 7.3%
  6. Fort Hills Energy Corporation 3.5%
  7. ConocoPhillips Canada Resources 2.8%
  8. Tourmaline Oil Corp 2.5%
  9. Arc Resources 2.2%
  10. Whitecap Resources 2.1%
  11. 395 other operators 26.2%
Top operators in Alberta, 2025: full table
OperatorOil (Mbbl/d, 2025)Gas produced (MMcf/d, 2025)Share of output
Canadian Natural Resources 1,085.51,949.423.3%
Cenovus Energy 523.3774.511.0%
Suncor Energy 540.08.310.3%
Imperial Oil 454.237.78.7%
Syncrude Canada Ltd. 382.90.07.3%
Fort Hills Energy Corporation 183.10.03.5%
ConocoPhillips Canada Resources 145.58.42.8%
Tourmaline Oil Corp 12.71,769.92.5%
Arc Resources 69.6674.12.2%
Whitecap Resources 55.9824.42.1%
395 other operators 887.57,231.626.2%

Mbbl/d = thousand barrels per day · MMcf/d = million cubic feet per day (units).

Source: CommoVision (commovision.com)

Recent permitting

5,505 permits approved in the 365 days to September 14, 2026
1,256 permits in the 90 days to September 14, 2026
1,256 new-well permits in the 90 days to September 14, 2026
September 14, 2026 latest approval on record
About this chart

Approvals of every permit type per month, the 24 months to Sep 2026. The last bar is Sep 2026 through September 14, 2026 (227 so far), drawn hatched. All 5,505 approved in the 365 days to September 14, 2026 are permits to drill a new well. Permits to drill a new well: 5,505 in the 365 days to September 14, 2026 and 1,256 in the last 90 days of that window. How permits are counted.

Most permits 365 days to September 14, 2026

  1. Canadian Natural Resources 875 · 15.9%
  2. Cenovus Energy 682 · 12.4%
  3. Spur Petroleum 308 · 5.6%
  4. Suncor Energy 234 · 4.3%
  5. Baytex Energy 219 · 4.0%
  • In Alberta, 5,505 well permits were approved in the 365 days to September 14, 2026. Of those, 1,256 came in the last 90 days of that window. The latest approval on record is dated September 14, 2026.
  • All 5,505 approved in the 365 days to September 14, 2026 are permits to drill a new well. Permits to drill a new well: 5,505 in the 365 days to September 14, 2026 and 1,256 in the last 90 days of that window.
Well permits approved per month: full table
MonthPermits approved
Sep 2026 (through September 14, 2026)227
Aug 2026383
Jul 2026495
Jun 2026424
May 2026463
Apr 2026329
Mar 2026412
Feb 2026266
Jan 2026327
Dec 2025645
Nov 2025814
Oct 2025415
Sep 2025470
Aug 2025305
Jul 2025365
Jun 2025330
May 2025394
Apr 2025261
Mar 2025291
Feb 2025371
Jan 2025468
Dec 2024372
Nov 2024677
Oct 2024441

Source: CommoVision (commovision.com)

Active drilling rigs

151 rigs active in the week to September 11, 2026
+21 rigs vs the same week a year earlier
364 rigs peak week, Jan 2025 (since Sep 2016)
Active drilling rigs by rig type (rigs, weekly count)Source: Baker Hughes rig count
Oil Gas Miscellaneous
Active drilling rigs by rig type: rigs, weekly count 100 200 300 400 rigs 2017201820192020202120222023202420252026 Week to Sep 16, 2016: 84 rigs total (Oil 39, Gas 44, Miscellaneous 1) Week to Sep 23, 2016: 93 rigs total (Oil 42, Gas 51, Miscellaneous 0) Week to Sep 30, 2016: 113 rigs total (Oil 49, Gas 64, Miscellaneous 0) Week to Oct 7, 2016: 112 rigs total (Oil 48, Gas 64, Miscellaneous 0) Week to Oct 14, 2016: 113 rigs total (Oil 51, Gas 62, Miscellaneous 0) Week to Oct 21, 2016: 107 rigs total (Oil 46, Gas 61, Miscellaneous 0) Week to Oct 28, 2016: 109 rigs total (Oil 45, Gas 63, Miscellaneous 1) Week to Nov 4, 2016: 105 rigs total (Oil 43, Gas 61, Miscellaneous 1) Week to Nov 11, 2016: 114 rigs total (Oil 45, Gas 69, Miscellaneous 0) Week to Nov 18, 2016: 114 rigs total (Oil 47, Gas 67, Miscellaneous 0) Week to Nov 23, 2016: 108 rigs total (Oil 43, Gas 63, Miscellaneous 2) Week to Dec 2, 2016: 128 rigs total (Oil 50, Gas 76, Miscellaneous 2) Week to Dec 9, 2016: 155 rigs total (Oil 65, Gas 89, Miscellaneous 1) Week to Dec 16, 2016: 157 rigs total (Oil 61, Gas 94, Miscellaneous 2) Week to Dec 23, 2016: 164 rigs total (Oil 70, Gas 90, Miscellaneous 4) Week to Dec 30, 2016: 122 rigs total (Oil 38, Gas 79, Miscellaneous 5) Week to Jan 6, 2017: 150 rigs total (Oil 49, Gas 100, Miscellaneous 1) Week to Jan 13, 2017: 220 rigs total (Oil 103, Gas 116, Miscellaneous 1) Week to Jan 20, 2017: 247 rigs total (Oil 127, Gas 120, Miscellaneous 0) Week to Jan 27, 2017: 249 rigs total (Oil 134, Gas 115, Miscellaneous 0) Week to Feb 3, 2017: 247 rigs total (Oil 130, Gas 117, Miscellaneous 0) Week to Feb 10, 2017: 246 rigs total (Oil 132, Gas 114, Miscellaneous 0) Week to Feb 17, 2017: 232 rigs total (Oil 123, Gas 109, Miscellaneous 0) Week to Feb 24, 2017: 234 rigs total (Oil 130, Gas 104, Miscellaneous 0) Week to Mar 3, 2017: 227 rigs total (Oil 120, Gas 107, Miscellaneous 0) Week to Mar 10, 2017: 218 rigs total (Oil 114, Gas 104, Miscellaneous 0) Week to Mar 17, 2017: 190 rigs total (Oil 93, Gas 95, Miscellaneous 2) Week to Mar 24, 2017: 145 rigs total (Oil 59, Gas 85, Miscellaneous 1) Week to Mar 31, 2017: 123 rigs total (Oil 51, Gas 72, Miscellaneous 0) Week to Apr 7, 2017: 107 rigs total (Oil 40, Gas 67, Miscellaneous 0) Week to Apr 13, 2017: 100 rigs total (Oil 40, Gas 60, Miscellaneous 0) Week to Apr 21, 2017: 82 rigs total (Oil 31, Gas 51, Miscellaneous 0) Week to Apr 28, 2017: 68 rigs total (Oil 22, Gas 46, Miscellaneous 0) Week to May 5, 2017: 65 rigs total (Oil 24, Gas 41, Miscellaneous 0) Week to May 12, 2017: 69 rigs total (Oil 26, Gas 43, Miscellaneous 0) Week to May 19, 2017: 66 rigs total (Oil 26, Gas 40, Miscellaneous 0) Week to May 26, 2017: 66 rigs total (Oil 25, Gas 41, Miscellaneous 0) Week to Jun 2, 2017: 57 rigs total (Oil 24, Gas 33, Miscellaneous 0) Week to Jun 9, 2017: 78 rigs total (Oil 38, Gas 40, Miscellaneous 0) Week to Jun 16, 2017: 88 rigs total (Oil 40, Gas 48, Miscellaneous 0) Week to Jun 23, 2017: 94 rigs total (Oil 44, Gas 50, Miscellaneous 0) Week to Jun 30, 2017: 115 rigs total (Oil 60, Gas 55, Miscellaneous 0) Week to Jul 7, 2017: 105 rigs total (Oil 57, Gas 48, Miscellaneous 0) Week to Jul 14, 2017: 121 rigs total (Oil 61, Gas 60, Miscellaneous 0) Week to Jul 21, 2017: 132 rigs total (Oil 68, Gas 64, Miscellaneous 0) Week to Jul 28, 2017: 146 rigs total (Oil 78, Gas 68, Miscellaneous 0) Week to Aug 4, 2017: 145 rigs total (Oil 74, Gas 71, Miscellaneous 0) Week to Aug 11, 2017: 148 rigs total (Oil 75, Gas 73, Miscellaneous 0) Week to Aug 18, 2017: 138 rigs total (Oil 71, Gas 67, Miscellaneous 0) Week to Aug 25, 2017: 144 rigs total (Oil 71, Gas 73, Miscellaneous 0) Week to Sep 1, 2017: 130 rigs total (Oil 57, Gas 73, Miscellaneous 0) Week to Sep 8, 2017: 134 rigs total (Oil 61, Gas 73, Miscellaneous 0) Week to Sep 15, 2017: 141 rigs total (Oil 65, Gas 76, Miscellaneous 0) Week to Sep 22, 2017: 144 rigs total (Oil 72, Gas 72, Miscellaneous 0) Week to Sep 29, 2017: 144 rigs total (Oil 68, Gas 76, Miscellaneous 0) Week to Oct 6, 2017: 139 rigs total (Oil 66, Gas 73, Miscellaneous 0) Week to Oct 13, 2017: 144 rigs total (Oil 67, Gas 77, Miscellaneous 0) Week to Oct 20, 2017: 141 rigs total (Oil 71, Gas 70, Miscellaneous 0) Week to Oct 27, 2017: 136 rigs total (Oil 64, Gas 71, Miscellaneous 1) Week to Nov 3, 2017: 139 rigs total (Oil 70, Gas 68, Miscellaneous 1) Week to Nov 10, 2017: 148 rigs total (Oil 75, Gas 73, Miscellaneous 0) Week to Nov 17, 2017: 155 rigs total (Oil 79, Gas 76, Miscellaneous 0) Week to Nov 22, 2017: 153 rigs total (Oil 70, Gas 83, Miscellaneous 0) Week to Dec 1, 2017: 162 rigs total (Oil 74, Gas 88, Miscellaneous 0) Week to Dec 8, 2017: 160 rigs total (Oil 78, Gas 82, Miscellaneous 0) Week to Dec 15, 2017: 167 rigs total (Oil 85, Gas 82, Miscellaneous 0) Week to Dec 22, 2017: 162 rigs total (Oil 87, Gas 75, Miscellaneous 0) Week to Dec 29, 2017: 118 rigs total (Oil 57, Gas 61, Miscellaneous 0) Week to Jan 5, 2018: 129 rigs total (Oil 69, Gas 60, Miscellaneous 0) Week to Jan 12, 2018: 190 rigs total (Oil 120, Gas 70, Miscellaneous 0) Week to Jan 19, 2018: 223 rigs total (Oil 137, Gas 86, Miscellaneous 0) Week to Jan 26, 2018: 232 rigs total (Oil 143, Gas 89, Miscellaneous 0) Week to Feb 2, 2018: 229 rigs total (Oil 151, Gas 78, Miscellaneous 0) Week to Feb 9, 2018: 228 rigs total (Oil 148, Gas 80, Miscellaneous 0) Week to Feb 16, 2018: 222 rigs total (Oil 146, Gas 76, Miscellaneous 0) Week to Feb 23, 2018: 209 rigs total (Oil 136, Gas 73, Miscellaneous 0) Week to Mar 2, 2018: 208 rigs total (Oil 140, Gas 68, Miscellaneous 0) Week to Mar 9, 2018: 187 rigs total (Oil 128, Gas 59, Miscellaneous 0) Week to Mar 16, 2018: 157 rigs total (Oil 98, Gas 59, Miscellaneous 0) Week to Mar 23, 2018: 128 rigs total (Oil 75, Gas 53, Miscellaneous 0) Week to Mar 29, 2018: 114 rigs total (Oil 65, Gas 49, Miscellaneous 0) Week to Apr 6, 2018: 92 rigs total (Oil 43, Gas 49, Miscellaneous 0) Week to Apr 13, 2018: 85 rigs total (Oil 36, Gas 49, Miscellaneous 0) Week to Apr 20, 2018: 76 rigs total (Oil 32, Gas 44, Miscellaneous 0) Week to Apr 27, 2018: 67 rigs total (Oil 26, Gas 41, Miscellaneous 0) Week to May 4, 2018: 68 rigs total (Oil 30, Gas 38, Miscellaneous 0) Week to May 11, 2018: 62 rigs total (Oil 26, Gas 36, Miscellaneous 0) Week to May 18, 2018: 62 rigs total (Oil 28, Gas 34, Miscellaneous 0) Week to May 25, 2018: 58 rigs total (Oil 25, Gas 33, Miscellaneous 0) Week to Jun 1, 2018: 57 rigs total (Oil 30, Gas 27, Miscellaneous 0) Week to Jun 8, 2018: 68 rigs total (Oil 40, Gas 28, Miscellaneous 0) Week to Jun 15, 2018: 91 rigs total (Oil 54, Gas 37, Miscellaneous 0) Week to Jun 22, 2018: 103 rigs total (Oil 62, Gas 41, Miscellaneous 0) Week to Jun 29, 2018: 112 rigs total (Oil 72, Gas 40, Miscellaneous 0) Week to Jul 6, 2018: 120 rigs total (Oil 78, Gas 42, Miscellaneous 0) Week to Jul 13, 2018: 130 rigs total (Oil 86, Gas 44, Miscellaneous 0) Week to Jul 20, 2018: 144 rigs total (Oil 90, Gas 54, Miscellaneous 0) Week to Jul 27, 2018: 150 rigs total (Oil 96, Gas 54, Miscellaneous 0) Week to Aug 3, 2018: 156 rigs total (Oil 100, Gas 56, Miscellaneous 0) Week to Aug 10, 2018: 140 rigs total (Oil 88, Gas 52, Miscellaneous 0) Week to Aug 17, 2018: 145 rigs total (Oil 91, Gas 54, Miscellaneous 0) Week to Aug 24, 2018: 159 rigs total (Oil 100, Gas 59, Miscellaneous 0) Week to Aug 31, 2018: 160 rigs total (Oil 99, Gas 61, Miscellaneous 0) Week to Sep 7, 2018: 144 rigs total (Oil 86, Gas 58, Miscellaneous 0) Week to Sep 14, 2018: 156 rigs total (Oil 94, Gas 62, Miscellaneous 0) Week to Sep 21, 2018: 126 rigs total (Oil 80, Gas 46, Miscellaneous 0) Week to Sep 28, 2018: 110 rigs total (Oil 68, Gas 42, Miscellaneous 0) Week to Oct 5, 2018: 126 rigs total (Oil 78, Gas 48, Miscellaneous 0) Week to Oct 12, 2018: 130 rigs total (Oil 78, Gas 52, Miscellaneous 0) Week to Oct 19, 2018: 132 rigs total (Oil 77, Gas 55, Miscellaneous 0) Week to Oct 26, 2018: 141 rigs total (Oil 79, Gas 62, Miscellaneous 0) Week to Nov 2, 2018: 139 rigs total (Oil 76, Gas 63, Miscellaneous 0) Week to Nov 9, 2018: 136 rigs total (Oil 72, Gas 64, Miscellaneous 0) Week to Nov 16, 2018: 137 rigs total (Oil 73, Gas 64, Miscellaneous 0) Week to Nov 21, 2018: 138 rigs total (Oil 75, Gas 63, Miscellaneous 0) Week to Nov 30, 2018: 136 rigs total (Oil 76, Gas 60, Miscellaneous 0) Week to Dec 7, 2018: 128 rigs total (Oil 64, Gas 64, Miscellaneous 0) Week to Dec 14, 2018: 124 rigs total (Oil 62, Gas 62, Miscellaneous 0) Week to Dec 21, 2018: 104 rigs total (Oil 46, Gas 58, Miscellaneous 0) Week to Dec 28, 2018: 57 rigs total (Oil 13, Gas 44, Miscellaneous 0) Week to Jan 4, 2019: 61 rigs total (Oil 16, Gas 45, Miscellaneous 0) Week to Jan 11, 2019: 122 rigs total (Oil 58, Gas 64, Miscellaneous 0) Week to Jan 18, 2019: 138 rigs total (Oil 72, Gas 66, Miscellaneous 0) Week to Jan 25, 2019: 161 rigs total (Oil 91, Gas 70, Miscellaneous 0) Week to Feb 1, 2019: 164 rigs total (Oil 100, Gas 64, Miscellaneous 0) Week to Feb 8, 2019: 159 rigs total (Oil 96, Gas 63, Miscellaneous 0) Week to Feb 15, 2019: 153 rigs total (Oil 94, Gas 59, Miscellaneous 0) Week to Feb 22, 2019: 144 rigs total (Oil 88, Gas 56, Miscellaneous 0) Week to Mar 1, 2019: 145 rigs total (Oil 90, Gas 55, Miscellaneous 0) Week to Mar 8, 2019: 137 rigs total (Oil 83, Gas 54, Miscellaneous 0) Week to Mar 15, 2019: 116 rigs total (Oil 68, Gas 48, Miscellaneous 0) Week to Mar 22, 2019: 85 rigs total (Oil 45, Gas 40, Miscellaneous 0) Week to Mar 29, 2019: 68 rigs total (Oil 33, Gas 35, Miscellaneous 0) Week to Apr 5, 2019: 52 rigs total (Oil 21, Gas 31, Miscellaneous 0) Week to Apr 12, 2019: 48 rigs total (Oil 16, Gas 32, Miscellaneous 0) Week to Apr 18, 2019: 48 rigs total (Oil 17, Gas 31, Miscellaneous 0) Week to Apr 26, 2019: 46 rigs total (Oil 17, Gas 29, Miscellaneous 0) Week to May 3, 2019: 42 rigs total (Oil 14, Gas 28, Miscellaneous 0) Week to May 10, 2019: 42 rigs total (Oil 17, Gas 25, Miscellaneous 0) Week to May 17, 2019: 43 rigs total (Oil 18, Gas 25, Miscellaneous 0) Week to May 24, 2019: 53 rigs total (Oil 25, Gas 28, Miscellaneous 0) Week to May 31, 2019: 56 rigs total (Oil 26, Gas 30, Miscellaneous 0) Week to Jun 7, 2019: 63 rigs total (Oil 31, Gas 32, Miscellaneous 0) Week to Jun 14, 2019: 56 rigs total (Oil 28, Gas 28, Miscellaneous 0) Week to Jun 21, 2019: 63 rigs total (Oil 34, Gas 29, Miscellaneous 0) Week to Jun 28, 2019: 69 rigs total (Oil 42, Gas 27, Miscellaneous 0) Week to Jul 3, 2019: 65 rigs total (Oil 37, Gas 28, Miscellaneous 0) Week to Jul 12, 2019: 62 rigs total (Oil 41, Gas 21, Miscellaneous 0) Week to Jul 19, 2019: 63 rigs total (Oil 40, Gas 23, Miscellaneous 0) Week to Jul 26, 2019: 73 rigs total (Oil 43, Gas 30, Miscellaneous 0) Week to Aug 2, 2019: 86 rigs total (Oil 50, Gas 36, Miscellaneous 0) Week to Aug 9, 2019: 94 rigs total (Oil 56, Gas 38, Miscellaneous 0) Week to Aug 16, 2019: 95 rigs total (Oil 62, Gas 33, Miscellaneous 0) Week to Aug 23, 2019: 94 rigs total (Oil 57, Gas 37, Miscellaneous 0) Week to Aug 30, 2019: 96 rigs total (Oil 60, Gas 36, Miscellaneous 0) Week to Sep 6, 2019: 97 rigs total (Oil 61, Gas 36, Miscellaneous 0) Week to Sep 13, 2019: 86 rigs total (Oil 55, Gas 31, Miscellaneous 0) Week to Sep 20, 2019: 77 rigs total (Oil 49, Gas 28, Miscellaneous 0) Week to Sep 27, 2019: 83 rigs total (Oil 54, Gas 29, Miscellaneous 0) Week to Oct 4, 2019: 94 rigs total (Oil 65, Gas 29, Miscellaneous 0) Week to Oct 11, 2019: 97 rigs total (Oil 63, Gas 34, Miscellaneous 0) Week to Oct 18, 2019: 95 rigs total (Oil 60, Gas 35, Miscellaneous 0) Week to Oct 25, 2019: 97 rigs total (Oil 61, Gas 36, Miscellaneous 0) Week to Nov 1, 2019: 99 rigs total (Oil 60, Gas 39, Miscellaneous 0) Week to Nov 8, 2019: 96 rigs total (Oil 61, Gas 35, Miscellaneous 0) Week to Nov 15, 2019: 90 rigs total (Oil 52, Gas 38, Miscellaneous 0) Week to Nov 22, 2019: 91 rigs total (Oil 50, Gas 41, Miscellaneous 0) Week to Nov 27, 2019: 86 rigs total (Oil 47, Gas 39, Miscellaneous 0) Week to Dec 6, 2019: 91 rigs total (Oil 49, Gas 42, Miscellaneous 0) Week to Dec 13, 2019: 98 rigs total (Oil 51, Gas 47, Miscellaneous 0) Week to Dec 20, 2019: 102 rigs total (Oil 51, Gas 51, Miscellaneous 0) Week to Dec 27, 2019: 64 rigs total (Oil 25, Gas 39, Miscellaneous 0) Week to Jan 3, 2020: 64 rigs total (Oil 16, Gas 48, Miscellaneous 0) Week to Jan 10, 2020: 133 rigs total (Oil 64, Gas 69, Miscellaneous 0) Week to Jan 17, 2020: 170 rigs total (Oil 95, Gas 75, Miscellaneous 0) Week to Jan 24, 2020: 171 rigs total (Oil 98, Gas 73, Miscellaneous 0) Week to Jan 31, 2020: 171 rigs total (Oil 100, Gas 71, Miscellaneous 0) Week to Feb 7, 2020: 167 rigs total (Oil 96, Gas 71, Miscellaneous 0) Week to Feb 14, 2020: 160 rigs total (Oil 95, Gas 65, Miscellaneous 0) Week to Feb 21, 2020: 152 rigs total (Oil 93, Gas 59, Miscellaneous 0) Week to Feb 28, 2020: 159 rigs total (Oil 98, Gas 61, Miscellaneous 0) Week to Mar 6, 2020: 139 rigs total (Oil 85, Gas 54, Miscellaneous 0) Week to Mar 13, 2020: 127 rigs total (Oil 82, Gas 45, Miscellaneous 0) Week to Mar 20, 2020: 73 rigs total (Oil 38, Gas 35, Miscellaneous 0) Week to Mar 27, 2020: 46 rigs total (Oil 17, Gas 29, Miscellaneous 0) Week to Apr 3, 2020: 29 rigs total (Oil 7, Gas 22, Miscellaneous 0) Week to Apr 9, 2020: 22 rigs total (Oil 4, Gas 18, Miscellaneous 0) Week to Apr 17, 2020: 17 rigs total (Oil 4, Gas 13, Miscellaneous 0) Week to Apr 24, 2020: 16 rigs total (Oil 5, Gas 11, Miscellaneous 0) Week to May 1, 2020: 16 rigs total (Oil 3, Gas 13, Miscellaneous 0) Week to May 8, 2020: 15 rigs total (Oil 3, Gas 12, Miscellaneous 0) Week to May 15, 2020: 11 rigs total (Oil 2, Gas 9, Miscellaneous 0) Week to May 22, 2020: 10 rigs total (Oil 3, Gas 7, Miscellaneous 0) Week to May 29, 2020: 10 rigs total (Oil 3, Gas 7, Miscellaneous 0) Week to Jun 5, 2020: 11 rigs total (Oil 3, Gas 8, Miscellaneous 0) Week to Jun 12, 2020: 11 rigs total (Oil 3, Gas 8, Miscellaneous 0) Week to Jun 19, 2020: 7 rigs total (Oil 1, Gas 6, Miscellaneous 0) Week to Jun 26, 2020: 5 rigs total (Oil 1, Gas 4, Miscellaneous 0) Week to Jul 2, 2020: 9 rigs total (Oil 2, Gas 7, Miscellaneous 0) Week to Jul 10, 2020: 16 rigs total (Oil 2, Gas 14, Miscellaneous 0) Week to Jul 17, 2020: 20 rigs total (Oil 3, Gas 17, Miscellaneous 0) Week to Jul 24, 2020: 28 rigs total (Oil 6, Gas 22, Miscellaneous 0) Week to Jul 31, 2020: 29 rigs total (Oil 6, Gas 23, Miscellaneous 0) Week to Aug 7, 2020: 31 rigs total (Oil 8, Gas 23, Miscellaneous 0) Week to Aug 14, 2020: 33 rigs total (Oil 10, Gas 23, Miscellaneous 0) Week to Aug 21, 2020: 32 rigs total (Oil 11, Gas 21, Miscellaneous 0) Week to Aug 28, 2020: 30 rigs total (Oil 10, Gas 20, Miscellaneous 0) Week to Sep 4, 2020: 28 rigs total (Oil 10, Gas 18, Miscellaneous 0) Week to Sep 11, 2020: 30 rigs total (Oil 11, Gas 19, Miscellaneous 0) Week to Sep 18, 2020: 34 rigs total (Oil 14, Gas 20, Miscellaneous 0) Week to Sep 25, 2020: 41 rigs total (Oil 17, Gas 24, Miscellaneous 0) Week to Oct 2, 2020: 42 rigs total (Oil 18, Gas 24, Miscellaneous 0) Week to Oct 9, 2020: 46 rigs total (Oil 19, Gas 27, Miscellaneous 0) Week to Oct 16, 2020: 43 rigs total (Oil 18, Gas 25, Miscellaneous 0) Week to Oct 23, 2020: 45 rigs total (Oil 19, Gas 26, Miscellaneous 0) Week to Oct 30, 2020: 48 rigs total (Oil 20, Gas 28, Miscellaneous 0) Week to Nov 6, 2020: 46 rigs total (Oil 16, Gas 30, Miscellaneous 0) Week to Nov 13, 2020: 49 rigs total (Oil 17, Gas 32, Miscellaneous 0) Week to Nov 20, 2020: 62 rigs total (Oil 20, Gas 42, Miscellaneous 0) Week to Nov 25, 2020: 62 rigs total (Oil 17, Gas 45, Miscellaneous 0) Week to Dec 4, 2020: 63 rigs total (Oil 20, Gas 43, Miscellaneous 0) Week to Dec 11, 2020: 69 rigs total (Oil 28, Gas 41, Miscellaneous 0) Week to Dec 18, 2020: 67 rigs total (Oil 24, Gas 43, Miscellaneous 0) Week to Dec 23, 2020: 57 rigs total (Oil 21, Gas 36, Miscellaneous 0) Week to Dec 31, 2020: 48 rigs total (Oil 17, Gas 31, Miscellaneous 0) Week to Jan 8, 2021: 81 rigs total (Oil 35, Gas 46, Miscellaneous 0) Week to Jan 15, 2021: 108 rigs total (Oil 57, Gas 51, Miscellaneous 0) Week to Jan 22, 2021: 116 rigs total (Oil 63, Gas 53, Miscellaneous 0) Week to Jan 29, 2021: 114 rigs total (Oil 61, Gas 53, Miscellaneous 0) Week to Feb 5, 2021: 113 rigs total (Oil 59, Gas 54, Miscellaneous 0) Week to Feb 12, 2021: 118 rigs total (Oil 65, Gas 53, Miscellaneous 0) Week to Feb 19, 2021: 111 rigs total (Oil 62, Gas 49, Miscellaneous 0) Week to Feb 26, 2021: 102 rigs total (Oil 53, Gas 49, Miscellaneous 0) Week to Mar 5, 2021: 91 rigs total (Oil 49, Gas 42, Miscellaneous 0) Week to Mar 12, 2021: 80 rigs total (Oil 41, Gas 39, Miscellaneous 0) Week to Mar 19, 2021: 68 rigs total (Oil 33, Gas 35, Miscellaneous 0) Week to Mar 26, 2021: 60 rigs total (Oil 28, Gas 32, Miscellaneous 0) Week to Apr 1, 2021: 51 rigs total (Oil 23, Gas 28, Miscellaneous 0) Week to Apr 9, 2021: 44 rigs total (Oil 18, Gas 26, Miscellaneous 0) Week to Apr 16, 2021: 41 rigs total (Oil 16, Gas 25, Miscellaneous 0) Week to Apr 23, 2021: 40 rigs total (Oil 16, Gas 24, Miscellaneous 0) Week to Apr 30, 2021: 35 rigs total (Oil 16, Gas 19, Miscellaneous 0) Week to May 7, 2021: 38 rigs total (Oil 16, Gas 22, Miscellaneous 0) Week to May 14, 2021: 39 rigs total (Oil 16, Gas 23, Miscellaneous 0) Week to May 21, 2021: 36 rigs total (Oil 14, Gas 22, Miscellaneous 0) Week to May 28, 2021: 37 rigs total (Oil 14, Gas 23, Miscellaneous 0) Week to Jun 4, 2021: 42 rigs total (Oil 20, Gas 22, Miscellaneous 0) Week to Jun 11, 2021: 52 rigs total (Oil 29, Gas 23, Miscellaneous 0) Week to Jun 18, 2021: 71 rigs total (Oil 42, Gas 29, Miscellaneous 0) Week to Jun 25, 2021: 76 rigs total (Oil 47, Gas 29, Miscellaneous 0) Week to Jul 2, 2021: 84 rigs total (Oil 51, Gas 32, Miscellaneous 1) Week to Jul 9, 2021: 88 rigs total (Oil 56, Gas 32, Miscellaneous 0) Week to Jul 16, 2021: 98 rigs total (Oil 61, Gas 37, Miscellaneous 0) Week to Jul 23, 2021: 95 rigs total (Oil 59, Gas 36, Miscellaneous 0) Week to Jul 30, 2021: 100 rigs total (Oil 62, Gas 38, Miscellaneous 0) Week to Aug 6, 2021: 102 rigs total (Oil 63, Gas 39, Miscellaneous 0) Week to Aug 13, 2021: 109 rigs total (Oil 66, Gas 43, Miscellaneous 0) Week to Aug 20, 2021: 104 rigs total (Oil 64, Gas 40, Miscellaneous 0) Week to Aug 27, 2021: 99 rigs total (Oil 58, Gas 41, Miscellaneous 0) Week to Sep 3, 2021: 102 rigs total (Oil 61, Gas 41, Miscellaneous 0) Week to Sep 10, 2021: 95 rigs total (Oil 58, Gas 37, Miscellaneous 0) Week to Sep 17, 2021: 106 rigs total (Oil 66, Gas 40, Miscellaneous 0) Week to Sep 24, 2021: 113 rigs total (Oil 67, Gas 45, Miscellaneous 1) Week to Oct 1, 2021: 117 rigs total (Oil 70, Gas 47, Miscellaneous 0) Week to Oct 8, 2021: 118 rigs total (Oil 68, Gas 50, Miscellaneous 0) Week to Oct 15, 2021: 119 rigs total (Oil 69, Gas 50, Miscellaneous 0) Week to Oct 22, 2021: 119 rigs total (Oil 65, Gas 54, Miscellaneous 0) Week to Oct 29, 2021: 118 rigs total (Oil 67, Gas 51, Miscellaneous 0) Week to Nov 5, 2021: 111 rigs total (Oil 63, Gas 48, Miscellaneous 0) Week to Nov 12, 2021: 118 rigs total (Oil 66, Gas 52, Miscellaneous 0) Week to Nov 19, 2021: 115 rigs total (Oil 65, Gas 50, Miscellaneous 0) Week to Nov 24, 2021: 118 rigs total (Oil 67, Gas 51, Miscellaneous 0) Week to Dec 3, 2021: 129 rigs total (Oil 76, Gas 53, Miscellaneous 0) Week to Dec 10, 2021: 124 rigs total (Oil 71, Gas 53, Miscellaneous 0) Week to Dec 17, 2021: 116 rigs total (Oil 65, Gas 50, Miscellaneous 1) Week to Dec 23, 2021: 88 rigs total (Oil 52, Gas 36, Miscellaneous 0) Week to Dec 31, 2021: 65 rigs total (Oil 27, Gas 38, Miscellaneous 0) Week to Jan 7, 2022: 105 rigs total (Oil 55, Gas 50, Miscellaneous 0) Week to Jan 14, 2022: 139 rigs total (Oil 84, Gas 55, Miscellaneous 0) Week to Jan 21, 2022: 161 rigs total (Oil 99, Gas 62, Miscellaneous 0) Week to Jan 28, 2022: 164 rigs total (Oil 98, Gas 66, Miscellaneous 0) Week to Feb 4, 2022: 166 rigs total (Oil 100, Gas 66, Miscellaneous 0) Week to Feb 11, 2022: 167 rigs total (Oil 101, Gas 66, Miscellaneous 0) Week to Feb 18, 2022: 166 rigs total (Oil 98, Gas 68, Miscellaneous 0) Week to Feb 25, 2022: 171 rigs total (Oil 102, Gas 68, Miscellaneous 1) Week to Mar 4, 2022: 166 rigs total (Oil 100, Gas 65, Miscellaneous 1) Week to Mar 11, 2022: 162 rigs total (Oil 99, Gas 63, Miscellaneous 0) Week to Mar 18, 2022: 147 rigs total (Oil 89, Gas 58, Miscellaneous 0) Week to Mar 25, 2022: 123 rigs total (Oil 73, Gas 50, Miscellaneous 0) Week to Apr 1, 2022: 108 rigs total (Oil 61, Gas 47, Miscellaneous 0) Week to Apr 8, 2022: 97 rigs total (Oil 51, Gas 46, Miscellaneous 0) Week to Apr 14, 2022: 89 rigs total (Oil 46, Gas 43, Miscellaneous 0) Week to Apr 22, 2022: 87 rigs total (Oil 45, Gas 42, Miscellaneous 0) Week to Apr 29, 2022: 82 rigs total (Oil 43, Gas 39, Miscellaneous 0) Week to May 6, 2022: 78 rigs total (Oil 40, Gas 38, Miscellaneous 0) Week to May 13, 2022: 75 rigs total (Oil 35, Gas 40, Miscellaneous 0) Week to May 20, 2022: 68 rigs total (Oil 34, Gas 34, Miscellaneous 0) Week to May 27, 2022: 75 rigs total (Oil 41, Gas 34, Miscellaneous 0) Week to Jun 3, 2022: 85 rigs total (Oil 51, Gas 34, Miscellaneous 0) Week to Jun 10, 2022: 102 rigs total (Oil 64, Gas 38, Miscellaneous 0) Week to Jun 17, 2022: 109 rigs total (Oil 69, Gas 40, Miscellaneous 0) Week to Jun 24, 2022: 105 rigs total (Oil 66, Gas 39, Miscellaneous 0) Week to Jul 1, 2022: 111 rigs total (Oil 68, Gas 43, Miscellaneous 0) Week to Jul 8, 2022: 118 rigs total (Oil 73, Gas 45, Miscellaneous 0) Week to Jul 15, 2022: 129 rigs total (Oil 78, Gas 51, Miscellaneous 0) Week to Jul 22, 2022: 134 rigs total (Oil 78, Gas 56, Miscellaneous 0) Week to Jul 29, 2022: 144 rigs total (Oil 93, Gas 51, Miscellaneous 0) Week to Aug 5, 2022: 141 rigs total (Oil 94, Gas 47, Miscellaneous 0) Week to Aug 12, 2022: 142 rigs total (Oil 93, Gas 49, Miscellaneous 0) Week to Aug 19, 2022: 143 rigs total (Oil 94, Gas 49, Miscellaneous 0) Week to Aug 26, 2022: 142 rigs total (Oil 92, Gas 50, Miscellaneous 0) Week to Sep 2, 2022: 148 rigs total (Oil 98, Gas 50, Miscellaneous 0) Week to Sep 9, 2022: 145 rigs total (Oil 95, Gas 50, Miscellaneous 0) Week to Sep 16, 2022: 151 rigs total (Oil 102, Gas 49, Miscellaneous 0) Week to Sep 23, 2022: 154 rigs total (Oil 104, Gas 50, Miscellaneous 0) Week to Sep 30, 2022: 149 rigs total (Oil 97, Gas 52, Miscellaneous 0) Week to Oct 7, 2022: 148 rigs total (Oil 98, Gas 50, Miscellaneous 0) Week to Oct 14, 2022: 149 rigs total (Oil 101, Gas 48, Miscellaneous 0) Week to Oct 21, 2022: 144 rigs total (Oil 94, Gas 50, Miscellaneous 0) Week to Oct 28, 2022: 149 rigs total (Oil 99, Gas 50, Miscellaneous 0) Week to Nov 4, 2022: 149 rigs total (Oil 98, Gas 51, Miscellaneous 0) Week to Nov 10, 2022: 144 rigs total (Oil 94, Gas 50, Miscellaneous 0) Week to Nov 18, 2022: 147 rigs total (Oil 97, Gas 50, Miscellaneous 0) Week to Nov 23, 2022: 145 rigs total (Oil 97, Gas 48, Miscellaneous 0) Week to Dec 2, 2022: 150 rigs total (Oil 99, Gas 51, Miscellaneous 0) Week to Dec 9, 2022: 152 rigs total (Oil 99, Gas 53, Miscellaneous 0) Week to Dec 16, 2022: 153 rigs total (Oil 96, Gas 57, Miscellaneous 0) Week to Dec 22, 2022: 78 rigs total (Oil 31, Gas 47, Miscellaneous 0) Week to Dec 30, 2022: 69 rigs total (Oil 24, Gas 45, Miscellaneous 0) Week to Jan 6, 2023: 141 rigs total (Oil 82, Gas 59, Miscellaneous 0) Week to Jan 13, 2023: 170 rigs total (Oil 103, Gas 67, Miscellaneous 0) Week to Jan 20, 2023: 183 rigs total (Oil 114, Gas 69, Miscellaneous 0) Week to Jan 27, 2023: 183 rigs total (Oil 113, Gas 70, Miscellaneous 0) Week to Feb 3, 2023: 188 rigs total (Oil 119, Gas 69, Miscellaneous 0) Week to Feb 10, 2023: 187 rigs total (Oil 119, Gas 68, Miscellaneous 0) Week to Feb 17, 2023: 184 rigs total (Oil 120, Gas 64, Miscellaneous 0) Week to Feb 24, 2023: 180 rigs total (Oil 115, Gas 65, Miscellaneous 0) Week to Mar 3, 2023: 184 rigs total (Oil 116, Gas 68, Miscellaneous 0) Week to Mar 10, 2023: 166 rigs total (Oil 103, Gas 63, Miscellaneous 0) Week to Mar 17, 2023: 161 rigs total (Oil 98, Gas 63, Miscellaneous 0) Week to Mar 24, 2023: 141 rigs total (Oil 81, Gas 60, Miscellaneous 0) Week to Mar 31, 2023: 114 rigs total (Oil 56, Gas 58, Miscellaneous 0) Week to Apr 6, 2023: 104 rigs total (Oil 50, Gas 54, Miscellaneous 0) Week to Apr 14, 2023: 89 rigs total (Oil 43, Gas 46, Miscellaneous 0) Week to Apr 21, 2023: 82 rigs total (Oil 40, Gas 42, Miscellaneous 0) Week to Apr 28, 2023: 72 rigs total (Oil 34, Gas 38, Miscellaneous 0) Week to May 5, 2023: 68 rigs total (Oil 32, Gas 36, Miscellaneous 0) Week to May 12, 2023: 69 rigs total (Oil 34, Gas 35, Miscellaneous 0) Week to May 19, 2023: 63 rigs total (Oil 35, Gas 28, Miscellaneous 0) Week to May 26, 2023: 61 rigs total (Oil 35, Gas 26, Miscellaneous 0) Week to Jun 2, 2023: 67 rigs total (Oil 39, Gas 28, Miscellaneous 0) Week to Jun 9, 2023: 90 rigs total (Oil 54, Gas 36, Miscellaneous 0) Week to Jun 16, 2023: 108 rigs total (Oil 68, Gas 40, Miscellaneous 0) Week to Jun 23, 2023: 110 rigs total (Oil 70, Gas 40, Miscellaneous 0) Week to Jun 30, 2023: 108 rigs total (Oil 69, Gas 39, Miscellaneous 0) Week to Jul 7, 2023: 116 rigs total (Oil 73, Gas 43, Miscellaneous 0) Week to Jul 14, 2023: 125 rigs total (Oil 74, Gas 51, Miscellaneous 0) Week to Jul 21, 2023: 129 rigs total (Oil 79, Gas 50, Miscellaneous 0) Week to Jul 28, 2023: 131 rigs total (Oil 82, Gas 49, Miscellaneous 0) Week to Aug 4, 2023: 130 rigs total (Oil 82, Gas 48, Miscellaneous 0) Week to Aug 11, 2023: 134 rigs total (Oil 82, Gas 52, Miscellaneous 0) Week to Aug 18, 2023: 131 rigs total (Oil 81, Gas 50, Miscellaneous 0) Week to Aug 25, 2023: 131 rigs total (Oil 79, Gas 52, Miscellaneous 0) Week to Sep 1, 2023: 129 rigs total (Oil 79, Gas 50, Miscellaneous 0) Week to Sep 8, 2023: 125 rigs total (Oil 77, Gas 48, Miscellaneous 0) Week to Sep 15, 2023: 132 rigs total (Oil 82, Gas 50, Miscellaneous 0) Week to Sep 22, 2023: 133 rigs total (Oil 80, Gas 53, Miscellaneous 0) Week to Sep 29, 2023: 135 rigs total (Oil 82, Gas 53, Miscellaneous 0) Week to Oct 6, 2023: 128 rigs total (Oil 79, Gas 49, Miscellaneous 0) Week to Oct 13, 2023: 138 rigs total (Oil 84, Gas 53, Miscellaneous 1) Week to Oct 20, 2023: 141 rigs total (Oil 86, Gas 55, Miscellaneous 0) Week to Oct 27, 2023: 138 rigs total (Oil 86, Gas 52, Miscellaneous 0) Week to Nov 3, 2023: 138 rigs total (Oil 86, Gas 52, Miscellaneous 0) Week to Nov 10, 2023: 146 rigs total (Oil 95, Gas 51, Miscellaneous 0) Week to Nov 17, 2023: 146 rigs total (Oil 96, Gas 50, Miscellaneous 0) Week to Nov 22, 2023: 144 rigs total (Oil 96, Gas 48, Miscellaneous 0) Week to Dec 1, 2023: 137 rigs total (Oil 89, Gas 48, Miscellaneous 0) Week to Dec 8, 2023: 136 rigs total (Oil 86, Gas 50, Miscellaneous 0) Week to Dec 15, 2023: 131 rigs total (Oil 86, Gas 45, Miscellaneous 0) Week to Dec 21, 2023: 113 rigs total (Oil 67, Gas 46, Miscellaneous 0) Week to Dec 29, 2023: 65 rigs total (Oil 26, Gas 39, Miscellaneous 0) Week to Jan 5, 2024: 182 rigs total (Oil 90, Gas 92, Miscellaneous 0) Week to Jan 12, 2024: 294 rigs total (Oil 186, Gas 108, Miscellaneous 0) Week to Jan 19, 2024: 318 rigs total (Oil 200, Gas 118, Miscellaneous 0) Week to Jan 26, 2024: 330 rigs total (Oil 206, Gas 124, Miscellaneous 0) Week to Feb 2, 2024: 326 rigs total (Oil 200, Gas 126, Miscellaneous 0) Week to Feb 9, 2024: 326 rigs total (Oil 200, Gas 126, Miscellaneous 0) Week to Feb 16, 2024: 326 rigs total (Oil 206, Gas 120, Miscellaneous 0) Week to Feb 23, 2024: 330 rigs total (Oil 210, Gas 120, Miscellaneous 0) Week to Mar 1, 2024: 334 rigs total (Oil 220, Gas 114, Miscellaneous 0) Week to Mar 8, 2024: 330 rigs total (Oil 222, Gas 108, Miscellaneous 0) Week to Mar 15, 2024: 310 rigs total (Oil 210, Gas 100, Miscellaneous 0) Week to Mar 22, 2024: 260 rigs total (Oil 158, Gas 102, Miscellaneous 0) Week to Mar 28, 2024: 234 rigs total (Oil 138, Gas 96, Miscellaneous 0) Week to Apr 5, 2024: 212 rigs total (Oil 124, Gas 88, Miscellaneous 0) Week to Apr 12, 2024: 212 rigs total (Oil 128, Gas 84, Miscellaneous 0) Week to Apr 19, 2024: 192 rigs total (Oil 106, Gas 86, Miscellaneous 0) Week to Apr 26, 2024: 178 rigs total (Oil 96, Gas 82, Miscellaneous 0) Week to May 3, 2024: 186 rigs total (Oil 104, Gas 82, Miscellaneous 0) Week to May 10, 2024: 176 rigs total (Oil 104, Gas 72, Miscellaneous 0) Week to May 17, 2024: 166 rigs total (Oil 94, Gas 72, Miscellaneous 0) Week to May 24, 2024: 166 rigs total (Oil 102, Gas 64, Miscellaneous 0) Week to May 31, 2024: 168 rigs total (Oil 106, Gas 62, Miscellaneous 0) Week to Jun 7, 2024: 172 rigs total (Oil 112, Gas 60, Miscellaneous 0) Week to Jun 14, 2024: 198 rigs total (Oil 132, Gas 66, Miscellaneous 0) Week to Jun 21, 2024: 220 rigs total (Oil 152, Gas 68, Miscellaneous 0) Week to Jun 28, 2024: 234 rigs total (Oil 162, Gas 70, Miscellaneous 2) Week to Jul 5, 2024: 244 rigs total (Oil 170, Gas 74, Miscellaneous 0) Week to Jul 12, 2024: 264 rigs total (Oil 186, Gas 78, Miscellaneous 0) Week to Jul 19, 2024: 286 rigs total (Oil 200, Gas 84, Miscellaneous 2) Week to Jul 26, 2024: 306 rigs total (Oil 218, Gas 88, Miscellaneous 0) Week to Aug 2, 2024: 302 rigs total (Oil 212, Gas 90, Miscellaneous 0) Week to Aug 9, 2024: 296 rigs total (Oil 204, Gas 90, Miscellaneous 2) Week to Aug 16, 2024: 298 rigs total (Oil 212, Gas 86, Miscellaneous 0) Week to Aug 23, 2024: 302 rigs total (Oil 216, Gas 86, Miscellaneous 0) Week to Aug 30, 2024: 306 rigs total (Oil 216, Gas 90, Miscellaneous 0) Week to Sep 6, 2024: 306 rigs total (Oil 210, Gas 94, Miscellaneous 2) Week to Sep 13, 2024: 308 rigs total (Oil 214, Gas 92, Miscellaneous 2) Week to Sep 20, 2024: 294 rigs total (Oil 200, Gas 92, Miscellaneous 2) Week to Sep 27, 2024: 308 rigs total (Oil 218, Gas 88, Miscellaneous 2) Week to Oct 4, 2024: 316 rigs total (Oil 226, Gas 88, Miscellaneous 2) Week to Oct 11, 2024: 310 rigs total (Oil 222, Gas 88, Miscellaneous 0) Week to Oct 18, 2024: 308 rigs total (Oil 220, Gas 88, Miscellaneous 0) Week to Oct 25, 2024: 308 rigs total (Oil 214, Gas 94, Miscellaneous 0) Week to Nov 1, 2024: 300 rigs total (Oil 206, Gas 94, Miscellaneous 0) Week to Nov 8, 2024: 290 rigs total (Oil 200, Gas 90, Miscellaneous 0) Week to Nov 15, 2024: 274 rigs total (Oil 188, Gas 86, Miscellaneous 0) Week to Nov 22, 2024: 268 rigs total (Oil 174, Gas 92, Miscellaneous 2) Week to Nov 27, 2024: 276 rigs total (Oil 178, Gas 96, Miscellaneous 2) Week to Dec 6, 2024: 266 rigs total (Oil 170, Gas 96, Miscellaneous 0) Week to Dec 13, 2024: 268 rigs total (Oil 168, Gas 100, Miscellaneous 0) Week to Dec 20, 2024: 236 rigs total (Oil 156, Gas 80, Miscellaneous 0) Week to Dec 27, 2024: 146 rigs total (Oil 74, Gas 72, Miscellaneous 0) Week to Jan 3, 2025: 150 rigs total (Oil 80, Gas 70, Miscellaneous 0) Week to Jan 10, 2025: 298 rigs total (Oil 198, Gas 100, Miscellaneous 0) Week to Jan 17, 2025: 314 rigs total (Oil 212, Gas 102, Miscellaneous 0) Week to Jan 24, 2025: 342 rigs total (Oil 244, Gas 98, Miscellaneous 0) Week to Jan 31, 2025: 364 rigs total (Oil 264, Gas 100, Miscellaneous 0) Week to Feb 7, 2025: 350 rigs total (Oil 250, Gas 100, Miscellaneous 0) Week to Feb 14, 2025: 342 rigs total (Oil 244, Gas 98, Miscellaneous 0) Week to Feb 21, 2025: 346 rigs total (Oil 246, Gas 100, Miscellaneous 0) Week to Feb 28, 2025: 356 rigs total (Oil 258, Gas 98, Miscellaneous 0) Week to Mar 7, 2025: 340 rigs total (Oil 250, Gas 90, Miscellaneous 0) Week to Mar 14, 2025: 298 rigs total (Oil 212, Gas 86, Miscellaneous 0) Week to Mar 21, 2025: 272 rigs total (Oil 184, Gas 86, Miscellaneous 2) Week to Mar 28, 2025: 256 rigs total (Oil 176, Gas 78, Miscellaneous 2) Week to Apr 4, 2025: 242 rigs total (Oil 166, Gas 76, Miscellaneous 0) Week to Apr 11, 2025: 222 rigs total (Oil 154, Gas 68, Miscellaneous 0) Week to Apr 17, 2025: 216 rigs total (Oil 152, Gas 64, Miscellaneous 0) Week to Apr 25, 2025: 204 rigs total (Oil 140, Gas 64, Miscellaneous 0) Week to May 2, 2025: 190 rigs total (Oil 128, Gas 62, Miscellaneous 0) Week to May 9, 2025: 182 rigs total (Oil 120, Gas 62, Miscellaneous 0) Week to May 16, 2025: 190 rigs total (Oil 126, Gas 64, Miscellaneous 0) Week to May 23, 2025: 178 rigs total (Oil 120, Gas 58, Miscellaneous 0) Week to May 30, 2025: 172 rigs total (Oil 114, Gas 58, Miscellaneous 0) Week to Jun 6, 2025: 160 rigs total (Oil 100, Gas 60, Miscellaneous 0) Week to Jun 13, 2025: 196 rigs total (Oil 132, Gas 64, Miscellaneous 0) Week to Jun 20, 2025: 196 rigs total (Oil 132, Gas 64, Miscellaneous 0) Week to Jun 27, 2025: 198 rigs total (Oil 134, Gas 64, Miscellaneous 0) Week to Jul 3, 2025: 220 rigs total (Oil 150, Gas 70, Miscellaneous 0) Week to Jul 11, 2025: 222 rigs total (Oil 154, Gas 68, Miscellaneous 0) Week to Jul 18, 2025: 236 rigs total (Oil 164, Gas 72, Miscellaneous 0) Week to Jul 25, 2025: 252 rigs total (Oil 180, Gas 72, Miscellaneous 0) Week to Aug 1, 2025: 248 rigs total (Oil 176, Gas 72, Miscellaneous 0) Week to Aug 8, 2025: 256 rigs total (Oil 174, Gas 80, Miscellaneous 2) Week to Aug 15, 2025: 256 rigs total (Oil 176, Gas 80, Miscellaneous 0) Week to Aug 22, 2025: 252 rigs total (Oil 172, Gas 78, Miscellaneous 2) Week to Aug 29, 2025: 250 rigs total (Oil 168, Gas 82, Miscellaneous 0) Week to Sep 5, 2025: 129 rigs total (Oil 85, Gas 44, Miscellaneous 0) Week to Sep 12, 2025: 130 rigs total (Oil 85, Gas 44, Miscellaneous 1) Week to Sep 19, 2025: 135 rigs total (Oil 88, Gas 46, Miscellaneous 1) Week to Sep 26, 2025: 137 rigs total (Oil 90, Gas 46, Miscellaneous 1) Week to Oct 3, 2025: 138 rigs total (Oil 92, Gas 45, Miscellaneous 1) Week to Oct 10, 2025: 140 rigs total (Oil 93, Gas 46, Miscellaneous 1) Week to Oct 17, 2025: 144 rigs total (Oil 97, Gas 46, Miscellaneous 1) Week to Oct 24, 2025: 143 rigs total (Oil 98, Gas 45, Miscellaneous 0) Week to Oct 31, 2025: 137 rigs total (Oil 91, Gas 46, Miscellaneous 0) Week to Nov 6, 2025: 142 rigs total (Oil 94, Gas 48, Miscellaneous 0) Week to Nov 14, 2025: 139 rigs total (Oil 90, Gas 49, Miscellaneous 0) Week to Nov 21, 2025: 145 rigs total (Oil 94, Gas 51, Miscellaneous 0) Week to Nov 26, 2025: 139 rigs total (Oil 88, Gas 51, Miscellaneous 0) Week to Dec 4, 2025: 139 rigs total (Oil 91, Gas 48, Miscellaneous 0) Week to Dec 12, 2025: 140 rigs total (Oil 90, Gas 50, Miscellaneous 0) Week to Dec 19, 2025: 139 rigs total (Oil 92, Gas 47, Miscellaneous 0) Week to Dec 24, 2025: 93 rigs total (Oil 47, Gas 46, Miscellaneous 0) Week to Dec 30, 2025: 84 rigs total (Oil 43, Gas 41, Miscellaneous 0) Week to Jan 9, 2026: 140 rigs total (Oil 88, Gas 52, Miscellaneous 0) Week to Jan 16, 2026: 160 rigs total (Oil 104, Gas 56, Miscellaneous 0) Week to Jan 23, 2026: 164 rigs total (Oil 110, Gas 54, Miscellaneous 0) Week to Jan 30, 2026: 168 rigs total (Oil 110, Gas 58, Miscellaneous 0) Week to Feb 6, 2026: 167 rigs total (Oil 109, Gas 57, Miscellaneous 1) Week to Feb 13, 2026: 167 rigs total (Oil 111, Gas 56, Miscellaneous 0) Week to Feb 20, 2026: 166 rigs total (Oil 110, Gas 56, Miscellaneous 0) Week to Feb 27, 2026: 156 rigs total (Oil 102, Gas 54, Miscellaneous 0) Week to Mar 6, 2026: 155 rigs total (Oil 103, Gas 51, Miscellaneous 1) Week to Mar 13, 2026: 151 rigs total (Oil 99, Gas 51, Miscellaneous 1) Week to Mar 20, 2026: 138 rigs total (Oil 89, Gas 49, Miscellaneous 0) Week to Mar 27, 2026: 123 rigs total (Oil 78, Gas 45, Miscellaneous 0) Week to Apr 2, 2026: 118 rigs total (Oil 75, Gas 43, Miscellaneous 0) Week to Apr 10, 2026: 112 rigs total (Oil 72, Gas 40, Miscellaneous 0) Week to Apr 17, 2026: 112 rigs total (Oil 70, Gas 42, Miscellaneous 0) Week to Apr 24, 2026: 112 rigs total (Oil 71, Gas 41, Miscellaneous 0) Week to May 1, 2026: 105 rigs total (Oil 68, Gas 37, Miscellaneous 0) Week to May 8, 2026: 108 rigs total (Oil 71, Gas 37, Miscellaneous 0) Week to May 15, 2026: 107 rigs total (Oil 69, Gas 38, Miscellaneous 0) Week to May 22, 2026: 112 rigs total (Oil 72, Gas 37, Miscellaneous 3) Week to May 29, 2026: 123 rigs total (Oil 81, Gas 42, Miscellaneous 0) Week to Jun 5, 2026: 125 rigs total (Oil 84, Gas 41, Miscellaneous 0) Week to Jun 12, 2026: 129 rigs total (Oil 84, Gas 45, Miscellaneous 0) Week to Jun 18, 2026: 135 rigs total (Oil 91, Gas 44, Miscellaneous 0) Week to Jun 26, 2026: 141 rigs total (Oil 97, Gas 44, Miscellaneous 0) Week to Jul 2, 2026: 138 rigs total (Oil 93, Gas 45, Miscellaneous 0) Week to Jul 10, 2026: 134 rigs total (Oil 87, Gas 45, Miscellaneous 2) Week to Jul 17, 2026: 150 rigs total (Oil 102, Gas 47, Miscellaneous 1) Week to Jul 24, 2026: 148 rigs total (Oil 99, Gas 47, Miscellaneous 2) Week to Jul 31, 2026: 164 rigs total (Oil 111, Gas 49, Miscellaneous 4) Week to Aug 7, 2026: 159 rigs total (Oil 106, Gas 49, Miscellaneous 4) Week to Aug 14, 2026: 164 rigs total (Oil 113, Gas 49, Miscellaneous 2) Week to Aug 21, 2026: 163 rigs total (Oil 111, Gas 50, Miscellaneous 2) Week to Aug 28, 2026: 158 rigs total (Oil 108, Gas 48, Miscellaneous 2) Week to Sep 4, 2026: 154 rigs total (Oil 106, Gas 46, Miscellaneous 2) Week to Sep 11, 2026: 151 rigs total (Oil 104, Gas 46, Miscellaneous 1)

Interactive chart. Focus it and use the left and right arrow keys to read each week, Page Up and Page Down to move a year, Home and End for the ends of the series. The full figures are also in the table below.

  • In Alberta, 151 drilling rigs were active in the week to September 11, 2026 (21 more than a year earlier).
  • Since Sep 2016, the weekly count peaked at 364 in Jan 2025.
  • The count covers land and inland-water rigs.
Average active rigs per month: full table
Month Oil-directedGas-directedMiscellaneousAll rigs
Sep 2026 (through September 11, 2026)104461151
Aug 2026108.848.42.4159.6
Jul 202699.8472.2149
Jun 202689.843.80133.6
May 202673.238.50.8112.5
Apr 202670.2400110.2
Mar 202688.847.80.4137
Feb 202610855.80.2164
Jan 2026103550158
Dec 202572.646.40119
Nov 202591.549.80141.2
Oct 202594.845.80.5141
Sep 202588450.8133.8
Aug 2025172.5801253.5
Jul 2025168.5710239.5
Jun 2025129.664.40194
May 202512060.50180.5
Apr 2025143.564.50208
Mar 2025197.683.20.8281.6
Feb 2025249.5990348.5
Jan 2025229.51000329.5
Dec 2024129.683.60213.2
Nov 2024185911277
Oct 2024215.5910306.5

Source: CommoVision (commovision.com)

Formations

One cross-section through the Western Canada Sedimentary Basin in Alberta.

Western Canada Sedimentary Basin
-6,000-4,000-2,00002,000ft TVDSSBattleMilk RiverColoradoCardiumBlackstoneSecond White SpecksVikingMannvilleGlauconiticOstracod020406080SSWNNEmiles along the line · dipping 40 ft/mi toward SSW (206°) · pale ribbon shows how certain each depth is
N2,518 producing wells (thinned)

10 formations along a 91-mile line, south-southwest to north-northeast.

Every depth drawn here is our own estimate, built from the curated formation tops of Alberta wells across the basin. The pale ribbon along each boundary shows how certain that depth is. Where the ribbon is wider, the depth is less certain.

How these sections are built

The section follows one straight line across the basin, and the map beside it shows where that line runs.

West is on the left.

The depth of each formation along the line is estimated from the depths at which Alberta wells across the basin met that formation, as picked well by well by the official source.

A formation is drawn where enough wells along the line place it and where it stands clear of the formation above or below.

What we cover here

Each row names the grain a region’s production is held at. Where a source publishes at a coarser grain, the page says so.

DataGrainSinceBenchmark
Alberta production project + well 1962-01

Coverage rows for Alberta are regenerated at every build from the same catalog of sources the data is built from.

What the data shows

  • Alberta produced 1.58 Bbbl of oil and 4.85 Tcf of natural gas in 2025.
  • Alberta oil production reached its highest level on record in 2025 at 1.58 Bbbl.
  • Alberta production combines conventional and in-situ well volumes with mined oil-sands (bitumen) plant output, which the official source reports at project grain.
  • 142,031 producing wells tracked, 12 months to Jul 2026.

Get early access

Watch supply move as soon as its sources publish, with forecasts on 1.1+ million producing wells. The portal, an API and MCP access for AI tools open on October 1, 2026.

Data use is subject to our Terms of Service.