CommoVision

See the future in real time

Operator

Cenovus Energy

Cenovus Energy produced 237.0 MMbbl of oil and 336.9 Bcf of natural gas in 2025. 6,398 operated producing wells tracked, trailing 12 months per region.

  • Third-largest operator by operated oil in Alberta, 2025.
  • Operated 12.1% of the oil produced in Alberta, 2025.
  • Oil production rose 6% in 2025 from 2024.
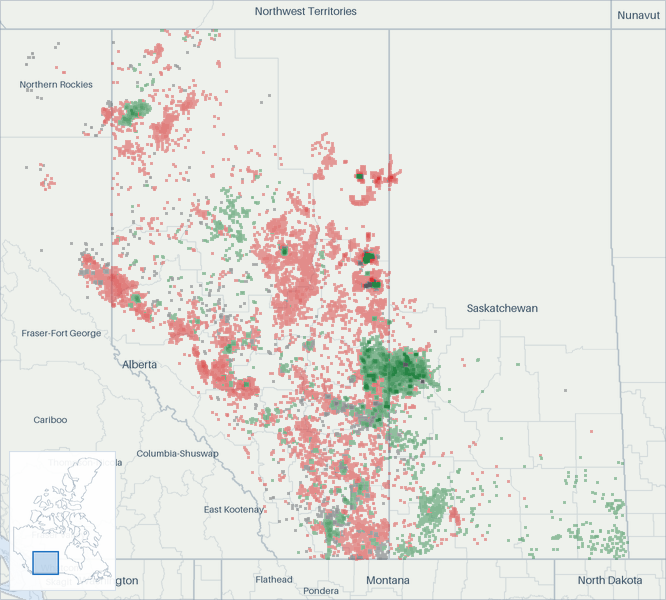
Well map of Cenovus Energy. The full map is further down this page.

Production

Cenovus Energy oil production (Mbbl/d, grouped by when each well first produced)
Cenovus Energy oil production: thousand barrels per day, by first-production vintage as filed so far today 2505007501,000 Mbbl/d 2017201820192020202120222023202420252026 Jul 2016: 295 Mbbl/d total Aug 2016: 323 Mbbl/d total Sep 2016: 306 Mbbl/d total Oct 2016: 307 Mbbl/d total Nov 2016: 346 Mbbl/d total Dec 2016: 357 Mbbl/d total Jan 2017: 356 Mbbl/d total Feb 2017: 358 Mbbl/d total Mar 2017: 368 Mbbl/d total Apr 2017: 359 Mbbl/d total May 2017: 331 Mbbl/d total Jun 2017: 356 Mbbl/d total Jul 2017: 352 Mbbl/d total Aug 2017: 333 Mbbl/d total Sep 2017: 298 Mbbl/d total Oct 2017: 314 Mbbl/d total Nov 2017: 317 Mbbl/d total Dec 2017: 301 Mbbl/d total Jan 2018: 294 Mbbl/d total Feb 2018: 291 Mbbl/d total Mar 2018: 271 Mbbl/d total Apr 2018: 298 Mbbl/d total May 2018: 299 Mbbl/d total Jun 2018: 289 Mbbl/d total Jul 2018: 296 Mbbl/d total Aug 2018: 439 Mbbl/d total Sep 2018: 448 Mbbl/d total Oct 2018: 408 Mbbl/d total Nov 2018: 352 Mbbl/d total Dec 2018: 388 Mbbl/d total Jan 2019: 375 Mbbl/d total Feb 2019: 387 Mbbl/d total Mar 2019: 386 Mbbl/d total Apr 2019: 396 Mbbl/d total May 2019: 378 Mbbl/d total Jun 2019: 409 Mbbl/d total Jul 2019: 402 Mbbl/d total Aug 2019: 421 Mbbl/d total Sep 2019: 438 Mbbl/d total Oct 2019: 441 Mbbl/d total Nov 2019: 433 Mbbl/d total Dec 2019: 466 Mbbl/d total Jan 2020: 450 Mbbl/d total Feb 2020: 463 Mbbl/d total Mar 2020: 453 Mbbl/d total Apr 2020: 392 Mbbl/d total May 2020: 418 Mbbl/d total Jun 2020: 464 Mbbl/d total Jul 2020: 456 Mbbl/d total Aug 2020: 451 Mbbl/d total Sep 2020: 419 Mbbl/d total Oct 2020: 434 Mbbl/d total Nov 2020: 452 Mbbl/d total Dec 2020: 447 Mbbl/d total Jan 2021: 505 Mbbl/d total Feb 2021: 504 Mbbl/d total Mar 2021: 517 Mbbl/d total Apr 2021: 519 Mbbl/d total May 2021: 504 Mbbl/d total Jun 2021: 470 Mbbl/d total Jul 2021: 520 Mbbl/d total Aug 2021: 567 Mbbl/d total Sep 2021: 559 Mbbl/d total Oct 2021: 568 Mbbl/d total Nov 2021: 562 Mbbl/d total Dec 2021: 573 Mbbl/d total Jan 2022: 666 Mbbl/d total Feb 2022: 659 Mbbl/d total Mar 2022: 631 Mbbl/d total Apr 2022: 617 Mbbl/d total May 2022: 581 Mbbl/d total Jun 2022: 625 Mbbl/d total Jul 2022: 637 Mbbl/d total Aug 2022: 600 Mbbl/d total Sep 2022: 628 Mbbl/d total Oct 2022: 641 Mbbl/d total Nov 2022: 634 Mbbl/d total Dec 2022: 622 Mbbl/d total Jan 2023: 614 Mbbl/d total Feb 2023: 613 Mbbl/d total Mar 2023: 596 Mbbl/d total Apr 2023: 545 Mbbl/d total May 2023: 594 Mbbl/d total Jun 2023: 613 Mbbl/d total Jul 2023: 616 Mbbl/d total Aug 2023: 625 Mbbl/d total Sep 2023: 622 Mbbl/d total Oct 2023: 619 Mbbl/d total Nov 2023: 637 Mbbl/d total Dec 2023: 636 Mbbl/d total Jan 2024: 615 Mbbl/d total Feb 2024: 627 Mbbl/d total Mar 2024: 614 Mbbl/d total Apr 2024: 614 Mbbl/d total May 2024: 605 Mbbl/d total Jun 2024: 624 Mbbl/d total Jul 2024: 627 Mbbl/d total Aug 2024: 618 Mbbl/d total Sep 2024: 520 Mbbl/d total Oct 2024: 632 Mbbl/d total Nov 2024: 634 Mbbl/d total Dec 2024: 626 Mbbl/d total Jan 2025: 630 Mbbl/d total Feb 2025: 624 Mbbl/d total Mar 2025: 629 Mbbl/d total Apr 2025: 607 Mbbl/d total May 2025: 579 Mbbl/d total Jun 2025: 595 Mbbl/d total Jul 2025: 675 Mbbl/d total Aug 2025: 656 Mbbl/d total Sep 2025: 631 Mbbl/d total Oct 2025: 674 Mbbl/d total Nov 2025: 683 Mbbl/d total Dec 2025: 803 Mbbl/d total Jan 2026: 785 Mbbl/d total Feb 2026: 790 Mbbl/d total Mar 2026: 794 Mbbl/d total Apr 2026: 808 Mbbl/d total May 2026: 816 Mbbl/d total Jun 2026: 772 Mbbl/d total Jul 2026: 859 Mbbl/d as filed so far. Filings for this month are still arriving. The chart shows what has been filed.

Still arriving: Aug 2026 <1% filed.

All from what the source published. 90.1% held at well grain.

How the volume breaks down
  • 90.1% Reported by the official source by well
  • 9.9% Reported by the official source as a lease, facility, field or state total. Published without per-well detail.

Every barrel here starts from what the official source published for the months measured. Measured over January 1962 to June 2026.

The gray “without per-well detail” band is volume the source reports above the well: fields, facilities, or leases the source publishes as one total. It is included so the stack still sums to the whole entity.

Cenovus Energy natural gas production (MMcf/d, grouped by when each well first produced)
Cenovus Energy natural gas production: million cubic feet per day, by first-production vintage as filed so far today 5001,0001,500 MMcf/d 2017201820192020202120222023202420252026 Jul 2016: 641 MMcf/d total Aug 2016: 680 MMcf/d total Sep 2016: 664 MMcf/d total Oct 2016: 677 MMcf/d total Nov 2016: 674 MMcf/d total Dec 2016: 680 MMcf/d total Jan 2017: 685 MMcf/d total Feb 2017: 692 MMcf/d total Mar 2017: 697 MMcf/d total Apr 2017: 690 MMcf/d total May 2017: 670 MMcf/d total Jun 2017: 681 MMcf/d total Jul 2017: 663 MMcf/d total Aug 2017: 665 MMcf/d total Sep 2017: 921 MMcf/d total Oct 2017: 984 MMcf/d total Nov 2017: 869 MMcf/d total Dec 2017: 792 MMcf/d total Jan 2018: 728 MMcf/d total Feb 2018: 773 MMcf/d total Mar 2018: 765 MMcf/d total Apr 2018: 795 MMcf/d total May 2018: 717 MMcf/d total Jun 2018: 710 MMcf/d total Jul 2018: 776 MMcf/d total Aug 2018: 801 MMcf/d total Sep 2018: 783 MMcf/d total Oct 2018: 756 MMcf/d total Nov 2018: 707 MMcf/d total Dec 2018: 663 MMcf/d total Jan 2019: 655 MMcf/d total Feb 2019: 624 MMcf/d total Mar 2019: 632 MMcf/d total Apr 2019: 618 MMcf/d total May 2019: 676 MMcf/d total Jun 2019: 586 MMcf/d total Jul 2019: 607 MMcf/d total Aug 2019: 607 MMcf/d total Sep 2019: 670 MMcf/d total Oct 2019: 692 MMcf/d total Nov 2019: 685 MMcf/d total Dec 2019: 723 MMcf/d total Jan 2020: 705 MMcf/d total Feb 2020: 726 MMcf/d total Mar 2020: 714 MMcf/d total Apr 2020: 707 MMcf/d total May 2020: 693 MMcf/d total Jun 2020: 701 MMcf/d total Jul 2020: 653 MMcf/d total Aug 2020: 647 MMcf/d total Sep 2020: 649 MMcf/d total Oct 2020: 667 MMcf/d total Nov 2020: 682 MMcf/d total Dec 2020: 673 MMcf/d total Jan 2021: 929 MMcf/d total Feb 2021: 895 MMcf/d total Mar 2021: 937 MMcf/d total Apr 2021: 952 MMcf/d total May 2021: 898 MMcf/d total Jun 2021: 930 MMcf/d total Jul 2021: 941 MMcf/d total Aug 2021: 958 MMcf/d total Sep 2021: 915 MMcf/d total Oct 2021: 869 MMcf/d total Nov 2021: 885 MMcf/d total Dec 2021: 900 MMcf/d total Jan 2022: 922 MMcf/d total Feb 2022: 910 MMcf/d total Mar 2022: 969 MMcf/d total Apr 2022: 1,015 MMcf/d total May 2022: 958 MMcf/d total Jun 2022: 946 MMcf/d total Jul 2022: 972 MMcf/d total Aug 2022: 885 MMcf/d total Sep 2022: 902 MMcf/d total Oct 2022: 951 MMcf/d total Nov 2022: 936 MMcf/d total Dec 2022: 901 MMcf/d total Jan 2023: 924 MMcf/d total Feb 2023: 925 MMcf/d total Mar 2023: 863 MMcf/d total Apr 2023: 816 MMcf/d total May 2023: 644 MMcf/d total Jun 2023: 768 MMcf/d total Jul 2023: 948 MMcf/d total Aug 2023: 941 MMcf/d total Sep 2023: 901 MMcf/d total Oct 2023: 885 MMcf/d total Nov 2023: 936 MMcf/d total Dec 2023: 927 MMcf/d total Jan 2024: 811 MMcf/d total Feb 2024: 819 MMcf/d total Mar 2024: 835 MMcf/d total Apr 2024: 862 MMcf/d total May 2024: 860 MMcf/d total Jun 2024: 857 MMcf/d total Jul 2024: 848 MMcf/d total Aug 2024: 858 MMcf/d total Sep 2024: 648 MMcf/d total Oct 2024: 832 MMcf/d total Nov 2024: 845 MMcf/d total Dec 2024: 875 MMcf/d total Jan 2025: 889 MMcf/d total Feb 2025: 883 MMcf/d total Mar 2025: 884 MMcf/d total Apr 2025: 872 MMcf/d total May 2025: 879 MMcf/d total Jun 2025: 889 MMcf/d total Jul 2025: 980 MMcf/d total Aug 2025: 976 MMcf/d total Sep 2025: 896 MMcf/d total Oct 2025: 973 MMcf/d total Nov 2025: 969 MMcf/d total Dec 2025: 978 MMcf/d total Jan 2026: 1,011 MMcf/d total Feb 2026: 1,007 MMcf/d total Mar 2026: 1,031 MMcf/d total Apr 2026: 997 MMcf/d total May 2026: 953 MMcf/d total Jun 2026: 909 MMcf/d total

Still arriving: Aug 2026 <1% filed.

All from what the source published. 96.4% held at well grain.

How the volume breaks down
  • 96.4% Reported by the official source by well
  • 3.6% Reported by the official source as a lease, facility, field or state total. Published without per-well detail.

Every cubic foot here starts from what the official source published for the months measured. Measured over January 1962 to June 2026.

The gray “without per-well detail” band is volume the source reports above the well: fields, facilities, or leases the source publishes as one total. It is included so the stack still sums to the whole entity.

The bands group wells by when they first produced.

About this chart

The stack shows what is holding today's rate up and how much of it is new drilling. The bands draw the filings already in. Wells that had already been drilled when our production record for this area opens are grouped by the year they were drilled rather than the year they first produced: 1% of the volume shown. Their true first production is earlier than our data can see.

These volumes are the production from the wells and facilities this company operates. Ownership works differently: other parties hold interests in these wells, and this company holds interests in wells that other companies operate. How we attribute production to a company

Annual table (full history)

best estimate incl. unsplit totals

YearOil (MMbbl)Gas produced (Bcf)
2025237.0337
2024224.4304
2023223.0319
2022229.3343
2021193.8335
2020161.6251
2019150.0237
2018124.0273
2017122.9274
2016116.3255
2015116.8278
2014118.4275
2013103.2285
201289.2307
201182.3340
201071.9364
200960.5281
200865.5317
200770.6348
200654.9360
200523.1380
200421.3387
200318.5384
200215.5393
200112.5390
200012.6395
199911.3407
199812.0381
199712.5374
199612.3364
199512.6365
199412.1354
199313.0334
199213.8317
199114.0281
199014.0268
198913.3247
198812.4239
198712.2195
198610.7188
198510.7194
198410.1182
19839.7180
198210.4177
198111.0158
198012.8137
197914.2123
197815.196
197715.994
197616.481
197515.882
197418.883
197320.563
197218.659
197116.559
197014.653
19699.841
19688.421
19676.920
19662.011
19651.17
19641.05
19630.74
19620.65

Source: CommoVision (commovision.com)

Monthly table (last 24 months)
MonthOil (Mbbl)Gas produced (MMcf)
2026-0726,622.129,922
2026-0623,165.027,258
2026-0525,288.029,532
2026-0424,254.429,915
2026-0324,620.131,946
2026-0222,115.528,191
2026-0124,340.531,332
2025-1224,891.130,327
2025-1120,496.629,078
2025-1020,906.630,176
2025-0918,925.726,884
2025-0820,328.430,270
2025-0720,934.830,392
2025-0617,839.326,662
2025-0517,961.327,249
2025-0418,203.726,153
2025-0319,494.827,399
2025-0217,471.424,715
2025-0119,533.827,573
2024-1219,397.127,119
2024-1119,025.725,365
2024-1019,593.425,791
2024-0915,602.919,445
2024-0819,166.926,597

Source: CommoVision (commovision.com)

Source: CommoVision · Cenovus Energy, data through June 2026.

Well map

A map of 54,634 well locations operated by Cenovus Energy for which CommoVision holds a published surface coordinate, each drawn where it is and colored by its primary product (green for oil, red for natural gas, gray where undetermined; a spot shared by more than one product shows the one with the most wells there), on a ground of land and water over faint state, province, county and census-division outlines and place names for orientation, with a small inset map locating this frame in Canada.
  • Oil 24,875
  • Natural gas 21,284
  • Undetermined 8,475
54,634 well locations operated by Cenovus Energy, colored by primary product.
About this map

Undetermined means not enough signal to settle it. Producing wells are the ones that reported oil or gas in the trailing 12 months per region.

772.2 Mbbl/d Jun 2026 oil production +29.9% vs Jun last year best estimate incl. unsplit totals
908.9 MMcf/d (est.) Jun 2026 gas production Jun 2026 is still filling in. The figure is the filings already in plus an estimate of the part not yet filed. The change compares this estimate with the same month last year. +2.3% vs Jun last year best estimate incl. unsplit totals
649.3 Mbbl/d 2025 oil production best estimate incl. unsplit totals
923 MMcf/d 2025 gas production best estimate incl. unsplit totals
6,398 wells Operated producing wells tracked trailing 12 months per region

Type curves

Cenovus Energy oil type curves (bbl/d per well, log scale, against months on production; cohorts 2010–2026)
Cenovus Energy oil type curves: average barrels per day per well on a log scale against months on production 2010-2014: 1,139 wells; starts at 81.2 bbl/d per well, 483 Mbbl cumulative through month 140 (100% of its wells old enough at that month); the dashed curve runs through month 200, on our forecast where a well’s own record ends2015: 185 wells; starts at 116 bbl/d per well, 1,087 Mbbl cumulative through month 128 (100% of its wells old enough at that month); the dashed curve runs through month 188, on our forecast where a well’s own record ends2016: 182 wells; starts at 219 bbl/d per well, 1,326 Mbbl cumulative through month 116 (100% of its wells old enough at that month); the dashed curve runs through month 176, on our forecast where a well’s own record ends2017: 242 wells; starts at 179 bbl/d per well, 871 Mbbl cumulative through month 104 (100% of its wells old enough at that month); the dashed curve runs through month 164, on our forecast where a well’s own record ends2018: 169 wells; starts at 193 bbl/d per well, 865 Mbbl cumulative through month 92 (100% of its wells old enough at that month); the dashed curve runs through month 152, on our forecast where a well’s own record ends2019: 160 wells; starts at 314 bbl/d per well, 1,131 Mbbl cumulative through month 80 (100% of its wells old enough at that month); the dashed curve runs through month 140, on our forecast where a well’s own record ends2020: 92 wells; starts at 254 bbl/d per well, 1,784 Mbbl cumulative through month 68 (100% of its wells old enough at that month); the dashed curve runs through month 128, on our forecast where a well’s own record ends2021: 195 wells; starts at 299 bbl/d per well, 1,034 Mbbl cumulative through month 56 (100% of its wells old enough at that month); the dashed curve runs through month 116, on our forecast where a well’s own record ends2022: 175 wells; starts at 311 bbl/d per well, 639 Mbbl cumulative through month 44 (100% of its wells old enough at that month); the dashed curve runs through month 104, on our forecast where a well’s own record ends2023: 210 wells; starts at 290 bbl/d per well, 497 Mbbl cumulative through month 32 (100% of its wells old enough at that month); the dashed curve runs through month 92, on our forecast where a well’s own record ends2024: 276 wells; starts at 255 bbl/d per well, 333 Mbbl cumulative through month 20 (100% of its wells old enough at that month); the dashed curve runs through month 80, on our forecast where a well’s own record ends2025: 252 wells; starts at 253 bbl/d per well, 147 Mbbl cumulative through month 8 (100% of its wells old enough at that month); the dashed curve runs through month 68, on our forecast where a well’s own record ends2026: 124 wells; starts at 365 bbl/d per well, 11.1 Mbbl cumulative through month 1 (100% of its wells old enough at that month); the dashed curve runs through month 61, on our forecast where a well’s own record ends351020501002005001,0001,500bbl/d24487296120144168192216Months on production
Cenovus Energy natural gas type curves (Mcf/d per well, log scale, against months on production; cohorts 2010–2026)
Cenovus Energy natural gas type curves: average thousand cubic feet per day per well on a log scale against months on production 2010-2014: 1,139 wells; starts at 244 Mcf/d per well, 0.6 Bcf cumulative through month 140 (100% of its wells old enough at that month); the dashed curve runs through month 200, on our forecast where a well’s own record ends2015: 185 wells; starts at 326 Mcf/d per well, 0.9 Bcf cumulative through month 128 (100% of its wells old enough at that month); the dashed curve runs through month 188, on our forecast where a well’s own record ends2016: 182 wells; starts at 109 Mcf/d per well, 0.6 Bcf cumulative through month 116 (100% of its wells old enough at that month); the dashed curve runs through month 176, on our forecast where a well’s own record ends2017: 242 wells; starts at 379 Mcf/d per well, 0.7 Bcf cumulative through month 104 (100% of its wells old enough at that month); the dashed curve runs through month 164, on our forecast where a well’s own record ends2018: 169 wells; starts at 385 Mcf/d per well, 1.1 Bcf cumulative through month 92 (100% of its wells old enough at that month); the dashed curve runs through month 152, on our forecast where a well’s own record ends2019: 160 wells; starts at 179 Mcf/d per well, 0.6 Bcf cumulative through month 80 (100% of its wells old enough at that month); the dashed curve runs through month 140, on our forecast where a well’s own record ends2020: 92 wells; starts at 311 Mcf/d per well, 0.8 Bcf cumulative through month 68 (100% of its wells old enough at that month); the dashed curve runs through month 128, on our forecast where a well’s own record ends2021: 195 wells; starts at 105 Mcf/d per well, 0.6 Bcf cumulative through month 56 (100% of its wells old enough at that month); the dashed curve runs through month 116, on our forecast where a well’s own record ends2022: 175 wells; starts at 201 Mcf/d per well, 0.6 Bcf cumulative through month 44 (100% of its wells old enough at that month); the dashed curve runs through month 104, on our forecast where a well’s own record ends2023: 210 wells; starts at 295 Mcf/d per well, 0.5 Bcf cumulative through month 32 (100% of its wells old enough at that month); the dashed curve runs through month 92, on our forecast where a well’s own record ends2024: 276 wells; starts at 264 Mcf/d per well, 0.3 Bcf cumulative through month 20 (100% of its wells old enough at that month); the dashed curve runs through month 80, on our forecast where a well’s own record ends2025: 252 wells; starts at 211 Mcf/d per well, 0.2 Bcf cumulative through month 8 (100% of its wells old enough at that month); the dashed curve runs through month 68, on our forecast where a well’s own record ends2026: 124 wells; starts at 189 Mcf/d per well, 0.0 Bcf cumulative through month 1 (100% of its wells old enough at that month); the dashed curve runs through month 61, on our forecast where a well’s own record ends20501002005001,0001,500Mcf/d24487296120144168192216Months on production

Horizontal wells only. Average production per well, for wells grouped by when they first produced.

How these curves are built

Horizontal wells only: 3,401 of the 4,943 wells in these cohorts. Average daily production per well, for wells grouped by when they first produced. Includes every well of the cohort that is old enough at each month. Wells that are shut in or have stopped producing count as zero, so the average reflects the full cohort, not just survivors. Rates are calendar-day (volume ÷ days in month). The cumulative axis accumulates those same monthly averages at the average month length. Months not yet fully reported are excluded. The 2010-2014 curve draws those years as one group. The chart opens on average daily rate against months on production, the rate on a log scale. The view control switches to rate against cumulative production per well, on the same log rate scale, or to cumulative production per well against months on production, on a linear scale. Every view draws the same cohorts from the same production history. Each cohort is solid through the last month all of its wells sit inside fully reported data. Past it the dashed curve carries the same wells forward, on our forecast where a well’s own record ends, for up to five years. A dashed curve runs as far as at least nine in ten of its wells are accounted for. A well that is old enough but shut in still counts, as zero. The measured months are what these wells reported. In the forward months each well counts its own reported figure for each month it has one, our forecast for each month it has only that, and zero for the rest. The forward average counts every well of the cohort. The drawn forecast runs up to five years past the measured months. Line thickness tracks the size of each cohort.

Cohort summary table
First produced Wells Peak oil (bbl/d per well) Month-12 oil (bbl/d per well) Cum oil in series (Mbbl per well) Peak gas (Mcf/d per well) Month-12 gas (Mcf/d per well) Cum gas in series (Bcf per well) Months in series Wells old enough at last month in series Forecast months drawn
2026 124 365 11.1 189 0.0 1 100% 60
2025 252 724 147 751 0.2 8 100% 60
2024 276 593 531 333 712 424 0.3 20 100% 60
2023 210 607 559 497 786 628 0.5 32 100% 60
2022 175 665 599 639 943 616 0.6 44 100% 60
2021 195 832 756 1,034 604 464 0.6 56 100% 60
2020 92 1,230 1,223 1,784 602 501 0.8 68 100% 60
2019 160 709 655 1,131 450 321 0.6 80 100% 60
2018 169 499 478 865 1,129 822 1.1 92 100% 60
2017 242 629 585 871 709 520 0.7 104 100% 60
2016 182 846 787 1,326 484 302 0.6 116 100% 60
2015 185 533 498 1,087 866 656 0.9 128 100% 60
2010-2014 1,139 291 283 483 481 330 0.6 140 100% 60

Source: CommoVision (commovision.com)

Source: CommoVision · Cenovus Energy type curves, per-well production by first-production cohort.

Recent permitting

686 permits approved in the 365 days to September 11, 2026
119 permits in the 90 days to September 11, 2026
119 new-well permits in the 90 days to September 11, 2026
September 11, 2026 latest approval on record
About this chart

Approvals of every permit type per month, the 24 months to Sep 2026. The last bar is Sep 2026 through September 11, 2026 (8 so far), drawn hatched. All 686 approved in the 365 days to September 11, 2026 are permits to drill a new well. Permits to drill a new well: 686 in the 365 days to September 11, 2026 and 119 in the last 90 days of that window. How permits are counted.

  • Cenovus Energy was granted 686 well permits in the 365 days to September 11, 2026. Of those, 119 came in the last 90 days of that window. The latest approval on record is dated September 11, 2026.
  • All 686 approved in the 365 days to September 11, 2026 are permits to drill a new well. Permits to drill a new well: 686 in the 365 days to September 11, 2026 and 119 in the last 90 days of that window.
  • Permits counted here come from Alberta and British Columbia.
  • Saskatchewan reaches this page through production data alone.
Well permits approved per month: full table
MonthPermits approved
Sep 2026 (through September 11, 2026)8
Aug 202653
Jul 202610
Jun 202655
May 202633
Apr 202647
Mar 202659
Feb 202627
Jan 202617
Dec 202579
Nov 2025244
Oct 202538
Sep 202530
Aug 202511
Jul 202519
Jun 202558
May 202535
Apr 202541
Mar 202525
Feb 202538
Jan 202564
Dec 202421
Nov 2024246
Oct 202411

Source: CommoVision (commovision.com)

What we cover here

Each row names the grain a region’s production is held at. Where a source publishes at a coarser grain, the page says so.

DataGrainSinceBenchmark
Alberta production project + well 1962-01
British Columbia production well 1954-06
Saskatchewan production well 2022-01
Newfoundland & Labrador Offshore production field 2002-01

Coverage rows for Cenovus Energy are regenerated at every build from the same catalog of sources the data is built from.

Top regions by 2025 operated production best estimate incl. unsplit totals

RegionOil (MMbbl)Gas produced (Bcf)Share of 2025 output
Alberta191282.780.9%
Saskatchewan42.714.716.8%
Newfoundland & Labrador Offshore3.325.81.9%
British Columbia013.70.4%

Share of output counts oil and gas together, gas at its market-value weight.

What the data shows

  • Cenovus Energy produced 237.0 MMbbl of oil and 336.9 Bcf of natural gas in 2025.
  • Cenovus Energy oil production reached its highest level on record in 2025 at 237.0 MMbbl.
  • Cenovus Energy operated production across 4 reporting regions in 1 country (Canada) in our coverage.
  • 6,398 operated producing wells tracked, trailing 12 months per region.

Get early access

Watch supply move as soon as its sources publish, with forecasts on 1.1+ million producing wells. The portal, an API and MCP access for AI tools open on October 1, 2026.

Data use is subject to our Terms of Service.