CommoVision

See the future in real time

Supply area

Noroeste

The Noroeste footprint produced 1.1 MMbbl of oil and 39.6 Bcf of natural gas in 2025. 62 producing wells tracked, trailing 12 months per region.

  • Natural gas production fell 9% in 2025 from 2024.
Production data through July 2026 · well counts as of 2026-07

A supply area is the producing region we roll every well up to, and the level supply is traded at: how each area is drawn.

Well map of Noroeste. The full map is further down this page.

Production

Noroeste natural gas production (MMcf/d, grouped by when each well first produced)
Noroeste natural gas production: million cubic feet per day, by first-production vintage as filed so far today 100200300 MMcf/d 2017201820192020202120222023202420252026 Aug 2016: 257 MMcf/d total Sep 2016: 253 MMcf/d total Oct 2016: 249 MMcf/d total Nov 2016: 248 MMcf/d total Dec 2016: 244 MMcf/d total Jan 2017: 245 MMcf/d total Feb 2017: 244 MMcf/d total Mar 2017: 241 MMcf/d total Apr 2017: 239 MMcf/d total May 2017: 237 MMcf/d total Jun 2017: 233 MMcf/d total Jul 2017: 231 MMcf/d total Aug 2017: 228 MMcf/d total Sep 2017: 225 MMcf/d total Oct 2017: 224 MMcf/d total Nov 2017: 221 MMcf/d total Dec 2017: 220 MMcf/d total Jan 2018: 218 MMcf/d total Feb 2018: 209 MMcf/d total Mar 2018: 204 MMcf/d total Apr 2018: 198 MMcf/d total May 2018: 207 MMcf/d total Jun 2018: 207 MMcf/d total Jul 2018: 207 MMcf/d total Aug 2018: 207 MMcf/d total Sep 2018: 203 MMcf/d total Oct 2018: 200 MMcf/d total Nov 2018: 197 MMcf/d total Dec 2018: 191 MMcf/d total Jan 2019: 186 MMcf/d total Feb 2019: 182 MMcf/d total Mar 2019: 180 MMcf/d total Apr 2019: 182 MMcf/d total May 2019: 180 MMcf/d total Jun 2019: 180 MMcf/d total Jul 2019: 176 MMcf/d total Aug 2019: 175 MMcf/d total Sep 2019: 174 MMcf/d total Oct 2019: 176 MMcf/d total Nov 2019: 175 MMcf/d total Dec 2019: 174 MMcf/d total Jan 2020: 173 MMcf/d total Feb 2020: 169 MMcf/d total Mar 2020: 170 MMcf/d total Apr 2020: 167 MMcf/d total May 2020: 165 MMcf/d total Jun 2020: 163 MMcf/d total Jul 2020: 163 MMcf/d total Aug 2020: 159 MMcf/d total Sep 2020: 163 MMcf/d total Oct 2020: 164 MMcf/d total Nov 2020: 160 MMcf/d total Dec 2020: 156 MMcf/d total Jan 2021: 156 MMcf/d total Feb 2021: 155 MMcf/d total Mar 2021: 155 MMcf/d total Apr 2021: 152 MMcf/d total May 2021: 151 MMcf/d total Jun 2021: 150 MMcf/d total Jul 2021: 149 MMcf/d total Aug 2021: 147 MMcf/d total Sep 2021: 147 MMcf/d total Oct 2021: 143 MMcf/d total Nov 2021: 143 MMcf/d total Dec 2021: 142 MMcf/d total Jan 2022: 139 MMcf/d total Feb 2022: 140 MMcf/d total Mar 2022: 139 MMcf/d total Apr 2022: 137 MMcf/d total May 2022: 136 MMcf/d total Jun 2022: 135 MMcf/d total Jul 2022: 135 MMcf/d total Aug 2022: 135 MMcf/d total Sep 2022: 135 MMcf/d total Oct 2022: 134 MMcf/d total Nov 2022: 132 MMcf/d total Dec 2022: 131 MMcf/d total Jan 2023: 131 MMcf/d total Feb 2023: 130 MMcf/d total Mar 2023: 128 MMcf/d total Apr 2023: 128 MMcf/d total May 2023: 127 MMcf/d total Jun 2023: 127 MMcf/d total Jul 2023: 126 MMcf/d total Aug 2023: 125 MMcf/d total Sep 2023: 124 MMcf/d total Oct 2023: 123 MMcf/d total Nov 2023: 122 MMcf/d total Dec 2023: 122 MMcf/d total Jan 2024: 121 MMcf/d total Feb 2024: 120 MMcf/d total Mar 2024: 120 MMcf/d total Apr 2024: 119 MMcf/d total May 2024: 119 MMcf/d total Jun 2024: 118 MMcf/d total Jul 2024: 118 MMcf/d total Aug 2024: 119 MMcf/d total Sep 2024: 119 MMcf/d total Oct 2024: 120 MMcf/d total Nov 2024: 119 MMcf/d total Dec 2024: 119 MMcf/d total Jan 2025: 116 MMcf/d total Feb 2025: 116 MMcf/d total Mar 2025: 116 MMcf/d total Apr 2025: 117 MMcf/d total May 2025: 113 MMcf/d total Jun 2025: 110 MMcf/d total Jul 2025: 109 MMcf/d total Aug 2025: 106 MMcf/d total Sep 2025: 104 MMcf/d total Oct 2025: 101 MMcf/d total Nov 2025: 98.3 MMcf/d total Dec 2025: 96.8 MMcf/d total Jan 2026: 96.3 MMcf/d total Feb 2026: 96.1 MMcf/d total Mar 2026: 95.4 MMcf/d total Apr 2026: 94.8 MMcf/d total May 2026: 94.4 MMcf/d total Jun 2026: 94.1 MMcf/d total Jul 2026: 93.6 MMcf/d total Aug 2026: 0.58 MMcf/d as filed so far. Filings for this month are still arriving. The chart shows what has been filed.

All from what the source published. All held at well grain.

How the volume breaks down
  • 100% Reported by the official source by well

Every cubic foot here starts from what the official source published for the months measured. Measured over January 2006 to July 2026.

Noroeste oil production (Mbbl/d, grouped by when each well first produced)
Noroeste oil production: thousand barrels per day, by first-production vintage as filed so far today 2468 Mbbl/d 2017201820192020202120222023202420252026 Aug 2016: 7.02 Mbbl/d total Sep 2016: 6.97 Mbbl/d total Oct 2016: 7.13 Mbbl/d total Nov 2016: 7.11 Mbbl/d total Dec 2016: 7.18 Mbbl/d total Jan 2017: 6.97 Mbbl/d total Feb 2017: 7.1 Mbbl/d total Mar 2017: 7.17 Mbbl/d total Apr 2017: 7.24 Mbbl/d total May 2017: 6.98 Mbbl/d total Jun 2017: 6.84 Mbbl/d total Jul 2017: 6.68 Mbbl/d total Aug 2017: 6.64 Mbbl/d total Sep 2017: 6.43 Mbbl/d total Oct 2017: 6.36 Mbbl/d total Nov 2017: 6.07 Mbbl/d total Dec 2017: 6.11 Mbbl/d total Jan 2018: 6.15 Mbbl/d total Feb 2018: 5.9 Mbbl/d total Mar 2018: 5.68 Mbbl/d total Apr 2018: 5.69 Mbbl/d total May 2018: 5.96 Mbbl/d total Jun 2018: 5.74 Mbbl/d total Jul 2018: 5.8 Mbbl/d total Aug 2018: 5.87 Mbbl/d total Sep 2018: 5.55 Mbbl/d total Oct 2018: 5.34 Mbbl/d total Nov 2018: 5.49 Mbbl/d total Dec 2018: 5.28 Mbbl/d total Jan 2019: 5.61 Mbbl/d total Feb 2019: 6.18 Mbbl/d total Mar 2019: 6.03 Mbbl/d total Apr 2019: 5.02 Mbbl/d total May 2019: 4.79 Mbbl/d total Jun 2019: 4.96 Mbbl/d total Jul 2019: 4.84 Mbbl/d total Aug 2019: 4.79 Mbbl/d total Sep 2019: 4.97 Mbbl/d total Oct 2019: 4.92 Mbbl/d total Nov 2019: 5.5 Mbbl/d total Dec 2019: 5.31 Mbbl/d total Jan 2020: 5.3 Mbbl/d total Feb 2020: 5.19 Mbbl/d total Mar 2020: 5.96 Mbbl/d total Apr 2020: 5.32 Mbbl/d total May 2020: 4.92 Mbbl/d total Jun 2020: 4.78 Mbbl/d total Jul 2020: 4.96 Mbbl/d total Aug 2020: 5.08 Mbbl/d total Sep 2020: 5.47 Mbbl/d total Oct 2020: 5.4 Mbbl/d total Nov 2020: 5.04 Mbbl/d total Dec 2020: 4.94 Mbbl/d total Jan 2021: 4.16 Mbbl/d total Feb 2021: 4.58 Mbbl/d total Mar 2021: 4.68 Mbbl/d total Apr 2021: 4.83 Mbbl/d total May 2021: 4.44 Mbbl/d total Jun 2021: 4.34 Mbbl/d total Jul 2021: 4.4 Mbbl/d total Aug 2021: 4.54 Mbbl/d total Sep 2021: 4.58 Mbbl/d total Oct 2021: 4.57 Mbbl/d total Nov 2021: 4.59 Mbbl/d total Dec 2021: 4.46 Mbbl/d total Jan 2022: 4.37 Mbbl/d total Feb 2022: 4.55 Mbbl/d total Mar 2022: 4.69 Mbbl/d total Apr 2022: 4.64 Mbbl/d total May 2022: 4.76 Mbbl/d total Jun 2022: 4.8 Mbbl/d total Jul 2022: 4.86 Mbbl/d total Aug 2022: 4.91 Mbbl/d total Sep 2022: 5.03 Mbbl/d total Oct 2022: 5.08 Mbbl/d total Nov 2022: 5.04 Mbbl/d total Dec 2022: 5.15 Mbbl/d total Jan 2023: 5.33 Mbbl/d total Feb 2023: 5.15 Mbbl/d total Mar 2023: 5.09 Mbbl/d total Apr 2023: 5.05 Mbbl/d total May 2023: 5.02 Mbbl/d total Jun 2023: 4.97 Mbbl/d total Jul 2023: 4.84 Mbbl/d total Aug 2023: 4.75 Mbbl/d total Sep 2023: 4.7 Mbbl/d total Oct 2023: 4.29 Mbbl/d total Nov 2023: 4.54 Mbbl/d total Dec 2023: 4.29 Mbbl/d total Jan 2024: 4.03 Mbbl/d total Feb 2024: 3.39 Mbbl/d total Mar 2024: 3.71 Mbbl/d total Apr 2024: 3.92 Mbbl/d total May 2024: 3.74 Mbbl/d total Jun 2024: 3.53 Mbbl/d total Jul 2024: 3.53 Mbbl/d total Aug 2024: 3.49 Mbbl/d total Sep 2024: 3.46 Mbbl/d total Oct 2024: 3.35 Mbbl/d total Nov 2024: 3.44 Mbbl/d total Dec 2024: 3.44 Mbbl/d total Jan 2025: 3.33 Mbbl/d total Feb 2025: 3.25 Mbbl/d total Mar 2025: 3.26 Mbbl/d total Apr 2025: 3.28 Mbbl/d total May 2025: 3.08 Mbbl/d total Jun 2025: 2.98 Mbbl/d total Jul 2025: 2.98 Mbbl/d total Aug 2025: 2.78 Mbbl/d total Sep 2025: 2.73 Mbbl/d total Oct 2025: 2.67 Mbbl/d total Nov 2025: 2.59 Mbbl/d total Dec 2025: 2.61 Mbbl/d total Jan 2026: 2.53 Mbbl/d total Feb 2026: 2.59 Mbbl/d total Mar 2026: 2.6 Mbbl/d total Apr 2026: 2.48 Mbbl/d total May 2026: 2.59 Mbbl/d total Jun 2026: 2.71 Mbbl/d total Jul 2026: 2.72 Mbbl/d total Aug 2026: 0.81 Mbbl/d as filed so far. Filings for this month are still arriving. The chart shows what has been filed.

All from what the source published. All held at well grain.

How the volume breaks down
  • 100% Reported by the official source by well

Every barrel here starts from what the official source published for the months measured. Measured over January 2006 to July 2026.

The bands group wells by when they first produced.

About this chart

The stack shows what is holding today's rate up and how much of it is new drilling. The bands draw the filings already in.

Annual table (full history)
YearOil (MMbbl)Gas produced (Bcf)
20251.140
20241.344
20231.846
20221.850
20211.654
20201.960
20191.965
20182.174
20172.585
20162.794
20152.999
20142.9102
20133.2115
20123.6136
20113.7163
20104.3191
20094.9222
20085.3243
20075.1234
20065.3249

Source: CommoVision (commovision.com)

Monthly table (last 24 months)
MonthOil (Mbbl)Gas produced (MMcf)
2026-0784.32,900
2026-0681.22,822
2026-0580.42,926
2026-0474.42,843
2026-0380.52,958
2026-0272.42,691
2026-0178.32,986
2025-1280.93,000
2025-1177.72,949
2025-1082.83,135
2025-0981.93,118
2025-0886.23,294
2025-0792.23,366
2025-0689.43,313
2025-0595.53,508
2025-0498.33,509
2025-03100.93,606
2025-0291.13,252
2025-01103.33,596
2024-12106.53,675
2024-11103.23,576
2024-10103.93,730
2024-09103.83,564
2024-08108.13,688

Source: CommoVision (commovision.com)

Source: CommoVision · Noroeste, data through July 2026.

Well map

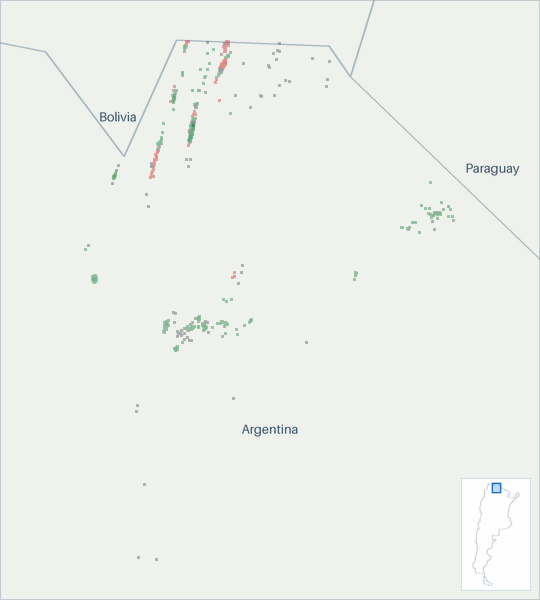
A map of 895 well locations inside the Noroeste footprint for which CommoVision holds a published surface coordinate, each drawn where it is and colored by its primary product (green for oil, red for natural gas, gray where undetermined; a spot shared by more than one product shows the one with the most wells there), on a ground of land and water over faint country outlines and place names for orientation, with a small inset map locating this frame in Argentina.
  • Oil 471
  • Natural gas 142
  • Undetermined 282
895 well locations inside the Noroeste footprint, colored by primary product. 71 more wells we track here sit outside this frame: their source publishes no coordinate, or their location falls beyond its edges.
About this map

Undetermined means not enough signal to settle it. Producing wells are the ones that reported oil or gas in the trailing 12 months per region.

Type curves

Noroeste natural gas type curves (Mcf/d per well, log scale, against months on production; cohorts 2010–2022)
Noroeste natural gas type curves: average thousand cubic feet per day per well on a log scale against months on production 2010-2014: 22 wells; starts at 839 Mcf/d per well, 6.3 Bcf cumulative through month 140 (100% of its wells old enough at that month); the dashed curve runs through month 171, on our forecast where a well’s own record ends2015: 3 wells; starts at 4,887 Mcf/d per well, 14.8 Bcf cumulative through month 132 (100% of its wells old enough at that month); the dashed curve runs through month 137, on our forecast where a well’s own record ends2016: 6 wells; starts at 1.2 Mcf/d per well, 0.0 Bcf cumulative through month 72 (100% of its wells old enough at that month)2017: 4 wells; starts at 2.6 Mcf/d per well, 0.0 Bcf cumulative through month 85 (100% of its wells old enough at that month)2018: 3 wells; starts at 2,428 Mcf/d per well, 4.4 Bcf cumulative through month 92 (100% of its wells old enough at that month); the dashed curve runs through month 152, on our forecast where a well’s own record ends2022: 3 wells; starts at 74.6 Mcf/d per well, 0.0 Bcf cumulative through month 42 (100% of its wells old enough at that month)0.11101001,00010,000Mcf/d24487296120144168192Months on production
Noroeste oil type curves (bbl/d per well, log scale, against months on production; cohorts 2010–2022)
Noroeste oil type curves: average barrels per day per well on a log scale against months on production 2010-2014: 22 wells; starts at 39 bbl/d per well, 298 Mbbl cumulative through month 140 (100% of its wells old enough at that month); the dashed curve runs through month 171, on our forecast where a well’s own record ends2015: 3 wells; starts at 179 bbl/d per well, 489 Mbbl cumulative through month 132 (100% of its wells old enough at that month); the dashed curve runs through month 137, on our forecast where a well’s own record ends2016: 6 wells; starts at 5.8 bbl/d per well, 8.2 Mbbl cumulative through month 72 (100% of its wells old enough at that month)2017: 4 wells; starts at 2.9 bbl/d per well, 21.0 Mbbl cumulative through month 85 (100% of its wells old enough at that month)2018: 3 wells; starts at 53.8 bbl/d per well, 644 Mbbl cumulative through month 92 (100% of its wells old enough at that month); the dashed curve runs through month 152, on our forecast where a well’s own record ends2022: 3 wells; starts at 79.5 bbl/d per well, 68.3 Mbbl cumulative through month 42 (100% of its wells old enough at that month)0.1110100700bbl/d24487296120144168192Months on production

Average production per well, for wells grouped by when they first produced.

How these curves are built

Average daily production per well, for wells grouped by when they first produced. Includes every well of the cohort that is old enough at each month. Wells that are shut in or have stopped producing count as zero, so the average reflects the full cohort, not just survivors. Rates are calendar-day (volume ÷ days in month). The cumulative axis accumulates those same monthly averages at the average month length. Months not yet fully reported are excluded. The 2010-2014 curve draws those years as one group. The chart opens on average daily rate against months on production, the rate on a log scale. The view control switches to rate against cumulative production per well, on the same log rate scale, or to cumulative production per well against months on production, on a linear scale. Every view draws the same cohorts from the same production history. Each cohort with a dashed curve is solid through the last month all of its wells sit inside fully reported data. Past it the dashed curve carries the same wells forward, on our forecast where a well’s own record ends, for up to five years. A dashed curve runs as far as at least nine in ten of its wells are accounted for. A cohort with no dashed curve is drawn only through the months where at least 30% of its wells are old enough for the month to be fully reported. A well that is old enough but shut in still counts, as zero. The measured months are what these wells reported. In the forward months each well counts its own reported figure for each month it has one, our forecast for each month it has only that, and zero for the rest. The forward average counts every well of the cohort. The drawn forecast runs up to five years past the measured months. Line thickness tracks how many wells each curve is drawn from. 147 wells are counted here but not shown on the age axis: they started producing in 2008 or earlier, too close to the start of our records for their region to verify their true age.

Cohort summary table
First produced Wells Peak oil (bbl/d per well) Month-12 oil (bbl/d per well) Cum oil in series (Mbbl per well) Peak gas (Mcf/d per well) Month-12 gas (Mcf/d per well) Cum gas in series (Bcf per well) Months in series Wells old enough at last month in series Forecast months drawn
2022 3 91.8 79.2 68.3 74.6 38.7 0.0 50 100%
2018 3 532 326 644 3,013 2,371 4.4 92 100% 60
2017 4 15.1 13.8 21.0 4.8 3.1 0.0 110 75%
2016 6 25.7 0 8.2 1.6 0 0.0 121 67%
2015 3 321 266 489 9,900 6,954 14.8 132 100% 5
2010-2014 22 174 161 298 2,199 2,158 6.3 140 100% 31

Source: CommoVision (commovision.com)

Source: CommoVision · Noroeste type curves, per-well production by first-production cohort.

Top operators in the Noroeste, 2025

  1. Tecpetrol S.A. 52.4%
  2. Pan American Energy 38.1%
  3. Recursos y Energía Formosa S.A. 5.5%
  4. Jujuy Hidrocarburos Sau 1.9%
  5. High Luck Group Ltd. - Sucursal Argentina 1.3%
  6. President Petroleum S.A. 1.0%
Top operators in the Noroeste, 2025: full table
OperatorOil (Mbbl/d, 2025)Gas produced (MMcf/d, 2025)Share of output
Tecpetrol S.A. 1.360.852.4%
Pan American Energy 0.747.138.1%
Recursos y Energía Formosa S.A. 0.50.45.5%
Jujuy Hidrocarburos Sau 0.20.31.9%
High Luck Group Ltd. - Sucursal Argentina 0.10.01.3%
President Petroleum S.A. (January to July) 0.20.11.0%

Mbbl/d = thousand barrels per day · MMcf/d = million cubic feet per day (units).

Source: CommoVision (commovision.com)

Key numbers

2.7 Mbbl/d Jul 2026 oil production -8.6% vs Jul last year
93.6 MMcf/d Jul 2026 gas production -13.8% vs Jul last year
3 Mbbl/d 2025 oil production
108.6 MMcf/d 2025 gas production
966 wells Wells in the total footprint all formations & trajectories
62 wells Producing wells tracked trailing 12 months per region

What we cover here

Each row names the grain a region’s production is held at. Where a source publishes at a coarser grain, the page says so.

DataGrainSinceBenchmark
Argentina production well 2006-01

Coverage rows for Noroeste are regenerated at every build from the same catalog of sources the data is built from.

What the data shows

  • The Noroeste footprint produced 1.1 MMbbl of oil and 39.6 Bcf of natural gas in 2025.
  • Natural gas production in the Noroeste footprint peaked in 2006 at 248.9 Bcf; 2025 output of 39.6 Bcf ran at 16% of that peak.
  • Noroeste is a producing area, not a single rock target: the 966 wells here are grouped by where they are, across every formation and trajectory drilled inside it.
  • 62 producing wells tracked, trailing 12 months per region.

Get early access

Watch supply move as soon as its sources publish, with forecasts on 1.1+ million producing wells. The portal, an API and MCP access for AI tools open on October 1, 2026.

Data use is subject to our Terms of Service.