CommoVision

See the future in real time

Supply area

Austral

The Austral footprint produced 3.9 MMbbl of oil and 349.2 Bcf of natural gas in 2025. 694 producing wells tracked, trailing 12 months per region.

  • Natural gas production rose 12% in 2025 from 2024.
Production data through July 2026 · well counts as of 2026-07

A supply area is the producing region we roll every well up to, and the level supply is traded at: how each area is drawn.

Well map of Austral. The full map is further down this page.

Production

Austral natural gas production (MMcf/d, grouped by when each well first produced)
Austral natural gas production: million cubic feet per day, by first-production vintage as filed so far today 5001,0001,500 MMcf/d 2017201820192020202120222023202420252026 Aug 2016: 1,066 MMcf/d total Sep 2016: 1,062 MMcf/d total Oct 2016: 1,048 MMcf/d total Nov 2016: 983 MMcf/d total Dec 2016: 1,000 MMcf/d total Jan 2017: 1,037 MMcf/d total Feb 2017: 822 MMcf/d total Mar 2017: 1,044 MMcf/d total Apr 2017: 1,048 MMcf/d total May 2017: 999 MMcf/d total Jun 2017: 1,035 MMcf/d total Jul 2017: 1,063 MMcf/d total Aug 2017: 1,061 MMcf/d total Sep 2017: 1,049 MMcf/d total Oct 2017: 1,099 MMcf/d total Nov 2017: 1,025 MMcf/d total Dec 2017: 1,102 MMcf/d total Jan 2018: 1,107 MMcf/d total Feb 2018: 1,061 MMcf/d total Mar 2018: 1,077 MMcf/d total Apr 2018: 1,127 MMcf/d total May 2018: 1,134 MMcf/d total Jun 2018: 1,163 MMcf/d total Jul 2018: 1,172 MMcf/d total Aug 2018: 1,181 MMcf/d total Sep 2018: 1,160 MMcf/d total Oct 2018: 1,169 MMcf/d total Nov 2018: 899 MMcf/d total Dec 2018: 1,120 MMcf/d total Jan 2019: 1,101 MMcf/d total Feb 2019: 1,125 MMcf/d total Mar 2019: 1,138 MMcf/d total Apr 2019: 1,143 MMcf/d total May 2019: 1,201 MMcf/d total Jun 2019: 1,204 MMcf/d total Jul 2019: 1,239 MMcf/d total Aug 2019: 1,234 MMcf/d total Sep 2019: 1,207 MMcf/d total Oct 2019: 1,195 MMcf/d total Nov 2019: 1,099 MMcf/d total Dec 2019: 1,090 MMcf/d total Jan 2020: 1,109 MMcf/d total Feb 2020: 1,097 MMcf/d total Mar 2020: 1,102 MMcf/d total Apr 2020: 1,038 MMcf/d total May 2020: 1,154 MMcf/d total Jun 2020: 1,156 MMcf/d total Jul 2020: 1,137 MMcf/d total Aug 2020: 1,122 MMcf/d total Sep 2020: 1,127 MMcf/d total Oct 2020: 1,132 MMcf/d total Nov 2020: 1,098 MMcf/d total Dec 2020: 1,081 MMcf/d total Jan 2021: 1,101 MMcf/d total Feb 2021: 1,092 MMcf/d total Mar 2021: 1,034 MMcf/d total Apr 2021: 1,080 MMcf/d total May 2021: 1,069 MMcf/d total Jun 2021: 1,042 MMcf/d total Jul 2021: 1,054 MMcf/d total Aug 2021: 1,058 MMcf/d total Sep 2021: 1,052 MMcf/d total Oct 2021: 1,006 MMcf/d total Nov 2021: 1,020 MMcf/d total Dec 2021: 1,003 MMcf/d total Jan 2022: 989 MMcf/d total Feb 2022: 1,000 MMcf/d total Mar 2022: 805 MMcf/d total Apr 2022: 984 MMcf/d total May 2022: 969 MMcf/d total Jun 2022: 982 MMcf/d total Jul 2022: 974 MMcf/d total Aug 2022: 982 MMcf/d total Sep 2022: 977 MMcf/d total Oct 2022: 962 MMcf/d total Nov 2022: 951 MMcf/d total Dec 2022: 944 MMcf/d total Jan 2023: 937 MMcf/d total Feb 2023: 935 MMcf/d total Mar 2023: 934 MMcf/d total Apr 2023: 885 MMcf/d total May 2023: 925 MMcf/d total Jun 2023: 933 MMcf/d total Jul 2023: 915 MMcf/d total Aug 2023: 916 MMcf/d total Sep 2023: 907 MMcf/d total Oct 2023: 891 MMcf/d total Nov 2023: 841 MMcf/d total Dec 2023: 758 MMcf/d total Jan 2024: 778 MMcf/d total Feb 2024: 872 MMcf/d total Mar 2024: 869 MMcf/d total Apr 2024: 853 MMcf/d total May 2024: 879 MMcf/d total Jun 2024: 848 MMcf/d total Jul 2024: 849 MMcf/d total Aug 2024: 847 MMcf/d total Sep 2024: 855 MMcf/d total Oct 2024: 916 MMcf/d total Nov 2024: 868 MMcf/d total Dec 2024: 824 MMcf/d total Jan 2025: 978 MMcf/d total Feb 2025: 1,023 MMcf/d total Mar 2025: 959 MMcf/d total Apr 2025: 963 MMcf/d total May 2025: 970 MMcf/d total Jun 2025: 1,022 MMcf/d total Jul 2025: 1,016 MMcf/d total Aug 2025: 984 MMcf/d total Sep 2025: 925 MMcf/d total Oct 2025: 877 MMcf/d total Nov 2025: 882 MMcf/d total Dec 2025: 886 MMcf/d total Jan 2026: 876 MMcf/d total Feb 2026: 951 MMcf/d total Mar 2026: 908 MMcf/d total Apr 2026: 868 MMcf/d total May 2026: 928 MMcf/d total Jun 2026: 895 MMcf/d total Jul 2026: 891 MMcf/d total Aug 2026: 0.05 MMcf/d as filed so far. Filings for this month are still arriving. The chart shows what has been filed.

All from what the source published. All held at well grain.

How the volume breaks down
  • 100% Reported by the official source by well

Every cubic foot here starts from what the official source published for the months measured. Measured over January 2006 to July 2026.

Austral oil production (Mbbl/d, grouped by when each well first produced)
Austral oil production: thousand barrels per day, by first-production vintage as filed so far today 102030 Mbbl/d 2017201820192020202120222023202420252026 Aug 2016: 20.9 Mbbl/d total Sep 2016: 20.3 Mbbl/d total Oct 2016: 20.3 Mbbl/d total Nov 2016: 18.4 Mbbl/d total Dec 2016: 17.9 Mbbl/d total Jan 2017: 18.1 Mbbl/d total Feb 2017: 15.7 Mbbl/d total Mar 2017: 17.5 Mbbl/d total Apr 2017: 17.6 Mbbl/d total May 2017: 18.1 Mbbl/d total Jun 2017: 17.7 Mbbl/d total Jul 2017: 18.1 Mbbl/d total Aug 2017: 18 Mbbl/d total Sep 2017: 16.7 Mbbl/d total Oct 2017: 18.9 Mbbl/d total Nov 2017: 18 Mbbl/d total Dec 2017: 18.8 Mbbl/d total Jan 2018: 18.6 Mbbl/d total Feb 2018: 17.9 Mbbl/d total Mar 2018: 18 Mbbl/d total Apr 2018: 18.6 Mbbl/d total May 2018: 19.4 Mbbl/d total Jun 2018: 21.2 Mbbl/d total Jul 2018: 21.8 Mbbl/d total Aug 2018: 22.6 Mbbl/d total Sep 2018: 23.8 Mbbl/d total Oct 2018: 23.6 Mbbl/d total Nov 2018: 20.4 Mbbl/d total Dec 2018: 22.9 Mbbl/d total Jan 2019: 23 Mbbl/d total Feb 2019: 21.3 Mbbl/d total Mar 2019: 22.3 Mbbl/d total Apr 2019: 23.3 Mbbl/d total May 2019: 23.9 Mbbl/d total Jun 2019: 24.3 Mbbl/d total Jul 2019: 24.1 Mbbl/d total Aug 2019: 24.1 Mbbl/d total Sep 2019: 22.4 Mbbl/d total Oct 2019: 20.6 Mbbl/d total Nov 2019: 19.1 Mbbl/d total Dec 2019: 19.4 Mbbl/d total Jan 2020: 19.7 Mbbl/d total Feb 2020: 18.7 Mbbl/d total Mar 2020: 17.4 Mbbl/d total Apr 2020: 13 Mbbl/d total May 2020: 13.7 Mbbl/d total Jun 2020: 15.3 Mbbl/d total Jul 2020: 15.2 Mbbl/d total Aug 2020: 14.9 Mbbl/d total Sep 2020: 17.3 Mbbl/d total Oct 2020: 18 Mbbl/d total Nov 2020: 17 Mbbl/d total Dec 2020: 17.4 Mbbl/d total Jan 2021: 17 Mbbl/d total Feb 2021: 17.1 Mbbl/d total Mar 2021: 16.6 Mbbl/d total Apr 2021: 17.3 Mbbl/d total May 2021: 16.8 Mbbl/d total Jun 2021: 16.2 Mbbl/d total Jul 2021: 16.2 Mbbl/d total Aug 2021: 15.9 Mbbl/d total Sep 2021: 15.6 Mbbl/d total Oct 2021: 14.9 Mbbl/d total Nov 2021: 14.7 Mbbl/d total Dec 2021: 13.6 Mbbl/d total Jan 2022: 13.9 Mbbl/d total Feb 2022: 13.6 Mbbl/d total Mar 2022: 12.3 Mbbl/d total Apr 2022: 13.6 Mbbl/d total May 2022: 14.6 Mbbl/d total Jun 2022: 14.5 Mbbl/d total Jul 2022: 14.2 Mbbl/d total Aug 2022: 13.6 Mbbl/d total Sep 2022: 13.1 Mbbl/d total Oct 2022: 12.6 Mbbl/d total Nov 2022: 12.5 Mbbl/d total Dec 2022: 11.8 Mbbl/d total Jan 2023: 11.4 Mbbl/d total Feb 2023: 11.8 Mbbl/d total Mar 2023: 11.8 Mbbl/d total Apr 2023: 10.7 Mbbl/d total May 2023: 11.6 Mbbl/d total Jun 2023: 11.3 Mbbl/d total Jul 2023: 10.9 Mbbl/d total Aug 2023: 11.2 Mbbl/d total Sep 2023: 11.4 Mbbl/d total Oct 2023: 11.4 Mbbl/d total Nov 2023: 10.8 Mbbl/d total Dec 2023: 10.7 Mbbl/d total Jan 2024: 10.8 Mbbl/d total Feb 2024: 10.9 Mbbl/d total Mar 2024: 11 Mbbl/d total Apr 2024: 10.8 Mbbl/d total May 2024: 11.2 Mbbl/d total Jun 2024: 10.3 Mbbl/d total Jul 2024: 10.3 Mbbl/d total Aug 2024: 10.2 Mbbl/d total Sep 2024: 10.7 Mbbl/d total Oct 2024: 11.3 Mbbl/d total Nov 2024: 9.99 Mbbl/d total Dec 2024: 10.1 Mbbl/d total Jan 2025: 10.7 Mbbl/d total Feb 2025: 11.3 Mbbl/d total Mar 2025: 11.1 Mbbl/d total Apr 2025: 10.6 Mbbl/d total May 2025: 10.9 Mbbl/d total Jun 2025: 11.2 Mbbl/d total Jul 2025: 11.4 Mbbl/d total Aug 2025: 11.3 Mbbl/d total Sep 2025: 10.7 Mbbl/d total Oct 2025: 10.1 Mbbl/d total Nov 2025: 10.1 Mbbl/d total Dec 2025: 10 Mbbl/d total Jan 2026: 9.95 Mbbl/d total Feb 2026: 10.2 Mbbl/d total Mar 2026: 10 Mbbl/d total Apr 2026: 9.41 Mbbl/d total May 2026: 10.4 Mbbl/d total Jun 2026: 9.05 Mbbl/d total Jul 2026: 9.15 Mbbl/d total Aug 2026: 0.07 Mbbl/d as filed so far. Filings for this month are still arriving. The chart shows what has been filed.

All from what the source published. All held at well grain.

How the volume breaks down
  • 100% Reported by the official source by well

Every barrel here starts from what the official source published for the months measured. Measured over January 2006 to July 2026.

The bands group wells by when they first produced.

About this chart

The stack shows what is holding today's rate up and how much of it is new drilling. The bands draw the filings already in.

Annual table (full history)
YearOil (MMbbl)Gas produced (Bcf)
20253.9349
20243.9313
20234.1328
20224.9350
20215.8383
20206.0407
20198.2425
20187.6407
20176.5377
20167.5374
20158.0341
20148.5354
20139.2371
201210.0393
20119.4382
201010.1369
200911.1350
200810.9323
200710.1327
200613.1364

Source: CommoVision (commovision.com)

Monthly table (last 24 months)
MonthOil (Mbbl)Gas produced (MMcf)
2026-07283.727,626
2026-06271.626,861
2026-05323.428,782
2026-04282.326,036
2026-03310.728,162
2026-02286.126,637
2026-01308.427,162
2025-12310.427,479
2025-11301.526,467
2025-10313.427,201
2025-09321.627,760
2025-08350.030,496
2025-07354.431,504
2025-06337.130,664
2025-05338.030,064
2025-04317.528,894
2025-03343.129,716
2025-02316.928,646
2025-01332.130,320
2024-12312.425,545
2024-11299.826,051
2024-10349.828,408
2024-09321.025,638
2024-08316.826,262

Source: CommoVision (commovision.com)

Source: CommoVision · Austral, data through July 2026.

Well map

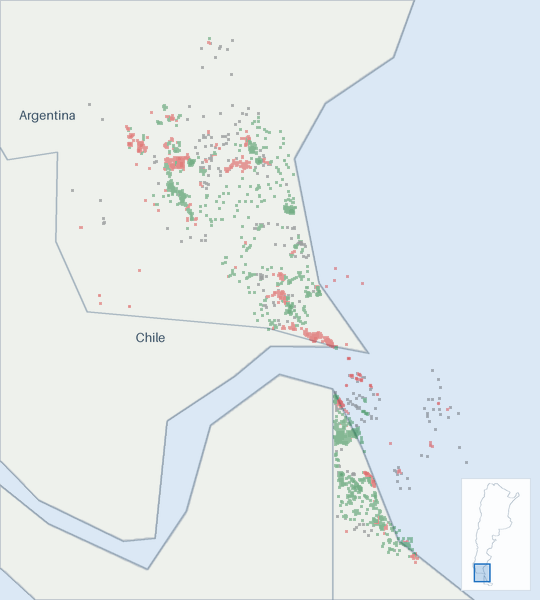
A map of 2,983 well locations inside the Austral footprint for which CommoVision holds a published surface coordinate, each drawn where it is and colored by its primary product (green for oil, red for natural gas, gray where undetermined; a spot shared by more than one product shows the one with the most wells there), on a ground of land and water over faint country outlines and place names for orientation, with a small inset map locating this frame in Argentina.
  • Oil 1,441
  • Natural gas 1,059
  • Undetermined 483
2,983 well locations inside the Austral footprint, colored by primary product. 85 more wells we track here sit outside this frame: their source publishes no coordinate, or their location falls beyond its edges.
About this map

Undetermined means not enough signal to settle it. Producing wells are the ones that reported oil or gas in the trailing 12 months per region.

Type curves

Austral natural gas type curves (Mcf/d per well, log scale, against months on production; cohorts 2010–2026)
Austral natural gas type curves: average thousand cubic feet per day per well on a log scale against months on production 2010-2014: 127 wells; starts at 542 Mcf/d per well, 1.8 Bcf cumulative through month 140 (100% of its wells old enough at that month); the dashed curve runs through month 200, on our forecast where a well’s own record ends2015: 39 wells; starts at 2,354 Mcf/d per well, 16.0 Bcf cumulative through month 128 (100% of its wells old enough at that month); the dashed curve runs through month 188, on our forecast where a well’s own record ends2016: 22 wells; starts at 1,780 Mcf/d per well, 27.9 Bcf cumulative through month 116 (100% of its wells old enough at that month); the dashed curve runs through month 176, on our forecast where a well’s own record ends2017: 44 wells; starts at 1,024 Mcf/d per well, 1.9 Bcf cumulative through month 104 (100% of its wells old enough at that month); the dashed curve runs through month 164, on our forecast where a well’s own record ends2018: 45 wells; starts at 1,286 Mcf/d per well, 2.3 Bcf cumulative through month 92 (100% of its wells old enough at that month); the dashed curve runs through month 152, on our forecast where a well’s own record ends2019: 45 wells; starts at 952 Mcf/d per well, 1.8 Bcf cumulative through month 80 (100% of its wells old enough at that month); the dashed curve runs through month 140, on our forecast where a well’s own record ends2020: 14 wells; starts at 984 Mcf/d per well, 1.8 Bcf cumulative through month 68 (100% of its wells old enough at that month); the dashed curve runs through month 128, on our forecast where a well’s own record ends2021: 24 wells; starts at 1,094 Mcf/d per well, 1.5 Bcf cumulative through month 56 (100% of its wells old enough at that month); the dashed curve runs through month 116, on our forecast where a well’s own record ends2022: 31 wells; starts at 700 Mcf/d per well, 0.9 Bcf cumulative through month 44 (100% of its wells old enough at that month); the dashed curve runs through month 104, on our forecast where a well’s own record ends2023: 30 wells; starts at 800 Mcf/d per well, 0.9 Bcf cumulative through month 32 (100% of its wells old enough at that month); the dashed curve runs through month 92, on our forecast where a well’s own record ends2024: 26 wells; starts at 7,211 Mcf/d per well, 8.2 Bcf cumulative through month 20 (100% of its wells old enough at that month); the dashed curve runs through month 80, on our forecast where a well’s own record ends2025: 10 wells; starts at 21.9 Mcf/d per well, 0.0 Bcf cumulative through month 9 (100% of its wells old enough at that month); the dashed curve runs through month 69, on our forecast where a well’s own record ends2026: 6 wells; starts at 15.2 Mcf/d per well, 0.0 Bcf cumulative through month 2 (100% of its wells old enough at that month); the dashed curve runs through month 62, on our forecast where a well’s own record ends2101001,00010,00020,000Mcf/d24487296120144168192216Months on production
Austral oil type curves (bbl/d per well, log scale, against months on production; cohorts 2010–2026)
Austral oil type curves: average barrels per day per well on a log scale against months on production 2010-2014: 127 wells; starts at 38.5 bbl/d per well, 79.6 Mbbl cumulative through month 140 (100% of its wells old enough at that month); the dashed curve runs through month 200, on our forecast where a well’s own record ends2015: 39 wells; starts at 34.7 bbl/d per well, 110 Mbbl cumulative through month 128 (100% of its wells old enough at that month); the dashed curve runs through month 188, on our forecast where a well’s own record ends2016: 22 wells; starts at 24.4 bbl/d per well, 131 Mbbl cumulative through month 116 (100% of its wells old enough at that month); the dashed curve runs through month 176, on our forecast where a well’s own record ends2017: 44 wells; starts at 19.1 bbl/d per well, 62.4 Mbbl cumulative through month 104 (100% of its wells old enough at that month); the dashed curve runs through month 164, on our forecast where a well’s own record ends2018: 45 wells; starts at 53.4 bbl/d per well, 73.9 Mbbl cumulative through month 92 (100% of its wells old enough at that month); the dashed curve runs through month 152, on our forecast where a well’s own record ends2019: 45 wells; starts at 9.7 bbl/d per well, 14.1 Mbbl cumulative through month 80 (100% of its wells old enough at that month); the dashed curve runs through month 140, on our forecast where a well’s own record ends2020: 14 wells; starts at 20.8 bbl/d per well, 33.6 Mbbl cumulative through month 68 (100% of its wells old enough at that month); the dashed curve runs through month 128, on our forecast where a well’s own record ends2021: 24 wells; starts at 6.9 bbl/d per well, 8.0 Mbbl cumulative through month 56 (100% of its wells old enough at that month); the dashed curve runs through month 116, on our forecast where a well’s own record ends2022: 31 wells; starts at 10.5 bbl/d per well, 12.3 Mbbl cumulative through month 44 (100% of its wells old enough at that month); the dashed curve runs through month 104, on our forecast where a well’s own record ends2023: 30 wells; starts at 3.1 bbl/d per well, 2.7 Mbbl cumulative through month 32 (100% of its wells old enough at that month); the dashed curve runs through month 92, on our forecast where a well’s own record ends2024: 26 wells; starts at 38.9 bbl/d per well, 49.3 Mbbl cumulative through month 20 (100% of its wells old enough at that month); the dashed curve runs through month 80, on our forecast where a well’s own record ends2025: 10 wells; starts at 4.3 bbl/d per well, 0.8 Mbbl cumulative through month 9 (100% of its wells old enough at that month); the dashed curve runs through month 69, on our forecast where a well’s own record ends2026: 6 wells; starts at 1.1 bbl/d per well, 0.0 Mbbl cumulative through month 1 (100% of its wells old enough at that month); the dashed curve runs through month 62, on our forecast where a well’s own record ends0.5125102050100150bbl/d24487296120144168192216Months on production

Average production per well, for wells grouped by when they first produced.

How these curves are built

Average daily production per well, for wells grouped by when they first produced. Includes every well of the cohort that is old enough at each month. Wells that are shut in or have stopped producing count as zero, so the average reflects the full cohort, not just survivors. Rates are calendar-day (volume ÷ days in month). The cumulative axis accumulates those same monthly averages at the average month length. Months not yet fully reported are excluded. The 2010-2014 curve draws those years as one group. The chart opens on average daily rate against months on production, the rate on a log scale. The view control switches to rate against cumulative production per well, on the same log rate scale, or to cumulative production per well against months on production, on a linear scale. Every view draws the same cohorts from the same production history. Each cohort is solid through the last month all of its wells sit inside fully reported data. Past it the dashed curve carries the same wells forward, on our forecast where a well’s own record ends, for up to five years. A dashed curve runs as far as at least nine in ten of its wells are accounted for. A well that is old enough but shut in still counts, as zero. The measured months are what these wells reported. In the forward months each well counts its own reported figure for each month it has one, our forecast for each month it has only that, and zero for the rest. The forward average counts every well of the cohort. The drawn forecast runs up to five years past the measured months. Line thickness tracks the size of each cohort. 783 wells are counted here but not shown on the age axis: they started producing in 2008 or earlier, too close to the start of our records for their region to verify their true age.

Cohort summary table
First produced Wells Peak oil (bbl/d per well) Month-12 oil (bbl/d per well) Cum oil in series (Mbbl per well) Peak gas (Mcf/d per well) Month-12 gas (Mcf/d per well) Cum gas in series (Bcf per well) Months in series Wells old enough at last month in series Forecast months drawn
2026 6 1.1 0.0 18.3 0.0 2 100% 60
2025 10 4.5 0.8 34.5 0.0 9 100% 60
2024 26 112 85.6 49.3 18,745 13,964 8.2 20 100% 60
2023 30 5.2 2.7 2.7 1,570 1,067 0.9 32 100% 60
2022 31 29 8.6 12.3 1,279 791 0.9 44 100% 60
2021 24 12.8 8 8.0 2,230 1,211 1.5 56 100% 60
2020 14 34.3 17.3 33.6 2,606 1,376 1.8 68 100% 60
2019 45 24.3 10.5 14.1 2,363 1,287 1.8 80 100% 60
2018 45 92 51.8 73.9 3,021 1,758 2.3 92 100% 60
2017 44 65.6 41.2 62.4 2,091 1,174 1.9 104 100% 60
2016 22 81.5 74.9 131 14,669 14,669 27.9 116 100% 60
2015 39 87.3 46.5 110 5,772 5,772 16.0 128 100% 60
2010-2014 127 73.6 45.8 79.6 1,125 1,003 1.8 140 100% 60

Source: CommoVision (commovision.com)

Source: CommoVision · Austral type curves, per-well production by first-production cohort.

Top operators in the Austral, 2025

  1. TotalEnergies Austral S.A. 72.2%
  2. Compañía General de Combustibles S.A. 12.4%
  3. ENAP Sipetrol Argentina S.A. 4.3%
  4. YPF S.A. 3.9%
  5. Petrolera Santa María S.A.U. 3.8%
  6. Roch S.A. 1.6%
  7. Venoil S.A. 0.9%
  8. Interoil Argentina S.A. 0.7%
  9. Fomicruz S.E. 0.1%
  10. Petrofaro S.A. 0.1%
Top operators in the Austral, 2025: full table
OperatorOil (Mbbl/d, 2025)Gas produced (MMcf/d, 2025)Share of output
TotalEnergies Austral S.A. 4.7736.272.2%
Compañía General de Combustibles S.A. 1.5116.012.4%
ENAP Sipetrol Argentina S.A. (January to June) 2.363.24.3%
YPF S.A. 1.225.73.9%
Petrolera Santa María S.A.U. (July to December) 2.252.23.8%
Roch S.A. 0.68.91.6%
Venoil S.A. 0.36.00.9%
Interoil Argentina S.A. 0.15.50.7%
Fomicruz S.E. 0.10.10.1%
Petrofaro S.A. 0.00.70.1%

Mbbl/d = thousand barrels per day · MMcf/d = million cubic feet per day (units).

Source: CommoVision (commovision.com)

Key numbers

9.2 Mbbl/d Jul 2026 oil production -20% vs Jul last year
891.2 MMcf/d Jul 2026 gas production -12.3% vs Jul last year
10.8 Mbbl/d 2025 oil production
956.7 MMcf/d 2025 gas production
3,068 wells Wells in the total footprint all formations & trajectories
694 wells Producing wells tracked trailing 12 months per region

What we cover here

Each row names the grain a region’s production is held at. Where a source publishes at a coarser grain, the page says so.

DataGrainSinceBenchmark
Argentina production well 2006-01

Coverage rows for Austral are regenerated at every build from the same catalog of sources the data is built from.

What the data shows

  • The Austral footprint produced 3.9 MMbbl of oil and 349.2 Bcf of natural gas in 2025.
  • Natural gas production in the Austral footprint peaked in 2019 at 425.2 Bcf; 2025 output of 349.2 Bcf ran at 82% of that peak.
  • Austral is a producing area, not a single rock target: the 3,068 wells here are grouped by where they are, across every formation and trajectory drilled inside it.
  • 694 producing wells tracked, trailing 12 months per region.

Get early access

Watch supply move as soon as its sources publish, with forecasts on 1.1+ million producing wells. The portal, an API and MCP access for AI tools open on October 1, 2026.

Data use is subject to our Terms of Service.