CommoVision

See the future in real time

Supply area

Mexico Onshore

The Mexico Onshore footprint produced 219.0 MMbbl of oil and 872.3 Bcf of natural gas in 2025. 7,130 producing wells tracked, trailing 12 months per region.

  • Oil production fell 3% in 2025 from 2024.
Production data through July 2026 · well counts as of 2026-07

A supply area is the producing region we roll every well up to, and the level supply is traded at: how each area is drawn.

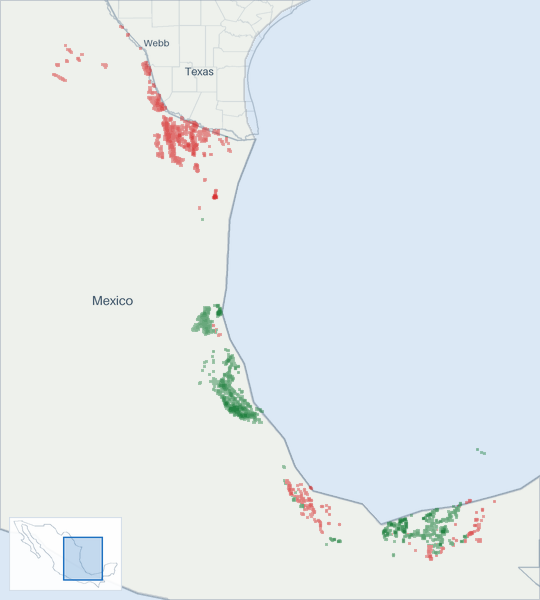
Well map of Mexico Onshore. The full map is further down this page.

Production

Mexico Onshore oil production (Mbbl/d, grouped by when each well first produced)
Mexico Onshore oil production: thousand barrels per day, by first-production vintage today 200400600800 Mbbl/d 2017201820192020202120222023202420252026 Aug 2016: 440 Mbbl/d total Sep 2016: 432 Mbbl/d total Oct 2016: 424 Mbbl/d total Nov 2016: 408 Mbbl/d total Dec 2016: 401 Mbbl/d total Jan 2017: 392 Mbbl/d total Feb 2017: 386 Mbbl/d total Mar 2017: 383 Mbbl/d total Apr 2017: 379 Mbbl/d total May 2017: 376 Mbbl/d total Jun 2017: 372 Mbbl/d total Jul 2017: 367 Mbbl/d total Aug 2017: 358 Mbbl/d total Sep 2017: 351 Mbbl/d total Oct 2017: 341 Mbbl/d total Nov 2017: 332 Mbbl/d total Dec 2017: 335 Mbbl/d total Jan 2018: 334 Mbbl/d total Feb 2018: 331 Mbbl/d total Mar 2018: 329 Mbbl/d total Apr 2018: 326 Mbbl/d total May 2018: 321 Mbbl/d total Jun 2018: 321 Mbbl/d total Jul 2018: 320 Mbbl/d total Aug 2018: 317 Mbbl/d total Sep 2018: 315 Mbbl/d total Oct 2018: 313 Mbbl/d total Nov 2018: 307 Mbbl/d total Dec 2018: 310 Mbbl/d total Jan 2019: 312 Mbbl/d total Feb 2019: 308 Mbbl/d total Mar 2019: 310 Mbbl/d total Apr 2019: 310 Mbbl/d total May 2019: 309 Mbbl/d total Jun 2019: 311 Mbbl/d total Jul 2019: 313 Mbbl/d total Aug 2019: 317 Mbbl/d total Sep 2019: 325 Mbbl/d total Oct 2019: 324 Mbbl/d total Nov 2019: 324 Mbbl/d total Dec 2019: 328 Mbbl/d total Jan 2020: 335 Mbbl/d total Feb 2020: 343 Mbbl/d total Mar 2020: 347 Mbbl/d total Apr 2020: 328 Mbbl/d total May 2020: 291 Mbbl/d total Jun 2020: 312 Mbbl/d total Jul 2020: 332 Mbbl/d total Aug 2020: 339 Mbbl/d total Sep 2020: 338 Mbbl/d total Oct 2020: 338 Mbbl/d total Nov 2020: 337 Mbbl/d total Dec 2020: 344 Mbbl/d total Jan 2021: 345 Mbbl/d total Feb 2021: 344 Mbbl/d total Mar 2021: 348 Mbbl/d total Apr 2021: 349 Mbbl/d total May 2021: 364 Mbbl/d total Jun 2021: 380 Mbbl/d total Jul 2021: 394 Mbbl/d total Aug 2021: 402 Mbbl/d total Sep 2021: 414 Mbbl/d total Oct 2021: 419 Mbbl/d total Nov 2021: 433 Mbbl/d total Dec 2021: 434 Mbbl/d total Jan 2022: 454 Mbbl/d total Feb 2022: 454 Mbbl/d total Mar 2022: 488 Mbbl/d total Apr 2022: 490 Mbbl/d total May 2022: 489 Mbbl/d total Jun 2022: 487 Mbbl/d total Jul 2022: 491 Mbbl/d total Aug 2022: 483 Mbbl/d total Sep 2022: 496 Mbbl/d total Oct 2022: 515 Mbbl/d total Nov 2022: 546 Mbbl/d total Dec 2022: 571 Mbbl/d total Jan 2023: 608 Mbbl/d total Feb 2023: 615 Mbbl/d total Mar 2023: 621 Mbbl/d total Apr 2023: 645 Mbbl/d total May 2023: 649 Mbbl/d total Jun 2023: 649 Mbbl/d total Jul 2023: 655 Mbbl/d total Aug 2023: 644 Mbbl/d total Sep 2023: 649 Mbbl/d total Oct 2023: 643 Mbbl/d total Nov 2023: 648 Mbbl/d total Dec 2023: 640 Mbbl/d total Jan 2024: 637 Mbbl/d total Feb 2024: 631 Mbbl/d total Mar 2024: 630 Mbbl/d total Apr 2024: 629 Mbbl/d total May 2024: 628 Mbbl/d total Jun 2024: 626 Mbbl/d total Jul 2024: 622 Mbbl/d total Aug 2024: 626 Mbbl/d total Sep 2024: 619 Mbbl/d total Oct 2024: 610 Mbbl/d total Nov 2024: 596 Mbbl/d total Dec 2024: 568 Mbbl/d total Jan 2025: 574 Mbbl/d total Feb 2025: 575 Mbbl/d total Mar 2025: 570 Mbbl/d total Apr 2025: 593 Mbbl/d total May 2025: 607 Mbbl/d total Jun 2025: 605 Mbbl/d total Jul 2025: 603 Mbbl/d total Aug 2025: 602 Mbbl/d total Sep 2025: 613 Mbbl/d total Oct 2025: 611 Mbbl/d total Nov 2025: 623 Mbbl/d total Dec 2025: 625 Mbbl/d total Jan 2026: 623 Mbbl/d total Feb 2026: 615 Mbbl/d total Mar 2026: 624 Mbbl/d total Apr 2026: 624 Mbbl/d total May 2026: 630 Mbbl/d total Jun 2026: 635 Mbbl/d total Jul 2026: 641 Mbbl/d total

Still arriving: Aug 2026 <1% filed.

All from what the source published. All held at well grain.

How the volume breaks down
  • 100% Reported by the official source by well

Every barrel here starts from what the official source published for the months measured. Measured over January 2000 to July 2026.

Mexico Onshore natural gas production (Bcf/d, grouped by when each well first produced)
Mexico Onshore natural gas production: billion cubic feet per day, by first-production vintage today 123 Bcf/d 2017201820192020202120222023202420252026 Aug 2016: 2.54 Bcf/d total Sep 2016: 2.48 Bcf/d total Oct 2016: 2.44 Bcf/d total Nov 2016: 2.38 Bcf/d total Dec 2016: 2.33 Bcf/d total Jan 2017: 2.28 Bcf/d total Feb 2017: 2.23 Bcf/d total Mar 2017: 2.22 Bcf/d total Apr 2017: 2.22 Bcf/d total May 2017: 2.19 Bcf/d total Jun 2017: 2.17 Bcf/d total Jul 2017: 2.15 Bcf/d total Aug 2017: 2.12 Bcf/d total Sep 2017: 2.09 Bcf/d total Oct 2017: 2.05 Bcf/d total Nov 2017: 2.03 Bcf/d total Dec 2017: 2.01 Bcf/d total Jan 2018: 2.02 Bcf/d total Feb 2018: 1.97 Bcf/d total Mar 2018: 1.96 Bcf/d total Apr 2018: 1.96 Bcf/d total May 2018: 1.93 Bcf/d total Jun 2018: 1.92 Bcf/d total Jul 2018: 1.88 Bcf/d total Aug 2018: 1.86 Bcf/d total Sep 2018: 1.85 Bcf/d total Oct 2018: 1.84 Bcf/d total Nov 2018: 1.83 Bcf/d total Dec 2018: 1.83 Bcf/d total Jan 2019: 1.84 Bcf/d total Feb 2019: 1.84 Bcf/d total Mar 2019: 1.81 Bcf/d total Apr 2019: 1.78 Bcf/d total May 2019: 1.78 Bcf/d total Jun 2019: 1.8 Bcf/d total Jul 2019: 1.82 Bcf/d total Aug 2019: 1.85 Bcf/d total Sep 2019: 1.89 Bcf/d total Oct 2019: 1.9 Bcf/d total Nov 2019: 1.92 Bcf/d total Dec 2019: 1.92 Bcf/d total Jan 2020: 1.93 Bcf/d total Feb 2020: 1.91 Bcf/d total Mar 2020: 1.88 Bcf/d total Apr 2020: 1.83 Bcf/d total May 2020: 1.77 Bcf/d total Jun 2020: 1.83 Bcf/d total Jul 2020: 1.83 Bcf/d total Aug 2020: 1.82 Bcf/d total Sep 2020: 1.8 Bcf/d total Oct 2020: 1.78 Bcf/d total Nov 2020: 1.74 Bcf/d total Dec 2020: 1.78 Bcf/d total Jan 2021: 1.79 Bcf/d total Feb 2021: 1.78 Bcf/d total Mar 2021: 1.78 Bcf/d total Apr 2021: 1.75 Bcf/d total May 2021: 1.81 Bcf/d total Jun 2021: 1.89 Bcf/d total Jul 2021: 1.93 Bcf/d total Aug 2021: 1.94 Bcf/d total Sep 2021: 1.97 Bcf/d total Oct 2021: 1.99 Bcf/d total Nov 2021: 2.03 Bcf/d total Dec 2021: 2.05 Bcf/d total Jan 2022: 2.12 Bcf/d total Feb 2022: 2.09 Bcf/d total Mar 2022: 2.2 Bcf/d total Apr 2022: 2.16 Bcf/d total May 2022: 2.15 Bcf/d total Jun 2022: 2.16 Bcf/d total Jul 2022: 2.17 Bcf/d total Aug 2022: 2.11 Bcf/d total Sep 2022: 2.12 Bcf/d total Oct 2022: 2.14 Bcf/d total Nov 2022: 2.24 Bcf/d total Dec 2022: 2.3 Bcf/d total Jan 2023: 2.38 Bcf/d total Feb 2023: 2.36 Bcf/d total Mar 2023: 2.38 Bcf/d total Apr 2023: 2.44 Bcf/d total May 2023: 2.41 Bcf/d total Jun 2023: 2.39 Bcf/d total Jul 2023: 2.39 Bcf/d total Aug 2023: 2.36 Bcf/d total Sep 2023: 2.36 Bcf/d total Oct 2023: 2.36 Bcf/d total Nov 2023: 2.37 Bcf/d total Dec 2023: 2.33 Bcf/d total Jan 2024: 2.33 Bcf/d total Feb 2024: 2.33 Bcf/d total Mar 2024: 2.33 Bcf/d total Apr 2024: 2.36 Bcf/d total May 2024: 2.33 Bcf/d total Jun 2024: 2.34 Bcf/d total Jul 2024: 2.32 Bcf/d total Aug 2024: 2.31 Bcf/d total Sep 2024: 2.29 Bcf/d total Oct 2024: 2.29 Bcf/d total Nov 2024: 2.25 Bcf/d total Dec 2024: 2.22 Bcf/d total Jan 2025: 2.18 Bcf/d total Feb 2025: 2.23 Bcf/d total Mar 2025: 2.23 Bcf/d total Apr 2025: 2.3 Bcf/d total May 2025: 2.35 Bcf/d total Jun 2025: 2.36 Bcf/d total Jul 2025: 2.38 Bcf/d total Aug 2025: 2.37 Bcf/d total Sep 2025: 2.52 Bcf/d total Oct 2025: 2.57 Bcf/d total Nov 2025: 2.59 Bcf/d total Dec 2025: 2.6 Bcf/d total Jan 2026: 2.65 Bcf/d total Feb 2026: 2.65 Bcf/d total Mar 2026: 2.69 Bcf/d total Apr 2026: 2.73 Bcf/d total May 2026: 2.78 Bcf/d total Jun 2026: 2.8 Bcf/d total Jul 2026: 2.8 Bcf/d total

Still arriving: Aug 2026 <1% filed.

All from what the source published. All held at well grain.

How the volume breaks down
  • 100% Reported by the official source by well

Every cubic foot here starts from what the official source published for the months measured. Measured over January 2000 to July 2026.

The bands group wells by when they first produced.

About this chart

The stack shows what is holding today's rate up and how much of it is new drilling. The bands draw the filings already in.

Annual table (full history)
YearOil (MMbbl)Gas produced (Bcf)
2025219.0872
2024226.3845
2023233.3868
2022181.5789
2021140.9691
2020121.5668
2019115.3673
2018116.9694
2017132.9783
2016165.3957
2015187.51,120
2014212.41,238
2013227.41,304
2012237.51,362
2011236.21,427
2010230.61,528
2009212.01,477
2008194.21,420
2007197.51,374
2006207.81,270
2005210.31,162
2004201.01,088
2003202.21,073
2002207.31,072
2001211.71,075
2000227.21,129

Source: CommoVision (commovision.com)

Monthly table (last 24 months)
MonthOil (Mbbl)Gas produced (MMcf)
2026-0719,870.886,872
2026-0619,046.483,903
2026-0519,527.486,133
2026-0418,714.381,976
2026-0319,333.783,352
2026-0217,229.674,162
2026-0119,298.082,261
2025-1219,384.980,489
2025-1118,677.077,731
2025-1018,942.579,541
2025-0918,401.175,568
2025-0818,652.973,506
2025-0718,691.373,863
2025-0618,137.670,752
2025-0518,803.372,900
2025-0417,790.268,908
2025-0317,675.569,209
2025-0216,107.862,306
2025-0117,782.867,544
2024-1217,610.568,837
2024-1117,893.867,498
2024-1018,908.971,104
2024-0918,571.268,662
2024-0819,392.771,579

Source: CommoVision (commovision.com)

Source: CommoVision · Mexico Onshore, data through July 2026.

Well map

A map of 17,102 well locations inside the Mexico Onshore footprint for which CommoVision holds a published surface coordinate, each drawn where it is and colored by its primary product (green for oil, red for natural gas, gray where undetermined; a spot shared by more than one product shows the one with the most wells there), on a ground of land and water over faint country, state and county outlines and place names for orientation, with a small inset map locating this frame in Mexico.
  • Oil 10,540
  • Natural gas 6,562
17,102 well locations inside the Mexico Onshore footprint, colored by primary product. 169 more wells we track here sit outside this frame: their source publishes no coordinate, or their location falls beyond its edges.
About this map

Undetermined means not enough signal to settle it. Producing wells are the ones that reported oil or gas in the trailing 12 months per region.

Type curves

Mexico Onshore oil type curves (bbl/d per well, log scale, against months on production; cohorts 2010–2026)
Mexico Onshore oil type curves: average barrels per day per well on a log scale against months on production 2010-2014: 4,567 wells; starts at 82.8 bbl/d per well, 179 Mbbl cumulative through month 140 (100% of its wells old enough at that month); the dashed curve runs through month 200, on our forecast where a well’s own record ends2015: 259 wells; starts at 192 bbl/d per well, 627 Mbbl cumulative through month 128 (100% of its wells old enough at that month); the dashed curve runs through month 188, on our forecast where a well’s own record ends2016: 111 wells; starts at 177 bbl/d per well, 371 Mbbl cumulative through month 116 (100% of its wells old enough at that month); the dashed curve runs through month 176, on our forecast where a well’s own record ends2017: 40 wells; starts at 98.2 bbl/d per well, 102 Mbbl cumulative through month 104 (100% of its wells old enough at that month); the dashed curve runs through month 164, on our forecast where a well’s own record ends2018: 132 wells; starts at 108 bbl/d per well, 278 Mbbl cumulative through month 92 (100% of its wells old enough at that month); the dashed curve runs through month 152, on our forecast where a well’s own record ends2019: 184 wells; starts at 107 bbl/d per well, 469 Mbbl cumulative through month 80 (100% of its wells old enough at that month); the dashed curve runs through month 140, on our forecast where a well’s own record ends2020: 118 wells; starts at 226 bbl/d per well, 719 Mbbl cumulative through month 68 (100% of its wells old enough at that month); the dashed curve runs through month 128, on our forecast where a well’s own record ends2021: 88 wells; starts at 296 bbl/d per well, 1,668 Mbbl cumulative through month 56 (100% of its wells old enough at that month); the dashed curve runs through month 116, on our forecast where a well’s own record ends2022: 121 wells; starts at 600 bbl/d per well, 1,234 Mbbl cumulative through month 44 (100% of its wells old enough at that month); the dashed curve runs through month 104, on our forecast where a well’s own record ends2023: 150 wells; starts at 517 bbl/d per well, 854 Mbbl cumulative through month 32 (100% of its wells old enough at that month); the dashed curve runs through month 92, on our forecast where a well’s own record ends2024: 79 wells; starts at 822 bbl/d per well, 807 Mbbl cumulative through month 20 (100% of its wells old enough at that month); the dashed curve runs through month 80, on our forecast where a well’s own record ends2025: 113 wells; starts at 328 bbl/d per well, 186 Mbbl cumulative through month 8 (100% of its wells old enough at that month); the dashed curve runs through month 68, on our forecast where a well’s own record ends2026: 74 wells; starts at 359 bbl/d per well, 33.5 Mbbl cumulative through month 2 (100% of its wells old enough at that month); the dashed curve runs through month 62, on our forecast where a well’s own record ends5101001,0002,000bbl/d24487296120144168192216Months on production
Mexico Onshore natural gas type curves (Mcf/d per well, log scale, against months on production; cohorts 2010–2026)
Mexico Onshore natural gas type curves: average thousand cubic feet per day per well on a log scale against months on production 2010-2014: 4,567 wells; starts at 343 Mcf/d per well, 0.9 Bcf cumulative through month 140 (100% of its wells old enough at that month); the dashed curve runs through month 200, on our forecast where a well’s own record ends2015: 259 wells; starts at 478 Mcf/d per well, 1.5 Bcf cumulative through month 128 (100% of its wells old enough at that month); the dashed curve runs through month 188, on our forecast where a well’s own record ends2016: 111 wells; starts at 353 Mcf/d per well, 1.2 Bcf cumulative through month 116 (100% of its wells old enough at that month); the dashed curve runs through month 176, on our forecast where a well’s own record ends2017: 40 wells; starts at 151 Mcf/d per well, 0.1 Bcf cumulative through month 104 (100% of its wells old enough at that month); the dashed curve runs through month 164, on our forecast where a well’s own record ends2018: 132 wells; starts at 297 Mcf/d per well, 1.2 Bcf cumulative through month 92 (100% of its wells old enough at that month); the dashed curve runs through month 152, on our forecast where a well’s own record ends2019: 184 wells; starts at 338 Mcf/d per well, 2.0 Bcf cumulative through month 80 (100% of its wells old enough at that month); the dashed curve runs through month 140, on our forecast where a well’s own record ends2020: 118 wells; starts at 856 Mcf/d per well, 3.6 Bcf cumulative through month 68 (100% of its wells old enough at that month); the dashed curve runs through month 128, on our forecast where a well’s own record ends2021: 88 wells; starts at 845 Mcf/d per well, 5.7 Bcf cumulative through month 56 (100% of its wells old enough at that month); the dashed curve runs through month 116, on our forecast where a well’s own record ends2022: 121 wells; starts at 1,979 Mcf/d per well, 4.1 Bcf cumulative through month 44 (100% of its wells old enough at that month); the dashed curve runs through month 104, on our forecast where a well’s own record ends2023: 150 wells; starts at 1,373 Mcf/d per well, 2.3 Bcf cumulative through month 32 (100% of its wells old enough at that month); the dashed curve runs through month 92, on our forecast where a well’s own record ends2024: 79 wells; starts at 2,754 Mcf/d per well, 3.1 Bcf cumulative through month 20 (100% of its wells old enough at that month); the dashed curve runs through month 80, on our forecast where a well’s own record ends2025: 113 wells; starts at 1,660 Mcf/d per well, 1.0 Bcf cumulative through month 8 (100% of its wells old enough at that month); the dashed curve runs through month 68, on our forecast where a well’s own record ends2026: 74 wells; starts at 1,812 Mcf/d per well, 0.2 Bcf cumulative through month 2 (100% of its wells old enough at that month); the dashed curve runs through month 62, on our forecast where a well’s own record ends5101001,0007,000Mcf/d24487296120144168192216Months on production

Average production per well, for wells grouped by when they first produced.

How these curves are built

Average daily production per well, for wells grouped by when they first produced. Includes every well of the cohort that is old enough at each month. Wells that are shut in or have stopped producing count as zero, so the average reflects the full cohort, not just survivors. Rates are calendar-day (volume ÷ days in month). The cumulative axis accumulates those same monthly averages at the average month length. Months not yet fully reported are excluded. The 2010-2014 curve draws those years as one group. The chart opens on average daily rate against months on production, the rate on a log scale. The view control switches to rate against cumulative production per well, on the same log rate scale, or to cumulative production per well against months on production, on a linear scale. Every view draws the same cohorts from the same production history. Each cohort is solid through the last month all of its wells sit inside fully reported data. Past it the dashed curve carries the same wells forward, on our forecast where a well’s own record ends, for up to five years. A dashed curve runs as far as at least nine in ten of its wells are accounted for. A well that is old enough but shut in still counts, as zero. The measured months are what these wells reported. In the forward months each well counts its own reported figure for each month it has one, our forecast for each month it has only that, and zero for the rest. The forward average counts every well of the cohort. The drawn forecast runs up to five years past the measured months. Line thickness tracks the size of each cohort. 5,899 wells are counted here but not shown on the age axis: they started producing in 2002 or earlier, too close to the start of our records for their region to verify their true age.

Cohort summary table
First produced Wells Peak oil (bbl/d per well) Month-12 oil (bbl/d per well) Cum oil in series (Mbbl per well) Peak gas (Mcf/d per well) Month-12 gas (Mcf/d per well) Cum gas in series (Bcf per well) Months in series Wells old enough at last month in series Forecast months drawn
2026 74 740 33.5 3,648 0.2 2 100% 60
2025 113 886 186 5,307 1.0 8 100% 60
2024 79 1,588 1,242 807 5,585 5,075 3.1 20 100% 60
2023 150 1,267 1,006 854 3,169 2,557 2.3 32 100% 60
2022 121 1,593 1,226 1,234 4,772 3,878 4.1 44 100% 60
2021 88 1,466 1,372 1,668 4,916 4,835 5.7 56 100% 60
2020 118 447 397 719 2,241 2,045 3.6 68 100% 60
2019 184 240 225 469 1,153 1,099 2.0 80 100% 60
2018 132 219 145 278 789 643 1.2 92 100% 60
2017 40 112 76.6 102 183 106 0.1 104 100% 60
2016 111 318 212 371 729 581 1.2 116 100% 60
2015 259 427 307 627 957 703 1.5 128 100% 60
2010-2014 4,567 158 111 179 639 477 0.9 140 100% 60

Source: CommoVision (commovision.com)

Source: CommoVision · Mexico Onshore type curves, per-well production by first-production cohort.

Top operators in Mexico Onshore, 2025

  1. Petróleos Mexicanos 95.6%
  2. Perenco 2.0%
  3. Petrolera Cárdenas Mora 0.5%
  4. Grupo Diavaz 0.5%
  5. Harbour Energy plc 0.5%
  6. Servicios de Extracción Petrolera Lifting de México 0.2%
  7. Servicios Múltiples de Burgos 0.2%
  8. Renaissance Oil 0.1%
  9. Pantera Exploración y Producción 2.2 0.1%
  10. Consorcio Petrolero 5M del Golfo 0.1%
  11. 7 other operators 0.2%
  12. Without a named operator 0.1%
Top operators in Mexico Onshore, 2025: full table
OperatorOil (Mbbl/d, 2025)Gas produced (MMcf/d, 2025)Share of output
Petróleos Mexicanos 572.72,297.595.6%
Perenco 13.919.42.0%
Petrolera Cárdenas Mora 3.38.60.5%
Grupo Diavaz 3.63.50.5%
Harbour Energy plc 3.37.90.5%
Servicios de Extracción Petrolera Lifting de México 1.61.90.2%
Servicios Múltiples de Burgos 0.026.00.2%
Renaissance Oil 0.55.30.1%
Pantera Exploración y Producción 2.2 0.06.80.1%
Consorcio Petrolero 5M del Golfo 0.05.90.1%
7 other operators 0.76.40.2%
Without a named operator 0.40.80.1%

Mbbl/d = thousand barrels per day · MMcf/d = million cubic feet per day (units).

Source: CommoVision (commovision.com)

Key numbers

641 Mbbl/d Jul 2026 oil production +6.3% vs Jul last year
2.8 Bcf/d Jul 2026 gas production +17.6% vs Jul last year
600.1 Mbbl/d 2025 oil production
2.39 Bcf/d 2025 gas production
17,271 wells Wells in the total footprint all formations & trajectories
7,130 wells Producing wells tracked trailing 12 months per region

What we cover here

Each row names the grain a region’s production is held at. Where a source publishes at a coarser grain, the page says so.

DataGrainSinceBenchmark
Mexico production field + well 1960-01

Coverage rows for Mexico Onshore are regenerated at every build from the same catalog of sources the data is built from.

What the data shows

  • The Mexico Onshore footprint produced 219.0 MMbbl of oil and 872.3 Bcf of natural gas in 2025.
  • Oil production in the Mexico Onshore footprint peaked in 2012 at 237.5 MMbbl; 2025 output of 219.0 MMbbl ran at 92% of that peak.
  • Mexico Onshore is a producing area, not a single rock target: the 17,271 wells here are grouped by where they are, across every formation and trajectory drilled inside it.
  • 7,130 producing wells tracked, trailing 12 months per region.

Get early access

Watch supply move as soon as its sources publish, with forecasts on 1.1+ million producing wells. The portal, an API and MCP access for AI tools open on October 1, 2026.

Data use is subject to our Terms of Service.