CommoVision

See the future in real time

Mexico

Mexico produced 629.5 MMbbl of oil and 1.68 Tcf of natural gas in 2025. 7,855 producing wells tracked, 12 months to Sep 2026.

  • Fourth-largest oil-producing country in the Americas, 2025.
  • 6.1% of the oil produced in the Americas, 2025.
  • Oil production fell 6% in 2025 from 2024.
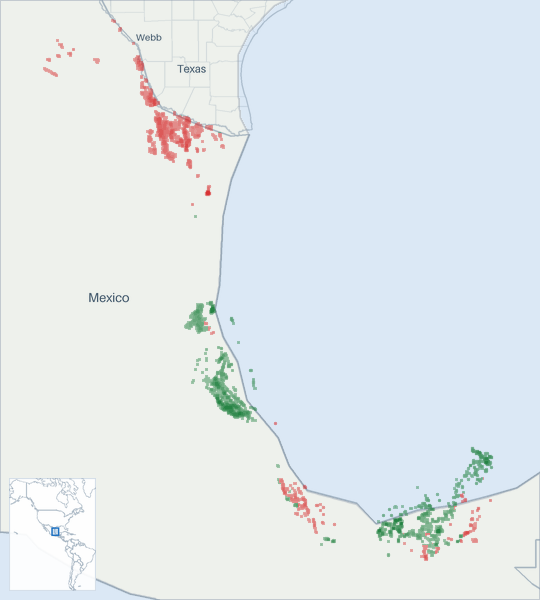
Well map of Mexico. The full map is further down this page.

Production

Mexico oil production (Mbbl/d, grouped by when each well first produced)
  • filling in (est. · unconfirmed) . Hatching marks our estimate of the volume still to be filed. That estimate draws on our own production forecast. This estimate is published unconfirmed. It updates as filings arrive
Mexico oil production: thousand barrels per day, by first-production vintage filed in full 1,0002,0003,000 Mbbl/d 2017201820192020202120222023202420252026 Dec 2016: 2,035 Mbbl/d total Jan 2017: 2,019 Mbbl/d total Feb 2017: 2,015 Mbbl/d total Mar 2017: 2,017 Mbbl/d total Apr 2017: 2,011 Mbbl/d total May 2017: 2,019 Mbbl/d total Jun 2017: 2,008 Mbbl/d total Jul 2017: 1,985 Mbbl/d total Aug 2017: 1,930 Mbbl/d total Sep 2017: 1,731 Mbbl/d total Oct 2017: 1,902 Mbbl/d total Nov 2017: 1,866 Mbbl/d total Dec 2017: 1,875 Mbbl/d total Jan 2018: 1,928 Mbbl/d total Feb 2018: 1,894 Mbbl/d total Mar 2018: 1,864 Mbbl/d total Apr 2018: 1,885 Mbbl/d total May 2018: 1,867 Mbbl/d total Jun 2018: 1,846 Mbbl/d total Jul 2018: 1,841 Mbbl/d total Aug 2018: 1,817 Mbbl/d total Sep 2018: 1,825 Mbbl/d total Oct 2018: 1,766 Mbbl/d total Nov 2018: 1,716 Mbbl/d total Dec 2018: 1,728 Mbbl/d total Jan 2019: 1,641 Mbbl/d total Feb 2019: 1,721 Mbbl/d total Mar 2019: 1,709 Mbbl/d total Apr 2019: 1,694 Mbbl/d total May 2019: 1,682 Mbbl/d total Jun 2019: 1,692 Mbbl/d total Jul 2019: 1,702 Mbbl/d total Aug 2019: 1,716 Mbbl/d total Sep 2019: 1,739 Mbbl/d total Oct 2019: 1,690 Mbbl/d total Nov 2019: 1,733 Mbbl/d total Dec 2019: 1,742 Mbbl/d total Jan 2020: 1,761 Mbbl/d total Feb 2020: 1,766 Mbbl/d total Mar 2020: 1,783 Mbbl/d total Apr 2020: 1,762 Mbbl/d total May 2020: 1,694 Mbbl/d total Jun 2020: 1,674 Mbbl/d total Jul 2020: 1,665 Mbbl/d total Aug 2020: 1,707 Mbbl/d total Sep 2020: 1,716 Mbbl/d total Oct 2020: 1,698 Mbbl/d total Nov 2020: 1,705 Mbbl/d total Dec 2020: 1,728 Mbbl/d total Jan 2021: 1,727 Mbbl/d total Feb 2021: 1,746 Mbbl/d total Mar 2021: 1,777 Mbbl/d total Apr 2021: 1,771 Mbbl/d total May 2021: 1,779 Mbbl/d total Jun 2021: 1,794 Mbbl/d total Jul 2021: 1,795 Mbbl/d total Aug 2021: 1,752 Mbbl/d total Sep 2021: 1,807 Mbbl/d total Oct 2021: 1,798 Mbbl/d total Nov 2021: 1,804 Mbbl/d total Dec 2021: 1,807 Mbbl/d total Jan 2022: 1,828 Mbbl/d total Feb 2022: 1,812 Mbbl/d total Mar 2022: 1,834 Mbbl/d total Apr 2022: 1,821 Mbbl/d total May 2022: 1,836 Mbbl/d total Jun 2022: 1,845 Mbbl/d total Jul 2022: 1,850 Mbbl/d total Aug 2022: 1,846 Mbbl/d total Sep 2022: 1,848 Mbbl/d total Oct 2022: 1,854 Mbbl/d total Nov 2022: 1,860 Mbbl/d total Dec 2022: 1,880 Mbbl/d total Jan 2023: 1,933 Mbbl/d total Feb 2023: 1,929 Mbbl/d total Mar 2023: 1,935 Mbbl/d total Apr 2023: 1,964 Mbbl/d total May 2023: 1,969 Mbbl/d total Jun 2023: 1,962 Mbbl/d total Jul 2023: 1,919 Mbbl/d total Aug 2023: 1,944 Mbbl/d total Sep 2023: 1,942 Mbbl/d total Oct 2023: 1,919 Mbbl/d total Nov 2023: 1,911 Mbbl/d total Dec 2023: 1,903 Mbbl/d total Jan 2024: 1,882 Mbbl/d total Feb 2024: 1,872 Mbbl/d total Mar 2024: 1,864 Mbbl/d total Apr 2024: 1,834 Mbbl/d total May 2024: 1,834 Mbbl/d total Jun 2024: 1,840 Mbbl/d total Jul 2024: 1,832 Mbbl/d total Aug 2024: 1,836 Mbbl/d total Sep 2024: 1,822 Mbbl/d total Oct 2024: 1,788 Mbbl/d total Nov 2024: 1,747 Mbbl/d total Dec 2024: 1,697 Mbbl/d total Jan 2025: 1,673 Mbbl/d total Feb 2025: 1,699 Mbbl/d total Mar 2025: 1,692 Mbbl/d total Apr 2025: 1,710 Mbbl/d total May 2025: 1,711 Mbbl/d total Jun 2025: 1,722 Mbbl/d total Jul 2025: 1,745 Mbbl/d total Aug 2025: 1,739 Mbbl/d total Sep 2025: 1,750 Mbbl/d total Oct 2025: 1,743 Mbbl/d total Nov 2025: 1,747 Mbbl/d total Dec 2025: 1,764 Mbbl/d total Jan 2026: 1,751 Mbbl/d total Feb 2026: 1,746 Mbbl/d total Mar 2026: 1,744 Mbbl/d total Apr 2026: 1,748 Mbbl/d total May 2026: 1,761 Mbbl/d total Jun 2026: 1,770 Mbbl/d total Jul 2026: 1,771 Mbbl/d total Aug 2026: 1,729 Mbbl/d total Sep 2026: 1,705 Mbbl/d total Oct 2026: ≈1,748 Mbbl/d total (<1% arrived, remainder estimated) Nov 2026: ≈1,749 Mbbl/d total (<1% arrived, remainder estimated)

All from what the source published. 50.9% held at well grain.

How the volume breaks down
  • 50.9% Reported by the official source by well
  • 49.1% Reported by the official source as a lease, facility, field or state total. Published without per-well detail.

Every barrel through September 2026 starts from what the official source published for those months. Measured over January 1960 to September 2026.

The gray “without per-well detail” band is volume the source reports above the well: fields, facilities, or leases the source publishes as one total. It is included so the stack still sums to the whole entity.

Mexico natural gas production (Bcf/d, grouped by when each well first produced)
  • filling in (est. · unconfirmed) . Hatching marks our estimate of the volume still to be filed. That estimate draws on our own production forecast. This estimate is published unconfirmed. It updates as filings arrive
Mexico natural gas production: billion cubic feet per day, by first-production vintage filed in full 246 Bcf/d 2017201820192020202120222023202420252026 Dec 2016: 5.33 Bcf/d total Jan 2017: 5.28 Bcf/d total Feb 2017: 5.25 Bcf/d total Mar 2017: 5.34 Bcf/d total Apr 2017: 5.28 Bcf/d total May 2017: 5.25 Bcf/d total Jun 2017: 5.21 Bcf/d total Jul 2017: 5.17 Bcf/d total Aug 2017: 4.99 Bcf/d total Sep 2017: 4.27 Bcf/d total Oct 2017: 4.72 Bcf/d total Nov 2017: 4.76 Bcf/d total Dec 2017: 4.78 Bcf/d total Jan 2018: 4.88 Bcf/d total Feb 2018: 4.82 Bcf/d total Mar 2018: 4.62 Bcf/d total Apr 2018: 4.84 Bcf/d total May 2018: 4.8 Bcf/d total Jun 2018: 4.82 Bcf/d total Jul 2018: 4.83 Bcf/d total Aug 2018: 4.88 Bcf/d total Sep 2018: 4.89 Bcf/d total Oct 2018: 4.87 Bcf/d total Nov 2018: 4.75 Bcf/d total Dec 2018: 4.86 Bcf/d total Jan 2019: 4.63 Bcf/d total Feb 2019: 4.85 Bcf/d total Mar 2019: 4.83 Bcf/d total Apr 2019: 4.8 Bcf/d total May 2019: 4.82 Bcf/d total Jun 2019: 4.82 Bcf/d total Jul 2019: 4.87 Bcf/d total Aug 2019: 4.92 Bcf/d total Sep 2019: 5 Bcf/d total Oct 2019: 4.95 Bcf/d total Nov 2019: 5 Bcf/d total Dec 2019: 5.01 Bcf/d total Jan 2020: 4.98 Bcf/d total Feb 2020: 4.93 Bcf/d total Mar 2020: 4.92 Bcf/d total Apr 2020: 4.81 Bcf/d total May 2020: 4.45 Bcf/d total Jun 2020: 4.74 Bcf/d total Jul 2020: 4.89 Bcf/d total Aug 2020: 4.91 Bcf/d total Sep 2020: 4.92 Bcf/d total Oct 2020: 4.92 Bcf/d total Nov 2020: 4.75 Bcf/d total Dec 2020: 4.84 Bcf/d total Jan 2021: 4.84 Bcf/d total Feb 2021: 4.84 Bcf/d total Mar 2021: 4.83 Bcf/d total Apr 2021: 4.67 Bcf/d total May 2021: 4.73 Bcf/d total Jun 2021: 4.72 Bcf/d total Jul 2021: 4.71 Bcf/d total Aug 2021: 4.65 Bcf/d total Sep 2021: 4.74 Bcf/d total Oct 2021: 4.71 Bcf/d total Nov 2021: 4.75 Bcf/d total Dec 2021: 4.7 Bcf/d total Jan 2022: 4.73 Bcf/d total Feb 2022: 4.67 Bcf/d total Mar 2022: 4.8 Bcf/d total Apr 2022: 4.76 Bcf/d total May 2022: 4.74 Bcf/d total Jun 2022: 4.79 Bcf/d total Jul 2022: 4.86 Bcf/d total Aug 2022: 4.84 Bcf/d total Sep 2022: 4.84 Bcf/d total Oct 2022: 4.84 Bcf/d total Nov 2022: 4.89 Bcf/d total Dec 2022: 4.89 Bcf/d total Jan 2023: 4.98 Bcf/d total Feb 2023: 5 Bcf/d total Mar 2023: 5.06 Bcf/d total Apr 2023: 5.12 Bcf/d total May 2023: 5.06 Bcf/d total Jun 2023: 5.07 Bcf/d total Jul 2023: 4.97 Bcf/d total Aug 2023: 4.99 Bcf/d total Sep 2023: 5.01 Bcf/d total Oct 2023: 4.97 Bcf/d total Nov 2023: 4.91 Bcf/d total Dec 2023: 4.81 Bcf/d total Jan 2024: 4.8 Bcf/d total Feb 2024: 4.8 Bcf/d total Mar 2024: 4.78 Bcf/d total Apr 2024: 4.51 Bcf/d total May 2024: 4.5 Bcf/d total Jun 2024: 4.62 Bcf/d total Jul 2024: 4.58 Bcf/d total Aug 2024: 4.55 Bcf/d total Sep 2024: 4.53 Bcf/d total Oct 2024: 4.52 Bcf/d total Nov 2024: 4.45 Bcf/d total Dec 2024: 4.42 Bcf/d total Jan 2025: 4.38 Bcf/d total Feb 2025: 4.44 Bcf/d total Mar 2025: 4.45 Bcf/d total Apr 2025: 4.51 Bcf/d total May 2025: 4.56 Bcf/d total Jun 2025: 4.57 Bcf/d total Jul 2025: 4.62 Bcf/d total Aug 2025: 4.61 Bcf/d total Sep 2025: 4.75 Bcf/d total Oct 2025: 4.79 Bcf/d total Nov 2025: 4.78 Bcf/d total Dec 2025: 4.82 Bcf/d total Jan 2026: 4.85 Bcf/d total Feb 2026: 4.84 Bcf/d total Mar 2026: 4.88 Bcf/d total Apr 2026: 4.91 Bcf/d total May 2026: 4.96 Bcf/d total Jun 2026: 4.98 Bcf/d total Jul 2026: 5.02 Bcf/d total Aug 2026: 5 Bcf/d total Sep 2026: 5.08 Bcf/d total Oct 2026: ≈5.03 Bcf/d total (<1% arrived, remainder estimated) Nov 2026: ≈5.07 Bcf/d total (<1% arrived, remainder estimated)

All from what the source published. 56.6% held at well grain.

How the volume breaks down
  • 56.6% Reported by the official source by well
  • 43.4% Reported by the official source as a lease, facility, field or state total. Published without per-well detail.

Every cubic foot through September 2026 starts from what the official source published for those months. Measured over January 1960 to September 2026.

The gray “without per-well detail” band is volume the source reports above the well: fields, facilities, or leases the source publishes as one total. It is included so the stack still sums to the whole entity.

The bands group wells by when they first produced.

About this chart

The stack shows what is holding today's rate up and how much of it is new drilling. In the reported months the bands draw the filings already in. The months still filling in are marked.

Annual table (full history)

best estimate incl. unsplit totals

YearOil (MMbbl)Gas produced (Bcf)
2025629.51,682
2024666.31,679
2023706.61,823
2022672.81,754
2021649.71,730
2020630.11,771
2019622.31,779
2018668.41,759
2017711.11,834
2016788.42,095
2015832.92,336
2014891.32,383
2013923.42,322
2012935.32,333
2011934.32,403
2010942.22,556
2009950.92,561
20081,020.72,526
20071,121.62,204
20061,187.61,949
20051,216.71,750
20041,238.21,667
20031,231.31,639
20021,159.21,613
20011,141.51,645
20001,103.31,711
19991,060.71,749
19981,120.71,749
19971,103.11,631
19961,046.11,535
1995955.31,372
1994980.11,323
1993975.81,305
1992976.41,312
1991976.71,326
1990930.01,333
1989917.41,304
1988917.11,273
1987927.31,277
1986886.11,252
1985960.11,315
1984982.51,374
1983972.91,480
19821,002.41,550
1981843.91,482
1980708.51,299
1979533.31,065
1978441.4935
1977357.9747
1976293.1772
1975261.5783
1974209.8741
1973164.9675
1972161.3658
1971155.4641
1970156.3665
1969149.6603
1968142.2572
1967132.9568
1966120.9524
1965117.9488
1964115.6480
1963114.8396
1962111.8365
1961106.8355
196099.0335

Source: CommoVision (commovision.com)

Monthly table (last 24 months)
MonthOil (Mbbl)Gas produced (MMcf)
2026-0951,152.7152,376
2026-0853,583.7155,051
2026-0754,892.8155,534
2026-0653,112.6149,441
2026-0554,580.9153,828
2026-0452,451.3147,242
2026-0354,077.5151,251
2026-0248,884.7135,362
2026-0154,291.5150,264
2025-1254,678.8149,369
2025-1152,400.6143,416
2025-1054,019.6148,409
2025-0952,486.8142,412
2025-0853,912.5142,965
2025-0754,088.4143,234
2025-0651,647.8137,094
2025-0553,039.3141,300
2025-0451,290.1135,426
2025-0352,450.1138,011
2025-0247,565.5124,327
2025-0151,875.0135,687
2024-1252,616.5136,836
2024-1152,410.5133,374
2024-1055,420.4140,041

Source: CommoVision (commovision.com)

Source: CommoVision · Mexico, data through September 2026.

Well map

A map of 18,725 well locations in Mexico for which CommoVision holds a published surface coordinate, each drawn where it is and colored by its primary product (green for oil, red for natural gas, gray where undetermined; a spot shared by more than one product shows the one with the most wells there), on a ground of land and water over faint country, state and county outlines and place names for orientation, with a small inset map locating this frame in the Americas.
  • Oil 12,109
  • Natural gas 6,616
18,725 well locations in Mexico, colored by primary product.
About this map

Undetermined means not enough signal to settle it. Producing wells are the ones that reported oil or gas in the 12 months to Sep 2026.

1,705.1 Mbbl/d Sep 2026 oil production -2.5% vs Sep last year
5.08 Bcf/d Sep 2026 gas production +7% vs Sep last year
1,724.5 Mbbl/d 2025 oil production
4.61 Bcf/d 2025 gas production
7,855 wells Producing wells tracked 12 months to Sep 2026

Type curves

Mexico oil type curves (bbl/d per well, log scale, against months on production; cohorts 2010–2026)
Mexico oil type curves: average barrels per day per well on a log scale against months on production 2010-2014: 4,782 wells in curve; starts at 171 bbl/d per well, 589 Mbbl cumulative through month 142 (100% of its wells old enough at that month); the dashed curve runs through month 202, on our forecast where a well’s own record ends2015: 298 wells in curve; starts at 415 bbl/d per well, 1,586 Mbbl cumulative through month 130 (100% of its wells old enough at that month); the dashed curve runs through month 190, on our forecast where a well’s own record ends2016: 148 wells in curve; starts at 661 bbl/d per well, 2,511 Mbbl cumulative through month 118 (100% of its wells old enough at that month); the dashed curve runs through month 178, on our forecast where a well’s own record ends2017: 65 wells in curve; starts at 806 bbl/d per well, 3,217 Mbbl cumulative through month 106 (100% of its wells old enough at that month); the dashed curve runs through month 166, on our forecast where a well’s own record ends2018: 154 wells in curve; starts at 399 bbl/d per well, 1,156 Mbbl cumulative through month 94 (100% of its wells old enough at that month); the dashed curve runs through month 154, on our forecast where a well’s own record ends2019: 228 wells in curve; starts at 548 bbl/d per well, 1,501 Mbbl cumulative through month 82 (100% of its wells old enough at that month); the dashed curve runs through month 142, on our forecast where a well’s own record ends2020: 177 wells in curve; starts at 915 bbl/d per well, 2,356 Mbbl cumulative through month 70 (100% of its wells old enough at that month); the dashed curve runs through month 130, on our forecast where a well’s own record ends2021: 165 wells in curve; starts at 960 bbl/d per well, 2,412 Mbbl cumulative through month 58 (100% of its wells old enough at that month); the dashed curve runs through month 118, on our forecast where a well’s own record ends2022: 188 wells in curve; starts at 965 bbl/d per well, 1,878 Mbbl cumulative through month 46 (100% of its wells old enough at that month); the dashed curve runs through month 106, on our forecast where a well’s own record ends2023: 199 wells in curve; starts at 799 bbl/d per well, 1,240 Mbbl cumulative through month 34 (100% of its wells old enough at that month); the dashed curve runs through month 94, on our forecast where a well’s own record ends2024: 125 wells in curve; starts at 1,128 bbl/d per well, 1,150 Mbbl cumulative through month 22 (100% of its wells old enough at that month); the dashed curve runs through month 82, on our forecast where a well’s own record ends2025: 97 wells in curve; starts at 759 bbl/d per well, 548 Mbbl cumulative through month 10 (100% of its wells old enough at that month); the dashed curve runs through month 70, on our forecast where a well’s own record ends2026: 101 wells in curve; starts at 639 bbl/d per well, 19.4 Mbbl cumulative through month 1 (100% of its wells old enough at that month); the dashed curve runs through month 61, on our forecast where a well’s own record ends20501002005001,0002,0003,000bbl/d24487296120144168192216Months on production
Mexico natural gas type curves (Mcf/d per well, log scale, against months on production; cohorts 2010–2026)
Mexico natural gas type curves: average thousand cubic feet per day per well on a log scale against months on production 2010-2014: 4,782 wells in curve; starts at 445 Mcf/d per well, 1.5 Bcf cumulative through month 142 (100% of its wells old enough at that month); the dashed curve runs through month 202, on our forecast where a well’s own record ends2015: 298 wells in curve; starts at 797 Mcf/d per well, 3.5 Bcf cumulative through month 130 (100% of its wells old enough at that month); the dashed curve runs through month 190, on our forecast where a well’s own record ends2016: 148 wells in curve; starts at 766 Mcf/d per well, 3.1 Bcf cumulative through month 118 (100% of its wells old enough at that month); the dashed curve runs through month 178, on our forecast where a well’s own record ends2017: 65 wells in curve; starts at 542 Mcf/d per well, 3.3 Bcf cumulative through month 106 (100% of its wells old enough at that month); the dashed curve runs through month 166, on our forecast where a well’s own record ends2018: 154 wells in curve; starts at 400 Mcf/d per well, 2.2 Bcf cumulative through month 94 (100% of its wells old enough at that month); the dashed curve runs through month 154, on our forecast where a well’s own record ends2019: 228 wells in curve; starts at 587 Mcf/d per well, 2.8 Bcf cumulative through month 82 (100% of its wells old enough at that month); the dashed curve runs through month 142, on our forecast where a well’s own record ends2020: 177 wells in curve; starts at 1,111 Mcf/d per well, 4.3 Bcf cumulative through month 70 (100% of its wells old enough at that month); the dashed curve runs through month 130, on our forecast where a well’s own record ends2021: 165 wells in curve; starts at 1,054 Mcf/d per well, 4.7 Bcf cumulative through month 58 (100% of its wells old enough at that month); the dashed curve runs through month 118, on our forecast where a well’s own record ends2022: 188 wells in curve; starts at 1,849 Mcf/d per well, 4.0 Bcf cumulative through month 46 (100% of its wells old enough at that month); the dashed curve runs through month 106, on our forecast where a well’s own record ends2023: 199 wells in curve; starts at 1,260 Mcf/d per well, 2.3 Bcf cumulative through month 34 (100% of its wells old enough at that month); the dashed curve runs through month 94, on our forecast where a well’s own record ends2024: 125 wells in curve; starts at 2,305 Mcf/d per well, 2.7 Bcf cumulative through month 22 (100% of its wells old enough at that month); the dashed curve runs through month 82, on our forecast where a well’s own record ends2025: 97 wells in curve; starts at 1,907 Mcf/d per well, 1.7 Bcf cumulative through month 10 (100% of its wells old enough at that month); the dashed curve runs through month 70, on our forecast where a well’s own record ends2026: 101 wells in curve; starts at 2,593 Mcf/d per well, 0.1 Bcf cumulative through month 1 (100% of its wells old enough at that month); the dashed curve runs through month 61, on our forecast where a well’s own record ends701002005001,0002,0005,00010,000Mcf/d24487296120144168192216Months on production

Average production per well, for wells grouped by when they first produced.

How these curves are built

Average daily production per well, for wells grouped by when they first produced. Includes every well of the cohort that is old enough at each month. Wells that are shut in or have stopped producing count as zero, so the average reflects the full cohort, not just survivors. Rates are calendar-day (volume ÷ days in month). The cumulative axis accumulates those same monthly averages at the average month length. Months not yet fully reported are excluded. The 2010-2014 curve draws those years as one group. The chart opens on average daily rate against months on production, the rate on a log scale. The view control switches to rate against cumulative production per well, on the same log rate scale, or to cumulative production per well against months on production, on a linear scale. Every view draws the same cohorts from the same production history. Each cohort is solid through the last month all the wells in its curve sit inside fully reported data. Past it the dashed curve carries the same wells forward, on our forecast where a well’s own record ends, for up to five years. A dashed curve runs as far as at least nine in ten of its wells are accounted for. A well that is old enough but shut in still counts, as zero. The measured months are what these wells reported. In the forward months each well counts its own reported figure for each month it has one, our forecast for each month it has only that, and zero for the rest. The forward average counts every well in the curve. The drawn forecast runs up to five years past the measured months. Line thickness tracks the size of each cohort. 6,389 wells are counted here but not shown on the age axis: they started producing in 2002 or earlier, too close to the start of our records for their region to verify their true age.

Cohort summary table
First produced Wells in curve Peak oil (bbl/d per well) Month-12 oil (bbl/d per well) Cum oil in series (Mbbl per well) Peak gas (Mcf/d per well) Month-12 gas (Mcf/d per well) Cum gas in series (Bcf per well) Months in series Wells old enough at last month in series Forecast months drawn
2026 101 639 — 19.4 2,593 — 0.1 1 100% 60
2025 97 1,980 — 548 6,870 — 1.7 10 100% 60
2024 125 2,052 1,695 1,150 4,377 3,918 2.7 22 100% 60
2023 199 1,756 1,336 1,240 2,926 2,421 2.3 34 100% 60
2022 188 2,219 1,789 1,878 4,400 3,540 4.0 46 100% 60
2021 165 2,301 1,780 2,412 3,706 3,540 4.7 58 100% 60
2020 177 1,909 1,481 2,356 2,639 2,438 4.3 70 100% 60
2019 228 1,047 962 1,501 1,548 1,512 2.8 82 100% 60
2018 154 949 731 1,156 1,204 1,021 2.2 94 100% 60
2017 65 2,670 2,201 3,217 2,379 2,088 3.3 106 100% 60
2016 148 1,424 1,335 2,511 1,744 1,338 3.1 118 100% 60
2015 298 979 805 1,586 1,914 1,649 3.5 130 100% 60
2010-2014 4,782 381 320 589 884 751 1.5 142 100% 60

Source: CommoVision (commovision.com)

Source: CommoVision · Mexico type curves, per-well production by first-production cohort.

Top operators in Mexico, 2025

  1. Petróleos Mexicanos 93.5%
  2. Eni S.p.A. 3.1%
  3. Pan American Energy 1.0%
  4. Perenco 0.7%
  5. Lukoil 0.7%
  6. Petrolera Cárdenas Mora 0.2%
  7. Grupo Diavaz 0.2%
  8. Harbour Energy plc 0.2%
  9. Servicios de Extracción Petrolera Lifting de México 0.1%
  10. Servicios Múltiples de Burgos 0.1%
  11. 10 other operators 0.1%
  12. Without a named operator 0.1%
Top operators in Mexico, 2025: full table
OperatorOil (Mbbl/d, 2025)Gas produced (MMcf/d, 2025)Share of output
Petróleos Mexicanos 1,602.94,456.293.5%
Eni S.p.A. 61.030.13.1%
Pan American Energy 19.47.51.0%
Perenco 13.919.40.7%
Lukoil 12.119.40.7%
Petrolera Cárdenas Mora 3.38.60.2%
Grupo Diavaz 3.63.50.2%
Harbour Energy plc 3.37.90.2%
Servicios de Extracción Petrolera Lifting de México 1.61.90.1%
Servicios Múltiples de Burgos 0.026.00.1%
10 other operators 1.224.30.1%
Without a named operator 2.12.40.1%

Mbbl/d = thousand barrels per day · MMcf/d = million cubic feet per day (units).

Source: CommoVision (commovision.com)

Active drilling rigs

30 rigs active on average in Oct 2026
+6 rigs vs a year earlier
67 rigs peak month, Jun 2023 (since Oct 2016)
Active drilling rigs by rig type (rigs, monthly average)Source: Baker Hughes
Oil Gas Miscellaneous
Active drilling rigs by rig type: rigs, monthly average 20 40 60 80 rigs 2017201820192020202120222023202420252026 Oct 2016: 21 rigs on average (Oil 19, Gas 1, Miscellaneous 1) Nov 2016: 18 rigs on average (Oil 17, Gas 1, Miscellaneous 0) Dec 2016: 19 rigs on average (Oil 19, Gas 0, Miscellaneous 0) Jan 2017: 16 rigs on average (Oil 15, Gas 1, Miscellaneous 0) Feb 2017: 16 rigs on average (Oil 15, Gas 1, Miscellaneous 0) Mar 2017: 18 rigs on average (Oil 17, Gas 1, Miscellaneous 0) Apr 2017: 22 rigs on average (Oil 21, Gas 1, Miscellaneous 0) May 2017: 23 rigs on average (Oil 23, Gas 0, Miscellaneous 0) Jun 2017: 24 rigs on average (Oil 24, Gas 0, Miscellaneous 0) Jul 2017: 21 rigs on average (Oil 21, Gas 0, Miscellaneous 0) Aug 2017: 18 rigs on average (Oil 18, Gas 0, Miscellaneous 0) Sep 2017: 15 rigs on average (Oil 15, Gas 0, Miscellaneous 0) Oct 2017: 12 rigs on average (Oil 12, Gas 0, Miscellaneous 0) Nov 2017: 9 rigs on average (Oil 9, Gas 0, Miscellaneous 0) Dec 2017: 15 rigs on average (Oil 15, Gas 0, Miscellaneous 0) Jan 2018: 18 rigs on average (Oil 18, Gas 0, Miscellaneous 0) Feb 2018: 19 rigs on average (Oil 19, Gas 0, Miscellaneous 0) Mar 2018: 21 rigs on average (Oil 21, Gas 0, Miscellaneous 0) Apr 2018: 25 rigs on average (Oil 25, Gas 0, Miscellaneous 0) May 2018: 23 rigs on average (Oil 23, Gas 0, Miscellaneous 0) Jun 2018: 26 rigs on average (Oil 26, Gas 0, Miscellaneous 0) Jul 2018: 28 rigs on average (Oil 28, Gas 0, Miscellaneous 0) Aug 2018: 29 rigs on average (Oil 29, Gas 0, Miscellaneous 0) Sep 2018: 33 rigs on average (Oil 33, Gas 0, Miscellaneous 0) Oct 2018: 35 rigs on average (Oil 35, Gas 0, Miscellaneous 0) Nov 2018: 31 rigs on average (Oil 31, Gas 0, Miscellaneous 0) Dec 2018: 31 rigs on average (Oil 31, Gas 0, Miscellaneous 0) Jan 2019: 25 rigs on average (Oil 25, Gas 0, Miscellaneous 0) Feb 2019: 24 rigs on average (Oil 24, Gas 0, Miscellaneous 0) Mar 2019: 30 rigs on average (Oil 30, Gas 0, Miscellaneous 0) Apr 2019: 35 rigs on average (Oil 35, Gas 0, Miscellaneous 0) May 2019: 34 rigs on average (Oil 33, Gas 0, Miscellaneous 1) Jun 2019: 32 rigs on average (Oil 32, Gas 0, Miscellaneous 0) Jul 2019: 37 rigs on average (Oil 37, Gas 0, Miscellaneous 0) Aug 2019: 33 rigs on average (Oil 33, Gas 0, Miscellaneous 0) Sep 2019: 44 rigs on average (Oil 44, Gas 0, Miscellaneous 0) Oct 2019: 45 rigs on average (Oil 45, Gas 0, Miscellaneous 0) Nov 2019: 50 rigs on average (Oil 50, Gas 0, Miscellaneous 0) Dec 2019: 49 rigs on average (Oil 49, Gas 0, Miscellaneous 0) Jan 2020: 46 rigs on average (Oil 46, Gas 0, Miscellaneous 0) Feb 2020: 49 rigs on average (Oil 49, Gas 0, Miscellaneous 0) Mar 2020: 42 rigs on average (Oil 42, Gas 0, Miscellaneous 0) Apr 2020: 46 rigs on average (Oil 46, Gas 0, Miscellaneous 0) May 2020: 42 rigs on average (Oil 41, Gas 1, Miscellaneous 0) Jun 2020: 40 rigs on average (Oil 39, Gas 1, Miscellaneous 0) Jul 2020: 38 rigs on average (Oil 38, Gas 0, Miscellaneous 0) Aug 2020: 35 rigs on average (Oil 35, Gas 0, Miscellaneous 0) Sep 2020: 36 rigs on average (Oil 36, Gas 0, Miscellaneous 0) Oct 2020: 36 rigs on average (Oil 36, Gas 0, Miscellaneous 0) Nov 2020: 37 rigs on average (Oil 37, Gas 0, Miscellaneous 0) Dec 2020: 41 rigs on average (Oil 41, Gas 0, Miscellaneous 0) Jan 2021: 47 rigs on average (Oil 47, Gas 0, Miscellaneous 0) Feb 2021: 46 rigs on average (Oil 46, Gas 0, Miscellaneous 0) Mar 2021: 44 rigs on average (Oil 44, Gas 0, Miscellaneous 0) Apr 2021: 41 rigs on average (Oil 41, Gas 0, Miscellaneous 0) May 2021: 40 rigs on average (Oil 40, Gas 0, Miscellaneous 0) Jun 2021: 45 rigs on average (Oil 45, Gas 0, Miscellaneous 0) Jul 2021: 43 rigs on average (Oil 43, Gas 0, Miscellaneous 0) Aug 2021: 43 rigs on average (Oil 43, Gas 0, Miscellaneous 0) Sep 2021: 42 rigs on average (Oil 42, Gas 0, Miscellaneous 0) Oct 2021: 49 rigs on average (Oil 49, Gas 0, Miscellaneous 0) Nov 2021: 48 rigs on average (Oil 48, Gas 0, Miscellaneous 0) Dec 2021: 47 rigs on average (Oil 47, Gas 0, Miscellaneous 0) Jan 2022: 45 rigs on average (Oil 45, Gas 0, Miscellaneous 0) Feb 2022: 44 rigs on average (Oil 44, Gas 0, Miscellaneous 0) Mar 2022: 44 rigs on average (Oil 44, Gas 0, Miscellaneous 0) Apr 2022: 44 rigs on average (Oil 44, Gas 0, Miscellaneous 0) May 2022: 43 rigs on average (Oil 43, Gas 0, Miscellaneous 0) Jun 2022: 46 rigs on average (Oil 46, Gas 0, Miscellaneous 0) Jul 2022: 45 rigs on average (Oil 45, Gas 0, Miscellaneous 0) Aug 2022: 48 rigs on average (Oil 48, Gas 0, Miscellaneous 0) Sep 2022: 51 rigs on average (Oil 51, Gas 0, Miscellaneous 0) Oct 2022: 54 rigs on average (Oil 54, Gas 0, Miscellaneous 0) Nov 2022: 50 rigs on average (Oil 50, Gas 0, Miscellaneous 0) Dec 2022: 47 rigs on average (Oil 47, Gas 0, Miscellaneous 0) Jan 2023: 49 rigs on average (Oil 49, Gas 0, Miscellaneous 0) Feb 2023: 46 rigs on average (Oil 46, Gas 0, Miscellaneous 0) Mar 2023: 50 rigs on average (Oil 50, Gas 0, Miscellaneous 0) Apr 2023: 48 rigs on average (Oil 47, Gas 1, Miscellaneous 0) May 2023: 64 rigs on average (Oil 63, Gas 1, Miscellaneous 0) Jun 2023: 67 rigs on average (Oil 66, Gas 1, Miscellaneous 0) Jul 2023: 56 rigs on average (Oil 55, Gas 1, Miscellaneous 0) Aug 2023: 51 rigs on average (Oil 51, Gas 0, Miscellaneous 0) Sep 2023: 56 rigs on average (Oil 56, Gas 0, Miscellaneous 0) Oct 2023: 58 rigs on average (Oil 58, Gas 0, Miscellaneous 0) Nov 2023: 59 rigs on average (Oil 59, Gas 0, Miscellaneous 0) Dec 2023: 60 rigs on average (Oil 60, Gas 0, Miscellaneous 0) Jan 2024: 57 rigs on average (Oil 57, Gas 0, Miscellaneous 0) Feb 2024: 57 rigs on average (Oil 57, Gas 0, Miscellaneous 0) Mar 2024: 59 rigs on average (Oil 59, Gas 0, Miscellaneous 0) Apr 2024: 53 rigs on average (Oil 53, Gas 0, Miscellaneous 0) May 2024: 47 rigs on average (Oil 47, Gas 0, Miscellaneous 0) Jun 2024: 49 rigs on average (Oil 49, Gas 0, Miscellaneous 0) Jul 2024: 50 rigs on average (Oil 50, Gas 0, Miscellaneous 0) Aug 2024: 49 rigs on average (Oil 49, Gas 0, Miscellaneous 0) Sep 2024: 48 rigs on average (Oil 48, Gas 0, Miscellaneous 0) Oct 2024: 50 rigs on average (Oil 50, Gas 0, Miscellaneous 0) Nov 2024: 45 rigs on average (Oil 45, Gas 0, Miscellaneous 0) Dec 2024: 34 rigs on average (Oil 34, Gas 0, Miscellaneous 0) Jan 2025: 24 rigs on average (Oil 24, Gas 0, Miscellaneous 0) Feb 2025: 19 rigs on average (Oil 19, Gas 0, Miscellaneous 0) Mar 2025: 19 rigs on average (Oil 19, Gas 0, Miscellaneous 0) Apr 2025: 20 rigs on average (Oil 20, Gas 0, Miscellaneous 0) May 2025: 25 rigs on average (Oil 25, Gas 0, Miscellaneous 0) Jun 2025: 27 rigs on average (Oil 27, Gas 0, Miscellaneous 0) Jul 2025: 30 rigs on average (Oil 30, Gas 0, Miscellaneous 0) Aug 2025: 28 rigs on average (Oil 28, Gas 0, Miscellaneous 0) Sep 2025: 28 rigs on average (Oil 28, Gas 0, Miscellaneous 0) Oct 2025: 24 rigs on average (Oil 24, Gas 0, Miscellaneous 0) Nov 2025: 28 rigs on average (Oil 28, Gas 0, Miscellaneous 0) Dec 2025: 28 rigs on average (Oil 28, Gas 0, Miscellaneous 0) Jan 2026: 30 rigs on average (Oil 30, Gas 0, Miscellaneous 0) Feb 2026: 31 rigs on average (Oil 31, Gas 0, Miscellaneous 0) Mar 2026: 31 rigs on average (Oil 31, Gas 0, Miscellaneous 0) Apr 2026: 28 rigs on average (Oil 28, Gas 0, Miscellaneous 0) May 2026: 22 rigs on average (Oil 22, Gas 0, Miscellaneous 0) Jun 2026: 27 rigs on average (Oil 27, Gas 0, Miscellaneous 0) Jul 2026: 26 rigs on average (Oil 26, Gas 0, Miscellaneous 0) Aug 2026: 30 rigs on average (Oil 30, Gas 0, Miscellaneous 0) Sep 2026: 33 rigs on average (Oil 33, Gas 0, Miscellaneous 0) Oct 2026: 30 rigs on average (Oil 30, Gas 0, Miscellaneous 0)

Interactive chart. Focus it and use the left and right arrow keys to read each month, Page Up and Page Down to move a year, Home and End for the ends of the series. The full figures are also in the table below.

  • In Mexico, an average of 30 drilling rigs were active in Oct 2026 (6 more than a year earlier).
  • Since Oct 2016, the monthly average peaked at 67 in Jun 2023.
Average active rigs per month: full table
Month Oil-directedGas-directedMiscellaneousAll rigs
Oct 2026300030
Sep 2026330033
Aug 2026300030
Jul 2026260026
Jun 2026270027
May 2026220022
Apr 2026280028
Mar 2026310031
Feb 2026310031
Jan 2026300030
Dec 2025280028
Nov 2025280028
Oct 2025240024
Sep 2025280028
Aug 2025280028
Jul 2025300030
Jun 2025270027
May 2025250025
Apr 2025200020
Mar 2025190019
Feb 2025190019
Jan 2025240024
Dec 2024340034
Nov 2024450045

Source: CommoVision (commovision.com)

What each region has actually reported

Mexico: every reporting region we publish, largest first. What it has reported and how far it is complete. Rates are for each region's newest complete month, so they are comparable across regions even though the months differ.

RegionOil (Mbbl/d)Gas produced (MMcf/d)Complete throughNewest month reported
Mexico 1,705.15,079.22026-092026-09

What we cover here

Each row names the grain a region’s production is held at. Where a source publishes at a coarser grain, the page says so.

DataGrainSinceBenchmark
Mexico production field + well 1960-01 —

Coverage rows for Mexico are regenerated at every build from the same catalog of sources the data is built from.

What the data shows

  • Mexico produced 629.5 MMbbl of oil and 1.68 Tcf of natural gas in 2025.
  • Mexico oil production peaked in 2004 at 1.24 Bbbl; 2025 output of 629.5 MMbbl ran at 51% of that peak.
  • 7,855 producing wells tracked, 12 months to Sep 2026.

Start a free trial

Watch supply move as soon as its sources publish, with forecasts on 1.1+ million producing wells. A real API and MCP access for AI tools are live, and the Portal is open.

What the trial includes

Data use is subject to our Terms of Service.