CommoVision

See the future in real time

Supply area

Other Rockies

The Other Rockies footprint produced 15.6 MMbbl of oil and 255.3 Bcf of natural gas in 2025. 13,905 producing wells tracked, trailing 12 months per region.

  • 0.5% of the natural gas produced in the United States, 2025.
  • Natural gas production fell 8% in 2025 from 2024.
Reported production data through July 2026 · well counts as of 2026-05

A supply area is the producing region we roll every well up to, and the level supply is traded at: how each area is drawn.

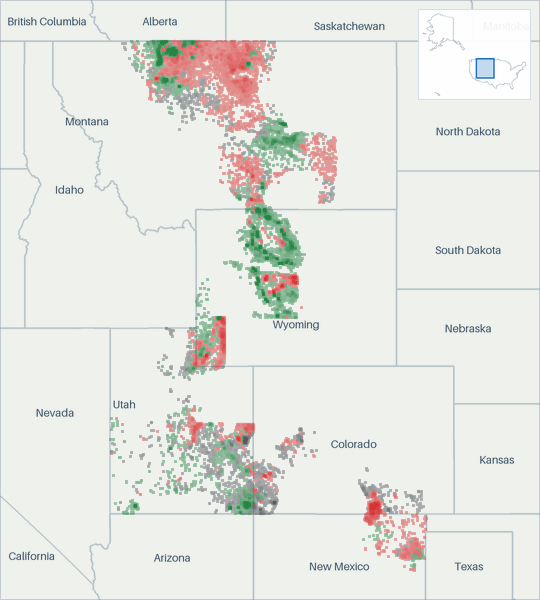
Well map of Other Rockies. The full map is further down this page.

Production

Other Rockies natural gas production (MMcf/d, grouped by when each well first produced)
  • filling in (est. · missed) . Hatching marks our estimate of the volume still to be filed. That estimate draws on our own production forecast. A check on the forecast behind this estimate measured a miss. It updates as filings arrive
Other Rockies natural gas production: million cubic feet per day, by first-production vintage filed in full today 5001,0001,5002,000 MMcf/d 2017201820192020202120222023202420252026 Aug 2016: 1,435 MMcf/d total Sep 2016: 1,422 MMcf/d total Oct 2016: 1,458 MMcf/d total Nov 2016: 1,450 MMcf/d total Dec 2016: 1,427 MMcf/d total Jan 2017: 1,392 MMcf/d total Feb 2017: 1,402 MMcf/d total Mar 2017: 1,409 MMcf/d total Apr 2017: 1,428 MMcf/d total May 2017: 1,312 MMcf/d total Jun 2017: 1,394 MMcf/d total Jul 2017: 1,399 MMcf/d total Aug 2017: 1,404 MMcf/d total Sep 2017: 1,321 MMcf/d total Oct 2017: 1,365 MMcf/d total Nov 2017: 1,414 MMcf/d total Dec 2017: 1,389 MMcf/d total Jan 2018: 1,385 MMcf/d total Feb 2018: 1,386 MMcf/d total Mar 2018: 1,384 MMcf/d total Apr 2018: 1,386 MMcf/d total May 2018: 1,357 MMcf/d total Jun 2018: 1,336 MMcf/d total Jul 2018: 1,312 MMcf/d total Aug 2018: 1,234 MMcf/d total Sep 2018: 1,329 MMcf/d total Oct 2018: 1,351 MMcf/d total Nov 2018: 1,333 MMcf/d total Dec 2018: 1,251 MMcf/d total Jan 2019: 918 MMcf/d total Feb 2019: 912 MMcf/d total Mar 2019: 866 MMcf/d total Apr 2019: 884 MMcf/d total May 2019: 864 MMcf/d total Jun 2019: 912 MMcf/d total Jul 2019: 939 MMcf/d total Aug 2019: 933 MMcf/d total Sep 2019: 927 MMcf/d total Oct 2019: 939 MMcf/d total Nov 2019: 942 MMcf/d total Dec 2019: 926 MMcf/d total Jan 2020: 914 MMcf/d total Feb 2020: 893 MMcf/d total Mar 2020: 907 MMcf/d total Apr 2020: 860 MMcf/d total May 2020: 732 MMcf/d total Jun 2020: 727 MMcf/d total Jul 2020: 800 MMcf/d total Aug 2020: 813 MMcf/d total Sep 2020: 820 MMcf/d total Oct 2020: 828 MMcf/d total Nov 2020: 816 MMcf/d total Dec 2020: 818 MMcf/d total Jan 2021: 863 MMcf/d total Feb 2021: 970 MMcf/d total Mar 2021: 901 MMcf/d total Apr 2021: 875 MMcf/d total May 2021: 867 MMcf/d total Jun 2021: 869 MMcf/d total Jul 2021: 896 MMcf/d total Aug 2021: 880 MMcf/d total Sep 2021: 912 MMcf/d total Oct 2021: 898 MMcf/d total Nov 2021: 911 MMcf/d total Dec 2021: 895 MMcf/d total Jan 2022: 851 MMcf/d total Feb 2022: 844 MMcf/d total Mar 2022: 862 MMcf/d total Apr 2022: 854 MMcf/d total May 2022: 767 MMcf/d total Jun 2022: 788 MMcf/d total Jul 2022: 864 MMcf/d total Aug 2022: 874 MMcf/d total Sep 2022: 854 MMcf/d total Oct 2022: 867 MMcf/d total Nov 2022: 854 MMcf/d total Dec 2022: 813 MMcf/d total Jan 2023: 823 MMcf/d total Feb 2023: 800 MMcf/d total Mar 2023: 797 MMcf/d total Apr 2023: 740 MMcf/d total May 2023: 799 MMcf/d total Jun 2023: 781 MMcf/d total Jul 2023: 795 MMcf/d total Aug 2023: 691 MMcf/d total Sep 2023: 694 MMcf/d total Oct 2023: 762 MMcf/d total Nov 2023: 830 MMcf/d total Dec 2023: 807 MMcf/d total Jan 2024: 783 MMcf/d total Feb 2024: 791 MMcf/d total Mar 2024: 781 MMcf/d total Apr 2024: 707 MMcf/d total May 2024: 695 MMcf/d total Jun 2024: 769 MMcf/d total Jul 2024: 742 MMcf/d total Aug 2024: 702 MMcf/d total Sep 2024: 765 MMcf/d total Oct 2024: 775 MMcf/d total Nov 2024: 774 MMcf/d total Dec 2024: 770 MMcf/d total Jan 2025: 754 MMcf/d total Feb 2025: 752 MMcf/d total Mar 2025: 755 MMcf/d total Apr 2025: 755 MMcf/d total May 2025: 756 MMcf/d total Jun 2025: 744 MMcf/d total Jul 2025: 695 MMcf/d total Aug 2025: 618 MMcf/d total Sep 2025: 525 MMcf/d total Oct 2025: 636 MMcf/d total Nov 2025: 691 MMcf/d total Dec 2025: 714 MMcf/d total Jan 2026: 733 MMcf/d total Feb 2026: 727 MMcf/d total Mar 2026: 727 MMcf/d total Apr 2026: 585 MMcf/d total May 2026: 607 MMcf/d total Jun 2026: ≈706 MMcf/d total (99% arrived, remainder estimated) Jul 2026: ≈701 MMcf/d total (35% arrived, remainder estimated)

Still arriving: Aug 2026 <1% filed.

All from what the source published. All held at well grain.

How the volume breaks down
  • 100% Reported by the official source by well
  • under 0.01% Reported by the official source for a longer period, spread across its months. The period total is the reported number.

Every cubic foot through May 2026 starts from what the official source published for those months. Measured over January 1984 to May 2026.

Other Rockies oil production (Mbbl/d, grouped by when each well first produced)
  • filling in (est. · missed) . Hatching marks our estimate of the volume still to be filed. That estimate draws on our own production forecast. A check on the forecast behind this estimate measured a miss. It updates as filings arrive
  • estimated . Hatching marks our estimate. In the most recent months that is volume still to be filed. Past the divider it is our estimate of each whole month, built on any filings already in. Beyond the last filings it is our forecast.
Other Rockies oil production: thousand barrels per day, by first-production vintage filed in full 20406080 Mbbl/d 2017201820192020202120222023202420252026 Oct 2016: 62.9 Mbbl/d total Nov 2016: 63.1 Mbbl/d total Dec 2016: 61.5 Mbbl/d total Jan 2017: 61.2 Mbbl/d total Feb 2017: 61.6 Mbbl/d total Mar 2017: 63.1 Mbbl/d total Apr 2017: 62.6 Mbbl/d total May 2017: 62.8 Mbbl/d total Jun 2017: 62.4 Mbbl/d total Jul 2017: 61.8 Mbbl/d total Aug 2017: 62.8 Mbbl/d total Sep 2017: 61.5 Mbbl/d total Oct 2017: 62.2 Mbbl/d total Nov 2017: 62.8 Mbbl/d total Dec 2017: 62.5 Mbbl/d total Jan 2018: 61.9 Mbbl/d total Feb 2018: 61.9 Mbbl/d total Mar 2018: 61.9 Mbbl/d total Apr 2018: 61.2 Mbbl/d total May 2018: 61.6 Mbbl/d total Jun 2018: 61.5 Mbbl/d total Jul 2018: 60 Mbbl/d total Aug 2018: 61.7 Mbbl/d total Sep 2018: 61.2 Mbbl/d total Oct 2018: 61.1 Mbbl/d total Nov 2018: 60 Mbbl/d total Dec 2018: 58.3 Mbbl/d total Jan 2019: 56.5 Mbbl/d total Feb 2019: 56 Mbbl/d total Mar 2019: 57.6 Mbbl/d total Apr 2019: 56.8 Mbbl/d total May 2019: 56.8 Mbbl/d total Jun 2019: 56.3 Mbbl/d total Jul 2019: 56.2 Mbbl/d total Aug 2019: 56.2 Mbbl/d total Sep 2019: 56.5 Mbbl/d total Oct 2019: 56.4 Mbbl/d total Nov 2019: 56.1 Mbbl/d total Dec 2019: 55.2 Mbbl/d total Jan 2020: 55.1 Mbbl/d total Feb 2020: 54.7 Mbbl/d total Mar 2020: 54 Mbbl/d total Apr 2020: 43.7 Mbbl/d total May 2020: 36.9 Mbbl/d total Jun 2020: 42.9 Mbbl/d total Jul 2020: 45.3 Mbbl/d total Aug 2020: 46.6 Mbbl/d total Sep 2020: 46.6 Mbbl/d total Oct 2020: 45.7 Mbbl/d total Nov 2020: 46.4 Mbbl/d total Dec 2020: 46.3 Mbbl/d total Jan 2021: 46.5 Mbbl/d total Feb 2021: 46.6 Mbbl/d total Mar 2021: 48.1 Mbbl/d total Apr 2021: 48.4 Mbbl/d total May 2021: 48.5 Mbbl/d total Jun 2021: 47.1 Mbbl/d total Jul 2021: 47.3 Mbbl/d total Aug 2021: 47 Mbbl/d total Sep 2021: 46.7 Mbbl/d total Oct 2021: 46.8 Mbbl/d total Nov 2021: 47 Mbbl/d total Dec 2021: 46.1 Mbbl/d total Jan 2022: 45.8 Mbbl/d total Feb 2022: 45.8 Mbbl/d total Mar 2022: 46.5 Mbbl/d total Apr 2022: 46.1 Mbbl/d total May 2022: 46.7 Mbbl/d total Jun 2022: 47.3 Mbbl/d total Jul 2022: 47.3 Mbbl/d total Aug 2022: 48.2 Mbbl/d total Sep 2022: 48.6 Mbbl/d total Oct 2022: 48.4 Mbbl/d total Nov 2022: 47.3 Mbbl/d total Dec 2022: 47.4 Mbbl/d total Jan 2023: 46.6 Mbbl/d total Feb 2023: 47.2 Mbbl/d total Mar 2023: 46.6 Mbbl/d total Apr 2023: 47.4 Mbbl/d total May 2023: 48.7 Mbbl/d total Jun 2023: 47.4 Mbbl/d total Jul 2023: 47 Mbbl/d total Aug 2023: 47 Mbbl/d total Sep 2023: 45.5 Mbbl/d total Oct 2023: 46.1 Mbbl/d total Nov 2023: 46.8 Mbbl/d total Dec 2023: 46.6 Mbbl/d total Jan 2024: 45.6 Mbbl/d total Feb 2024: 45.6 Mbbl/d total Mar 2024: 46 Mbbl/d total Apr 2024: 45.7 Mbbl/d total May 2024: 45.1 Mbbl/d total Jun 2024: 44.1 Mbbl/d total Jul 2024: 45 Mbbl/d total Aug 2024: 44 Mbbl/d total Sep 2024: 44.5 Mbbl/d total Oct 2024: 44.4 Mbbl/d total Nov 2024: 44.3 Mbbl/d total Dec 2024: 43.8 Mbbl/d total Jan 2025: 43.2 Mbbl/d total Feb 2025: 43.3 Mbbl/d total Mar 2025: 43.2 Mbbl/d total Apr 2025: 43.4 Mbbl/d total May 2025: 43.3 Mbbl/d total Jun 2025: 42.8 Mbbl/d total Jul 2025: 42.1 Mbbl/d total Aug 2025: 42.8 Mbbl/d total Sep 2025: 42.1 Mbbl/d total Oct 2025: 41.4 Mbbl/d total Nov 2025: 42.1 Mbbl/d total Dec 2025: 41.8 Mbbl/d total Jan 2026: 41.8 Mbbl/d total Feb 2026: 41.6 Mbbl/d total Mar 2026: 41.7 Mbbl/d total Apr 2026: 41.7 Mbbl/d total May 2026: 38.8 Mbbl/d total Jun 2026: ≈40.2 Mbbl/d total (99% arrived, remainder estimated) Jul 2026: ≈41.7 Mbbl/d total (35% arrived, remainder estimated) Aug 2026: ≈40.8 Mbbl/d total (<1% arrived, remainder estimated) Sep 2026: ≈40.5 Mbbl/d total (<1% arrived, remainder estimated)

In this view, hatching marks our estimate, and in the most recent months that is volume still to be filed. Past the divider, the chart continues only the bands it has drawn. Each band continues as our estimate, from any filings already in and then from our forecast, built by summing our per-well forecasts. The method behind each well is recorded with the forecast. The forward months cover existing wells only. How our methods work

All from what the source published. All held at well grain.

How the volume breaks down
  • 86.2% Reported by the official source by well
  • 13.8% Reported by the official source for a longer period, spread across its months. The period total is the reported number.

Every barrel through May 2026 starts from what the official source published for those months. Measured over January 1984 to May 2026.

The bands group wells by when they first produced.

About this chart

The stack shows what is holding today's rate up and how much of it is new drilling. In the reported months the bands draw the filings already in. The months still filling in are marked.

Annual table (full history)

best estimate incl. allocated

YearOil (MMbbl)Gas produced (Bcf)
202515.6255
202416.4276
202317.1283
202217.2307
202117.2326
202017.2303
201920.6333
201822.3488
201722.7506
201623.4537
201525.5570
201426.6595
201327.5624
201227.9657
201127.3689
201027.8722
200928.0724
200828.6739
200729.2763
200629.4793
200528.7797
200429.1795
200330.1773
200231.4766
200134.1769
200036.7767
199937.6739
199840.8738
199742.7750
199643.6795
199545.2809
199447.3836
199350.1674
199283.9662
199188.5669
199091.7646
198998.4591
1988107.0576
1987110.3547
1986117.5508
1985112.3473
198487.6430

Source: CommoVision (commovision.com)

Monthly table (last 24 months)
MonthOil (Mbbl)Gas produced (MMcf)
2026-051,201.018,799
2026-041,251.117,556
2026-031,293.122,532
2026-021,164.720,366
2026-011,296.222,712
2025-121,296.822,127
2025-111,263.120,724
2025-101,283.619,712
2025-091,262.715,757
2025-081,325.419,147
2025-071,304.321,533
2025-061,283.522,325
2025-051,342.923,436
2025-041,301.822,645
2025-031,338.923,395
2025-021,213.321,068
2025-011,339.023,384
2024-121,357.823,863
2024-111,330.423,215
2024-101,375.424,027
2024-091,335.422,951
2024-081,363.821,771
2024-071,395.523,014
2024-061,322.323,084

Source: CommoVision (commovision.com)

Source: CommoVision · Other Rockies, data through July 2026.

Well map

A map of 62,948 well locations inside the Other Rockies footprint for which CommoVision holds a published surface coordinate, each drawn where it is and colored by its primary product (green for oil, red for natural gas, gray where undetermined; a spot shared by more than one product shows the one with the most wells there), on a ground of land and water over faint state and province outlines and place names for orientation, with a small inset map locating this frame in the United States.
  • Oil 28,371
  • Natural gas 23,400
  • Undetermined 11,177
62,948 well locations inside the Other Rockies footprint, colored by primary product.
About this map

Undetermined means not enough signal to settle it. Producing wells are the ones that reported oil or gas in the trailing 12 months per region.

Type curves

Other Rockies natural gas type curves (Mcf/d per well, log scale, against months on production; cohorts 2010–2026)
Other Rockies natural gas type curves: average thousand cubic feet per day per well on a log scale against months on production 2010-2014: 872 wells; starts at 304 Mcf/d per well, 0.6 Bcf cumulative through month 138 (100% of its wells old enough at that month); the dashed curve runs through month 198, on our forecast where a well’s own record ends2015: 38 wells; starts at 189 Mcf/d per well, 0.6 Bcf cumulative through month 126 (100% of its wells old enough at that month); the dashed curve runs through month 186, on our forecast where a well’s own record ends2016: 11 wells; starts at 120 Mcf/d per well, 1.2 Bcf cumulative through month 95 (100% of its wells old enough at that month)2017: 69 wells; starts at 85.1 Mcf/d per well, 0.1 Bcf cumulative through month 102 (100% of its wells old enough at that month); the dashed curve runs through month 162, on our forecast where a well’s own record ends2018: 48 wells; starts at 212 Mcf/d per well, 0.3 Bcf cumulative through month 90 (100% of its wells old enough at that month); the dashed curve runs through month 150, on our forecast where a well’s own record ends2019: 33 wells; starts at 56.5 Mcf/d per well, 0.1 Bcf cumulative through month 78 (100% of its wells old enough at that month); the dashed curve runs through month 138, on our forecast where a well’s own record ends2020: 3 wells; starts at 0.1 Mcf/d per well, 0.0 Bcf cumulative through month 67 (100% of its wells old enough at that month); the dashed curve runs through month 127, on our forecast where a well’s own record ends2021: 11 wells; starts at 405 Mcf/d per well, 0.4 Bcf cumulative through month 54 (100% of its wells old enough at that month); the dashed curve runs through month 114, on our forecast where a well’s own record ends2022: 26 wells; starts at 17.4 Mcf/d per well, 0.0 Bcf cumulative through month 43 (100% of its wells old enough at that month); the dashed curve runs through month 103, on our forecast where a well’s own record ends2023: 15 wells; starts at 19.8 Mcf/d per well, 0.0 Bcf cumulative through month 33 (100% of its wells old enough at that month); the dashed curve runs through month 93, on our forecast where a well’s own record ends2024: 9 wells; starts at 130 Mcf/d per well, 0.6 Bcf cumulative through month 21 (100% of its wells old enough at that month); the dashed curve runs through month 24, on our forecast where a well’s own record ends2025: 12 wells; starts at 720 Mcf/d per well, 0.2 Bcf cumulative through month 7 (100% of its wells old enough at that month); the dashed curve runs through month 11, on our forecast where a well’s own record ends2026: 4 wells; starts at 31 Mcf/d per well, 0.0 Bcf cumulative through month 4 (75% of its wells old enough at that month)0.11101001,000Mcf/d24487296120144168192216Months on production
Other Rockies oil type curves (bbl/d per well, log scale, against months on production; cohorts 2010–2025)
Other Rockies oil type curves: average barrels per day per well on a log scale against months on production 2010-2014: 872 wells; starts at 13.5 bbl/d per well, 22.7 Mbbl cumulative through month 138 (100% of its wells old enough at that month); the dashed curve runs through month 198, on our forecast where a well’s own record ends2015: 38 wells; starts at 26.3 bbl/d per well, 54.3 Mbbl cumulative through month 126 (100% of its wells old enough at that month); the dashed curve runs through month 186, on our forecast where a well’s own record ends2016: 11 wells; starts at 30.1 bbl/d per well, 54.4 Mbbl cumulative through month 114 (100% of its wells old enough at that month); the dashed curve runs through month 174, on our forecast where a well’s own record ends2017: 69 wells; starts at 12.9 bbl/d per well, 28.6 Mbbl cumulative through month 102 (100% of its wells old enough at that month); the dashed curve runs through month 162, on our forecast where a well’s own record ends2018: 48 wells; starts at 33.8 bbl/d per well, 42.6 Mbbl cumulative through month 90 (100% of its wells old enough at that month); the dashed curve runs through month 150, on our forecast where a well’s own record ends2019: 33 wells; starts at 30.2 bbl/d per well, 53.2 Mbbl cumulative through month 78 (100% of its wells old enough at that month); the dashed curve runs through month 138, on our forecast where a well’s own record ends2020: 3 wells; starts at 16.6 bbl/d per well, 11.2 Mbbl cumulative through month 67 (100% of its wells old enough at that month); the dashed curve runs through month 127, on our forecast where a well’s own record ends2021: 11 wells; starts at 11.6 bbl/d per well, 6.8 Mbbl cumulative through month 54 (100% of its wells old enough at that month); the dashed curve runs through month 114, on our forecast where a well’s own record ends2022: 26 wells; starts at 46.5 bbl/d per well, 25.3 Mbbl cumulative through month 43 (100% of its wells old enough at that month); the dashed curve runs through month 103, on our forecast where a well’s own record ends2023: 15 wells; starts at 34.1 bbl/d per well, 34.8 Mbbl cumulative through month 33 (100% of its wells old enough at that month); the dashed curve runs through month 93, on our forecast where a well’s own record ends2024: 9 wells; starts at 23.7 bbl/d per well, 13.4 Mbbl cumulative through month 21 (100% of its wells old enough at that month); the dashed curve runs through month 24, on our forecast where a well’s own record ends2025: 12 wells; starts at 15 bbl/d per well, 2.6 Mbbl cumulative through month 7 (100% of its wells old enough at that month); the dashed curve runs through month 11, on our forecast where a well’s own record ends0.2110100bbl/d24487296120144168192216Months on production

best estimate incl. allocated

Average production per well, for wells grouped by when they first produced.

How these curves are built

Average daily production per well, for wells grouped by when they first produced. Includes every well of the cohort that is old enough at each month. Wells that are shut in or have stopped producing count as zero, so the average reflects the full cohort, not just survivors. Rates are calendar-day (volume ÷ days in month). The cumulative axis accumulates those same monthly averages at the average month length. Months not yet fully reported are excluded. The 2010-2014 curve draws those years as one group. The chart opens on average daily rate against months on production, the rate on a log scale. The view control switches to rate against cumulative production per well, on the same log rate scale, or to cumulative production per well against months on production, on a linear scale. Every view draws the same cohorts from the same production history. Each cohort with a dashed curve is solid through the last month all of its wells sit inside fully reported data. Past it the dashed curve carries the same wells forward, on our forecast where a well’s own record ends, for up to five years. A dashed curve runs as far as at least nine in ten of its wells are accounted for. A cohort with no dashed curve is drawn only through the months where at least 30% of its wells are old enough for the month to be fully reported. A well that is old enough but shut in still counts, as zero. The measured months are what these wells reported. In the forward months each well counts its own reported figure for each month it has one, our forecast for each month it has only that, and zero for the rest. The forward average counts every well of the cohort. The drawn forecast runs up to five years past the measured months. Line thickness tracks how many wells each curve is drawn from. 12,048 wells are counted here but not shown on the age axis: they started producing in 2001 or earlier, too close to the start of our records for their region to verify their true age.

Cohort summary table
First produced Wells Peak oil (bbl/d per well) Month-12 oil (bbl/d per well) Cum oil in series (Mbbl per well) Peak gas (Mcf/d per well) Month-12 gas (Mcf/d per well) Cum gas in series (Bcf per well) Months in series Wells old enough at last month in series Forecast months drawn
2026 4 0 0.0 163 0.0 4 75%
2025 12 18.9 2.6 855 0.2 7 100% 4
2024 9 34.4 22.7 13.4 1,333 615 0.6 21 100% 3
2023 15 88.6 38.5 34.8 76.1 52.1 0.0 33 100% 60
2022 26 46.5 21.7 25.3 41.3 27.4 0.0 43 100% 60
2021 11 11.6 5.6 6.8 1,064 417 0.4 54 100% 60
2020 3 18 10.7 11.2 12.8 0 0.0 67 100% 60
2019 33 67.2 29.1 53.2 77.1 57.1 0.1 78 100% 60
2018 48 54.6 23 42.6 411 131 0.3 90 100% 60
2017 69 28.4 20.6 28.6 171 107 0.1 102 100% 60
2016 11 44.5 20.2 54.4 1,259 603 1.2 125 45% 60
2015 38 41.5 25.7 54.3 419 340 0.6 126 100% 60
2010-2014 872 21.9 11.7 22.7 395 221 0.6 138 100% 60

Source: CommoVision (commovision.com)

Source: CommoVision · Other Rockies type curves, per-well production by first-production cohort.

Top operators in the Other Rockies, 2025

  1. Merit Energy Company 15.5%
  2. Crescent Energy Company 14.6%
  3. Elk Operating Services, LLC 10.9%
  4. Occidental Petroleum 10.9%
  5. Hilcorp Energy 6.1%
  6. Evergreen Natural Resources, LLC 4.8%
  7. ExxonMobil 4.6%
  8. Wolverine Gas & Oil Company of Utah, LLC 3.1%
  9. Wapiti Operating 2.8%
  10. Citation Oil & Gas Corp. 2.1%
  11. 211 other operators 24.6%
Top operators in the Other Rockies, 2025: full table
OperatorOil (Mbbl/d, 2025)Gas produced (MMcf/d, 2025)Share of output
Merit Energy Company 13.47.115.5%
Crescent Energy Company 2.7154.614.6%
Elk Operating Services, LLC 8.026.310.9%
Occidental Petroleum 0.0145.810.9%
Hilcorp Energy 0.475.76.1%
Evergreen Natural Resources, LLC 0.064.94.8%
ExxonMobil 3.93.94.6%
Wolverine Gas & Oil Company of Utah, LLC 2.71.23.1%
Wapiti Operating 0.037.52.8%
Citation Oil & Gas Corp. 1.80.62.1%
211 other operators 9.8181.724.6%

Mbbl/d = thousand barrels per day · MMcf/d = million cubic feet per day (units).

Source: CommoVision (commovision.com)

Top counties by 2025 production

CountyOil (MMbbl)Gas produced (Bcf)Share of 2025 output
Fremont County, Wyoming2.263.121.8%
Las Animas County, Colorado0349.7%
San Juan County, Utah3.210.18.4%
Park County, Wyoming4.24.48.4%
Harding County, New Mexico028.58.2%

Share of output counts oil and gas together, gas at its market-value weight.

Recent permitting

26 permits approved in the 365 days to August 14, 2026
9 permits in the 90 days to August 14, 2026
9 new-well permits in the 90 days to August 14, 2026
August 14, 2026 latest approval on record
About this chart

Approvals of every permit type per month, the 24 months to Aug 2026. The last bar is Aug 2026 through August 14, 2026 (4 so far), drawn hatched. Of the 26 approved in the 365 days to August 14, 2026, 25 are permits to drill a new well and 1 is a recompletion permit. Permits to drill a new well: 25 in the 365 days to August 14, 2026 and 9 in the last 90 days of that window. How permits are counted.

Most permits 365 days to August 14, 2026

  1. SG Interests I 9 · 34.6%
  2. Desert Eagle Operating LLC 4 · 15.4%
  3. BNL (Enterprise) Inc 3 · 11.5%
  4. Northwestern Corporation 3 · 11.5%
  5. Citation Oil & Gas Corp. 2 · 7.7%
  • In the Other Rockies footprint, 26 well permits were approved in the 365 days to August 14, 2026. Of those, 9 came in the last 90 days of that window. The latest approval on record is dated August 14, 2026.
  • Of the 26 approved in the 365 days to August 14, 2026, 25 are permits to drill a new well and 1 is a recompletion permit. Permits to drill a new well: 25 in the 365 days to August 14, 2026 and 9 in the last 90 days of that window.
  • Permits counted here come from Colorado, Montana, Utah and Wyoming.
Well permits approved per month: full table
MonthPermits approved
Aug 2026 (through August 14, 2026)4
Jul 20262
Jun 20263
May 20263
Apr 20264
Mar 20261
Feb 20262
Jan 20260
Dec 20250
Nov 20255
Oct 20252
Sep 20250
Aug 20250
Jul 20250
Jun 20258
May 20258
Apr 20253
Mar 20253
Feb 20250
Jan 20251
Dec 20242
Nov 20246
Oct 20242
Sep 20245

Source: CommoVision (commovision.com)

Active drilling rigs

2 rigs active in the week to September 11, 2026
+2 rigs vs the same week a year earlier
5 rigs peak week, Sep 2023 (since Sep 2016)
Active drilling rigs by rig type (rigs, weekly count)Source: Baker Hughes rig count
Oil Gas Miscellaneous
Active drilling rigs by rig type: rigs, weekly count 2 4 6 rigs 2017201820192020202120222023202420252026 Week to Sep 16, 2016: 1 rig total (Oil 1, Gas 0, Miscellaneous 0) Week to Sep 23, 2016: 1 rig total (Oil 1, Gas 0, Miscellaneous 0) Week to Sep 30, 2016: 1 rig total (Oil 1, Gas 0, Miscellaneous 0) Week to Oct 7, 2016: 0 rigs total (Oil 0, Gas 0, Miscellaneous 0) Week to Oct 14, 2016: 0 rigs total (Oil 0, Gas 0, Miscellaneous 0) Week to Oct 21, 2016: 0 rigs total (Oil 0, Gas 0, Miscellaneous 0) Week to Oct 28, 2016: 0 rigs total (Oil 0, Gas 0, Miscellaneous 0) Week to Nov 4, 2016: 0 rigs total (Oil 0, Gas 0, Miscellaneous 0) Week to Nov 11, 2016: 0 rigs total (Oil 0, Gas 0, Miscellaneous 0) Week to Nov 18, 2016: 0 rigs total (Oil 0, Gas 0, Miscellaneous 0) Week to Nov 23, 2016: 0 rigs total (Oil 0, Gas 0, Miscellaneous 0) Week to Dec 2, 2016: 0 rigs total (Oil 0, Gas 0, Miscellaneous 0) Week to Dec 9, 2016: 0 rigs total (Oil 0, Gas 0, Miscellaneous 0) Week to Dec 16, 2016: 0 rigs total (Oil 0, Gas 0, Miscellaneous 0) Week to Dec 23, 2016: 0 rigs total (Oil 0, Gas 0, Miscellaneous 0) Week to Dec 30, 2016: 0 rigs total (Oil 0, Gas 0, Miscellaneous 0) Week to Jan 6, 2017: 0 rigs total (Oil 0, Gas 0, Miscellaneous 0) Week to Jan 13, 2017: 0 rigs total (Oil 0, Gas 0, Miscellaneous 0) Week to Jan 20, 2017: 0 rigs total (Oil 0, Gas 0, Miscellaneous 0) Week to Jan 27, 2017: 0 rigs total (Oil 0, Gas 0, Miscellaneous 0) Week to Feb 3, 2017: 0 rigs total (Oil 0, Gas 0, Miscellaneous 0) Week to Feb 10, 2017: 0 rigs total (Oil 0, Gas 0, Miscellaneous 0) Week to Feb 17, 2017: 0 rigs total (Oil 0, Gas 0, Miscellaneous 0) Week to Feb 24, 2017: 0 rigs total (Oil 0, Gas 0, Miscellaneous 0) Week to Mar 3, 2017: 0 rigs total (Oil 0, Gas 0, Miscellaneous 0) Week to Mar 10, 2017: 0 rigs total (Oil 0, Gas 0, Miscellaneous 0) Week to Mar 17, 2017: 0 rigs total (Oil 0, Gas 0, Miscellaneous 0) Week to Mar 24, 2017: 0 rigs total (Oil 0, Gas 0, Miscellaneous 0) Week to Mar 31, 2017: 0 rigs total (Oil 0, Gas 0, Miscellaneous 0) Week to Apr 7, 2017: 0 rigs total (Oil 0, Gas 0, Miscellaneous 0) Week to Apr 13, 2017: 0 rigs total (Oil 0, Gas 0, Miscellaneous 0) Week to Apr 21, 2017: 0 rigs total (Oil 0, Gas 0, Miscellaneous 0) Week to Apr 28, 2017: 0 rigs total (Oil 0, Gas 0, Miscellaneous 0) Week to May 5, 2017: 0 rigs total (Oil 0, Gas 0, Miscellaneous 0) Week to May 12, 2017: 0 rigs total (Oil 0, Gas 0, Miscellaneous 0) Week to May 19, 2017: 0 rigs total (Oil 0, Gas 0, Miscellaneous 0) Week to May 26, 2017: 0 rigs total (Oil 0, Gas 0, Miscellaneous 0) Week to Jun 2, 2017: 0 rigs total (Oil 0, Gas 0, Miscellaneous 0) Week to Jun 9, 2017: 1 rig total (Oil 1, Gas 0, Miscellaneous 0) Week to Jun 16, 2017: 1 rig total (Oil 1, Gas 0, Miscellaneous 0) Week to Jun 23, 2017: 1 rig total (Oil 1, Gas 0, Miscellaneous 0) Week to Jun 30, 2017: 1 rig total (Oil 1, Gas 0, Miscellaneous 0) Week to Jul 7, 2017: 0 rigs total (Oil 0, Gas 0, Miscellaneous 0) Week to Jul 14, 2017: 0 rigs total (Oil 0, Gas 0, Miscellaneous 0) Week to Jul 21, 2017: 1 rig total (Oil 0, Gas 1, Miscellaneous 0) Week to Jul 28, 2017: 2 rigs total (Oil 0, Gas 2, Miscellaneous 0) Week to Aug 4, 2017: 2 rigs total (Oil 0, Gas 2, Miscellaneous 0) Week to Aug 11, 2017: 3 rigs total (Oil 0, Gas 3, Miscellaneous 0) Week to Aug 18, 2017: 2 rigs total (Oil 0, Gas 2, Miscellaneous 0) Week to Aug 25, 2017: 2 rigs total (Oil 0, Gas 2, Miscellaneous 0) Week to Sep 1, 2017: 2 rigs total (Oil 0, Gas 2, Miscellaneous 0) Week to Sep 8, 2017: 2 rigs total (Oil 0, Gas 2, Miscellaneous 0) Week to Sep 15, 2017: 2 rigs total (Oil 0, Gas 2, Miscellaneous 0) Week to Sep 22, 2017: 2 rigs total (Oil 0, Gas 2, Miscellaneous 0) Week to Sep 29, 2017: 2 rigs total (Oil 1, Gas 1, Miscellaneous 0) Week to Oct 6, 2017: 2 rigs total (Oil 1, Gas 1, Miscellaneous 0) Week to Oct 13, 2017: 2 rigs total (Oil 1, Gas 1, Miscellaneous 0) Week to Oct 20, 2017: 2 rigs total (Oil 1, Gas 1, Miscellaneous 0) Week to Oct 27, 2017: 2 rigs total (Oil 1, Gas 1, Miscellaneous 0) Week to Nov 3, 2017: 2 rigs total (Oil 1, Gas 1, Miscellaneous 0) Week to Nov 10, 2017: 2 rigs total (Oil 1, Gas 1, Miscellaneous 0) Week to Nov 17, 2017: 3 rigs total (Oil 1, Gas 2, Miscellaneous 0) Week to Nov 22, 2017: 3 rigs total (Oil 1, Gas 2, Miscellaneous 0) Week to Dec 1, 2017: 3 rigs total (Oil 1, Gas 2, Miscellaneous 0) Week to Dec 8, 2017: 3 rigs total (Oil 1, Gas 2, Miscellaneous 0) Week to Dec 15, 2017: 3 rigs total (Oil 1, Gas 2, Miscellaneous 0) Week to Dec 22, 2017: 3 rigs total (Oil 1, Gas 2, Miscellaneous 0) Week to Dec 29, 2017: 2 rigs total (Oil 0, Gas 2, Miscellaneous 0) Week to Jan 5, 2018: 2 rigs total (Oil 0, Gas 2, Miscellaneous 0) Week to Jan 12, 2018: 2 rigs total (Oil 0, Gas 2, Miscellaneous 0) Week to Jan 19, 2018: 2 rigs total (Oil 0, Gas 2, Miscellaneous 0) Week to Jan 26, 2018: 2 rigs total (Oil 0, Gas 2, Miscellaneous 0) Week to Feb 2, 2018: 1 rig total (Oil 0, Gas 1, Miscellaneous 0) Week to Feb 9, 2018: 2 rigs total (Oil 1, Gas 1, Miscellaneous 0) Week to Feb 16, 2018: 2 rigs total (Oil 1, Gas 1, Miscellaneous 0) Week to Feb 23, 2018: 2 rigs total (Oil 1, Gas 1, Miscellaneous 0) Week to Mar 2, 2018: 2 rigs total (Oil 1, Gas 1, Miscellaneous 0) Week to Mar 9, 2018: 2 rigs total (Oil 1, Gas 1, Miscellaneous 0) Week to Mar 16, 2018: 2 rigs total (Oil 1, Gas 1, Miscellaneous 0) Week to Mar 23, 2018: 0 rigs total (Oil 0, Gas 0, Miscellaneous 0) Week to Mar 29, 2018: 0 rigs total (Oil 0, Gas 0, Miscellaneous 0) Week to Apr 6, 2018: 0 rigs total (Oil 0, Gas 0, Miscellaneous 0) Week to Apr 13, 2018: 0 rigs total (Oil 0, Gas 0, Miscellaneous 0) Week to Apr 20, 2018: 0 rigs total (Oil 0, Gas 0, Miscellaneous 0) Week to Apr 27, 2018: 0 rigs total (Oil 0, Gas 0, Miscellaneous 0) Week to May 4, 2018: 0 rigs total (Oil 0, Gas 0, Miscellaneous 0) Week to May 11, 2018: 0 rigs total (Oil 0, Gas 0, Miscellaneous 0) Week to May 18, 2018: 0 rigs total (Oil 0, Gas 0, Miscellaneous 0) Week to May 25, 2018: 0 rigs total (Oil 0, Gas 0, Miscellaneous 0) Week to Jun 1, 2018: 0 rigs total (Oil 0, Gas 0, Miscellaneous 0) Week to Jun 8, 2018: 1 rig total (Oil 0, Gas 1, Miscellaneous 0) Week to Jun 15, 2018: 1 rig total (Oil 0, Gas 1, Miscellaneous 0) Week to Jun 22, 2018: 1 rig total (Oil 0, Gas 1, Miscellaneous 0) Week to Jun 29, 2018: 1 rig total (Oil 0, Gas 1, Miscellaneous 0) Week to Jul 6, 2018: 1 rig total (Oil 0, Gas 1, Miscellaneous 0) Week to Jul 13, 2018: 1 rig total (Oil 0, Gas 1, Miscellaneous 0) Week to Jul 20, 2018: 1 rig total (Oil 0, Gas 1, Miscellaneous 0) Week to Jul 27, 2018: 1 rig total (Oil 0, Gas 1, Miscellaneous 0) Week to Aug 3, 2018: 1 rig total (Oil 0, Gas 1, Miscellaneous 0) Week to Aug 10, 2018: 1 rig total (Oil 0, Gas 1, Miscellaneous 0) Week to Aug 17, 2018: 1 rig total (Oil 0, Gas 1, Miscellaneous 0) Week to Aug 24, 2018: 1 rig total (Oil 0, Gas 1, Miscellaneous 0) Week to Aug 31, 2018: 1 rig total (Oil 0, Gas 1, Miscellaneous 0) Week to Sep 7, 2018: 1 rig total (Oil 0, Gas 1, Miscellaneous 0) Week to Sep 14, 2018: 1 rig total (Oil 0, Gas 1, Miscellaneous 0) Week to Sep 21, 2018: 1 rig total (Oil 0, Gas 1, Miscellaneous 0) Week to Sep 28, 2018: 2 rigs total (Oil 1, Gas 1, Miscellaneous 0) Week to Oct 5, 2018: 2 rigs total (Oil 1, Gas 1, Miscellaneous 0) Week to Oct 12, 2018: 2 rigs total (Oil 1, Gas 1, Miscellaneous 0) Week to Oct 19, 2018: 2 rigs total (Oil 1, Gas 1, Miscellaneous 0) Week to Oct 26, 2018: 2 rigs total (Oil 1, Gas 1, Miscellaneous 0) Week to Nov 2, 2018: 2 rigs total (Oil 1, Gas 1, Miscellaneous 0) Week to Nov 9, 2018: 1 rig total (Oil 0, Gas 1, Miscellaneous 0) Week to Nov 16, 2018: 1 rig total (Oil 0, Gas 1, Miscellaneous 0) Week to Nov 21, 2018: 0 rigs total (Oil 0, Gas 0, Miscellaneous 0) Week to Nov 30, 2018: 0 rigs total (Oil 0, Gas 0, Miscellaneous 0) Week to Dec 7, 2018: 0 rigs total (Oil 0, Gas 0, Miscellaneous 0) Week to Dec 14, 2018: 0 rigs total (Oil 0, Gas 0, Miscellaneous 0) Week to Dec 21, 2018: 0 rigs total (Oil 0, Gas 0, Miscellaneous 0) Week to Dec 28, 2018: 0 rigs total (Oil 0, Gas 0, Miscellaneous 0) Week to Jan 4, 2019: 0 rigs total (Oil 0, Gas 0, Miscellaneous 0) Week to Jan 11, 2019: 0 rigs total (Oil 0, Gas 0, Miscellaneous 0) Week to Jan 18, 2019: 0 rigs total (Oil 0, Gas 0, Miscellaneous 0) Week to Jan 25, 2019: 0 rigs total (Oil 0, Gas 0, Miscellaneous 0) Week to Feb 1, 2019: 0 rigs total (Oil 0, Gas 0, Miscellaneous 0) Week to Feb 8, 2019: 0 rigs total (Oil 0, Gas 0, Miscellaneous 0) Week to Feb 15, 2019: 0 rigs total (Oil 0, Gas 0, Miscellaneous 0) Week to Feb 22, 2019: 0 rigs total (Oil 0, Gas 0, Miscellaneous 0) Week to Mar 1, 2019: 0 rigs total (Oil 0, Gas 0, Miscellaneous 0) Week to Mar 8, 2019: 0 rigs total (Oil 0, Gas 0, Miscellaneous 0) Week to Mar 15, 2019: 0 rigs total (Oil 0, Gas 0, Miscellaneous 0) Week to Mar 22, 2019: 0 rigs total (Oil 0, Gas 0, Miscellaneous 0) Week to Mar 29, 2019: 0 rigs total (Oil 0, Gas 0, Miscellaneous 0) Week to Apr 5, 2019: 0 rigs total (Oil 0, Gas 0, Miscellaneous 0) Week to Apr 12, 2019: 0 rigs total (Oil 0, Gas 0, Miscellaneous 0) Week to Apr 18, 2019: 0 rigs total (Oil 0, Gas 0, Miscellaneous 0) Week to Apr 26, 2019: 0 rigs total (Oil 0, Gas 0, Miscellaneous 0) Week to May 3, 2019: 0 rigs total (Oil 0, Gas 0, Miscellaneous 0) Week to May 10, 2019: 0 rigs total (Oil 0, Gas 0, Miscellaneous 0) Week to May 17, 2019: 0 rigs total (Oil 0, Gas 0, Miscellaneous 0) Week to May 24, 2019: 0 rigs total (Oil 0, Gas 0, Miscellaneous 0) Week to May 31, 2019: 0 rigs total (Oil 0, Gas 0, Miscellaneous 0) Week to Jun 7, 2019: 0 rigs total (Oil 0, Gas 0, Miscellaneous 0) Week to Jun 14, 2019: 0 rigs total (Oil 0, Gas 0, Miscellaneous 0) Week to Jun 21, 2019: 0 rigs total (Oil 0, Gas 0, Miscellaneous 0) Week to Jun 28, 2019: 0 rigs total (Oil 0, Gas 0, Miscellaneous 0) Week to Jul 3, 2019: 0 rigs total (Oil 0, Gas 0, Miscellaneous 0) Week to Jul 12, 2019: 0 rigs total (Oil 0, Gas 0, Miscellaneous 0) Week to Jul 19, 2019: 0 rigs total (Oil 0, Gas 0, Miscellaneous 0) Week to Jul 26, 2019: 0 rigs total (Oil 0, Gas 0, Miscellaneous 0) Week to Aug 2, 2019: 0 rigs total (Oil 0, Gas 0, Miscellaneous 0) Week to Aug 9, 2019: 0 rigs total (Oil 0, Gas 0, Miscellaneous 0) Week to Aug 16, 2019: 1 rig total (Oil 1, Gas 0, Miscellaneous 0) Week to Aug 23, 2019: 1 rig total (Oil 1, Gas 0, Miscellaneous 0) Week to Aug 30, 2019: 1 rig total (Oil 1, Gas 0, Miscellaneous 0) Week to Sep 6, 2019: 1 rig total (Oil 1, Gas 0, Miscellaneous 0) Week to Sep 13, 2019: 1 rig total (Oil 1, Gas 0, Miscellaneous 0) Week to Sep 20, 2019: 2 rigs total (Oil 2, Gas 0, Miscellaneous 0) Week to Sep 27, 2019: 1 rig total (Oil 1, Gas 0, Miscellaneous 0) Week to Oct 4, 2019: 2 rigs total (Oil 2, Gas 0, Miscellaneous 0) Week to Oct 11, 2019: 1 rig total (Oil 1, Gas 0, Miscellaneous 0) Week to Oct 18, 2019: 1 rig total (Oil 1, Gas 0, Miscellaneous 0) Week to Oct 25, 2019: 0 rigs total (Oil 0, Gas 0, Miscellaneous 0) Week to Nov 1, 2019: 0 rigs total (Oil 0, Gas 0, Miscellaneous 0) Week to Nov 8, 2019: 0 rigs total (Oil 0, Gas 0, Miscellaneous 0) Week to Nov 15, 2019: 0 rigs total (Oil 0, Gas 0, Miscellaneous 0) Week to Nov 22, 2019: 0 rigs total (Oil 0, Gas 0, Miscellaneous 0) Week to Nov 27, 2019: 0 rigs total (Oil 0, Gas 0, Miscellaneous 0) Week to Dec 6, 2019: 0 rigs total (Oil 0, Gas 0, Miscellaneous 0) Week to Dec 13, 2019: 0 rigs total (Oil 0, Gas 0, Miscellaneous 0) Week to Dec 20, 2019: 0 rigs total (Oil 0, Gas 0, Miscellaneous 0) Week to Dec 27, 2019: 0 rigs total (Oil 0, Gas 0, Miscellaneous 0) Week to Jan 3, 2020: 0 rigs total (Oil 0, Gas 0, Miscellaneous 0) Week to Jan 10, 2020: 0 rigs total (Oil 0, Gas 0, Miscellaneous 0) Week to Jan 17, 2020: 0 rigs total (Oil 0, Gas 0, Miscellaneous 0) Week to Jan 24, 2020: 0 rigs total (Oil 0, Gas 0, Miscellaneous 0) Week to Jan 31, 2020: 0 rigs total (Oil 0, Gas 0, Miscellaneous 0) Week to Feb 7, 2020: 0 rigs total (Oil 0, Gas 0, Miscellaneous 0) Week to Feb 14, 2020: 0 rigs total (Oil 0, Gas 0, Miscellaneous 0) Week to Feb 21, 2020: 0 rigs total (Oil 0, Gas 0, Miscellaneous 0) Week to Feb 28, 2020: 0 rigs total (Oil 0, Gas 0, Miscellaneous 0) Week to Mar 6, 2020: 0 rigs total (Oil 0, Gas 0, Miscellaneous 0) Week to Mar 13, 2020: 0 rigs total (Oil 0, Gas 0, Miscellaneous 0) Week to Mar 20, 2020: 0 rigs total (Oil 0, Gas 0, Miscellaneous 0) Week to Mar 27, 2020: 0 rigs total (Oil 0, Gas 0, Miscellaneous 0) Week to Apr 3, 2020: 0 rigs total (Oil 0, Gas 0, Miscellaneous 0) Week to Apr 9, 2020: 0 rigs total (Oil 0, Gas 0, Miscellaneous 0) Week to Apr 17, 2020: 0 rigs total (Oil 0, Gas 0, Miscellaneous 0) Week to Apr 24, 2020: 0 rigs total (Oil 0, Gas 0, Miscellaneous 0) Week to May 1, 2020: 0 rigs total (Oil 0, Gas 0, Miscellaneous 0) Week to May 8, 2020: 0 rigs total (Oil 0, Gas 0, Miscellaneous 0) Week to May 15, 2020: 0 rigs total (Oil 0, Gas 0, Miscellaneous 0) Week to May 22, 2020: 0 rigs total (Oil 0, Gas 0, Miscellaneous 0) Week to May 29, 2020: 0 rigs total (Oil 0, Gas 0, Miscellaneous 0) Week to Jun 5, 2020: 0 rigs total (Oil 0, Gas 0, Miscellaneous 0) Week to Jun 12, 2020: 0 rigs total (Oil 0, Gas 0, Miscellaneous 0) Week to Jun 19, 2020: 0 rigs total (Oil 0, Gas 0, Miscellaneous 0) Week to Jun 26, 2020: 0 rigs total (Oil 0, Gas 0, Miscellaneous 0) Week to Jul 2, 2020: 0 rigs total (Oil 0, Gas 0, Miscellaneous 0) Week to Jul 10, 2020: 0 rigs total (Oil 0, Gas 0, Miscellaneous 0) Week to Jul 17, 2020: 0 rigs total (Oil 0, Gas 0, Miscellaneous 0) Week to Jul 24, 2020: 0 rigs total (Oil 0, Gas 0, Miscellaneous 0) Week to Jul 31, 2020: 0 rigs total (Oil 0, Gas 0, Miscellaneous 0) Week to Aug 7, 2020: 0 rigs total (Oil 0, Gas 0, Miscellaneous 0) Week to Aug 14, 2020: 0 rigs total (Oil 0, Gas 0, Miscellaneous 0) Week to Aug 21, 2020: 0 rigs total (Oil 0, Gas 0, Miscellaneous 0) Week to Aug 28, 2020: 0 rigs total (Oil 0, Gas 0, Miscellaneous 0) Week to Sep 4, 2020: 0 rigs total (Oil 0, Gas 0, Miscellaneous 0) Week to Sep 11, 2020: 0 rigs total (Oil 0, Gas 0, Miscellaneous 0) Week to Sep 18, 2020: 0 rigs total (Oil 0, Gas 0, Miscellaneous 0) Week to Sep 25, 2020: 0 rigs total (Oil 0, Gas 0, Miscellaneous 0) Week to Oct 2, 2020: 0 rigs total (Oil 0, Gas 0, Miscellaneous 0) Week to Oct 9, 2020: 0 rigs total (Oil 0, Gas 0, Miscellaneous 0) Week to Oct 16, 2020: 0 rigs total (Oil 0, Gas 0, Miscellaneous 0) Week to Oct 23, 2020: 0 rigs total (Oil 0, Gas 0, Miscellaneous 0) Week to Oct 30, 2020: 0 rigs total (Oil 0, Gas 0, Miscellaneous 0) Week to Nov 6, 2020: 0 rigs total (Oil 0, Gas 0, Miscellaneous 0) Week to Nov 13, 2020: 0 rigs total (Oil 0, Gas 0, Miscellaneous 0) Week to Nov 20, 2020: 0 rigs total (Oil 0, Gas 0, Miscellaneous 0) Week to Nov 25, 2020: 0 rigs total (Oil 0, Gas 0, Miscellaneous 0) Week to Dec 4, 2020: 0 rigs total (Oil 0, Gas 0, Miscellaneous 0) Week to Dec 11, 2020: 0 rigs total (Oil 0, Gas 0, Miscellaneous 0) Week to Dec 18, 2020: 0 rigs total (Oil 0, Gas 0, Miscellaneous 0) Week to Dec 23, 2020: 0 rigs total (Oil 0, Gas 0, Miscellaneous 0) Week to Dec 31, 2020: 0 rigs total (Oil 0, Gas 0, Miscellaneous 0) Week to Jan 8, 2021: 0 rigs total (Oil 0, Gas 0, Miscellaneous 0) Week to Jan 15, 2021: 0 rigs total (Oil 0, Gas 0, Miscellaneous 0) Week to Jan 22, 2021: 0 rigs total (Oil 0, Gas 0, Miscellaneous 0) Week to Jan 29, 2021: 0 rigs total (Oil 0, Gas 0, Miscellaneous 0) Week to Feb 5, 2021: 0 rigs total (Oil 0, Gas 0, Miscellaneous 0) Week to Feb 12, 2021: 0 rigs total (Oil 0, Gas 0, Miscellaneous 0) Week to Feb 19, 2021: 0 rigs total (Oil 0, Gas 0, Miscellaneous 0) Week to Feb 26, 2021: 0 rigs total (Oil 0, Gas 0, Miscellaneous 0) Week to Mar 5, 2021: 0 rigs total (Oil 0, Gas 0, Miscellaneous 0) Week to Mar 12, 2021: 0 rigs total (Oil 0, Gas 0, Miscellaneous 0) Week to Mar 19, 2021: 0 rigs total (Oil 0, Gas 0, Miscellaneous 0) Week to Mar 26, 2021: 0 rigs total (Oil 0, Gas 0, Miscellaneous 0) Week to Apr 1, 2021: 0 rigs total (Oil 0, Gas 0, Miscellaneous 0) Week to Apr 9, 2021: 0 rigs total (Oil 0, Gas 0, Miscellaneous 0) Week to Apr 16, 2021: 0 rigs total (Oil 0, Gas 0, Miscellaneous 0) Week to Apr 23, 2021: 0 rigs total (Oil 0, Gas 0, Miscellaneous 0) Week to Apr 30, 2021: 0 rigs total (Oil 0, Gas 0, Miscellaneous 0) Week to May 7, 2021: 0 rigs total (Oil 0, Gas 0, Miscellaneous 0) Week to May 14, 2021: 0 rigs total (Oil 0, Gas 0, Miscellaneous 0) Week to May 21, 2021: 0 rigs total (Oil 0, Gas 0, Miscellaneous 0) Week to May 28, 2021: 0 rigs total (Oil 0, Gas 0, Miscellaneous 0) Week to Jun 4, 2021: 0 rigs total (Oil 0, Gas 0, Miscellaneous 0) Week to Jun 11, 2021: 0 rigs total (Oil 0, Gas 0, Miscellaneous 0) Week to Jun 18, 2021: 0 rigs total (Oil 0, Gas 0, Miscellaneous 0) Week to Jun 25, 2021: 0 rigs total (Oil 0, Gas 0, Miscellaneous 0) Week to Jul 2, 2021: 0 rigs total (Oil 0, Gas 0, Miscellaneous 0) Week to Jul 9, 2021: 0 rigs total (Oil 0, Gas 0, Miscellaneous 0) Week to Jul 16, 2021: 0 rigs total (Oil 0, Gas 0, Miscellaneous 0) Week to Jul 23, 2021: 0 rigs total (Oil 0, Gas 0, Miscellaneous 0) Week to Jul 30, 2021: 0 rigs total (Oil 0, Gas 0, Miscellaneous 0) Week to Aug 6, 2021: 0 rigs total (Oil 0, Gas 0, Miscellaneous 0) Week to Aug 13, 2021: 0 rigs total (Oil 0, Gas 0, Miscellaneous 0) Week to Aug 20, 2021: 0 rigs total (Oil 0, Gas 0, Miscellaneous 0) Week to Aug 27, 2021: 0 rigs total (Oil 0, Gas 0, Miscellaneous 0) Week to Sep 3, 2021: 0 rigs total (Oil 0, Gas 0, Miscellaneous 0) Week to Sep 10, 2021: 1 rig total (Oil 0, Gas 1, Miscellaneous 0) Week to Sep 17, 2021: 0 rigs total (Oil 0, Gas 0, Miscellaneous 0) Week to Sep 24, 2021: 0 rigs total (Oil 0, Gas 0, Miscellaneous 0) Week to Oct 1, 2021: 0 rigs total (Oil 0, Gas 0, Miscellaneous 0) Week to Oct 8, 2021: 0 rigs total (Oil 0, Gas 0, Miscellaneous 0) Week to Oct 15, 2021: 0 rigs total (Oil 0, Gas 0, Miscellaneous 0) Week to Oct 22, 2021: 0 rigs total (Oil 0, Gas 0, Miscellaneous 0) Week to Oct 29, 2021: 0 rigs total (Oil 0, Gas 0, Miscellaneous 0) Week to Nov 5, 2021: 0 rigs total (Oil 0, Gas 0, Miscellaneous 0) Week to Nov 12, 2021: 0 rigs total (Oil 0, Gas 0, Miscellaneous 0) Week to Nov 19, 2021: 0 rigs total (Oil 0, Gas 0, Miscellaneous 0) Week to Nov 24, 2021: 0 rigs total (Oil 0, Gas 0, Miscellaneous 0) Week to Dec 3, 2021: 0 rigs total (Oil 0, Gas 0, Miscellaneous 0) Week to Dec 10, 2021: 0 rigs total (Oil 0, Gas 0, Miscellaneous 0) Week to Dec 17, 2021: 0 rigs total (Oil 0, Gas 0, Miscellaneous 0) Week to Dec 23, 2021: 0 rigs total (Oil 0, Gas 0, Miscellaneous 0) Week to Dec 31, 2021: 0 rigs total (Oil 0, Gas 0, Miscellaneous 0) Week to Jan 7, 2022: 0 rigs total (Oil 0, Gas 0, Miscellaneous 0) Week to Jan 14, 2022: 0 rigs total (Oil 0, Gas 0, Miscellaneous 0) Week to Jan 21, 2022: 0 rigs total (Oil 0, Gas 0, Miscellaneous 0) Week to Jan 28, 2022: 0 rigs total (Oil 0, Gas 0, Miscellaneous 0) Week to Feb 4, 2022: 0 rigs total (Oil 0, Gas 0, Miscellaneous 0) Week to Feb 11, 2022: 0 rigs total (Oil 0, Gas 0, Miscellaneous 0) Week to Feb 18, 2022: 0 rigs total (Oil 0, Gas 0, Miscellaneous 0) Week to Feb 25, 2022: 0 rigs total (Oil 0, Gas 0, Miscellaneous 0) Week to Mar 4, 2022: 0 rigs total (Oil 0, Gas 0, Miscellaneous 0) Week to Mar 11, 2022: 0 rigs total (Oil 0, Gas 0, Miscellaneous 0) Week to Mar 18, 2022: 0 rigs total (Oil 0, Gas 0, Miscellaneous 0) Week to Mar 25, 2022: 0 rigs total (Oil 0, Gas 0, Miscellaneous 0) Week to Apr 1, 2022: 0 rigs total (Oil 0, Gas 0, Miscellaneous 0) Week to Apr 8, 2022: 0 rigs total (Oil 0, Gas 0, Miscellaneous 0) Week to Apr 14, 2022: 0 rigs total (Oil 0, Gas 0, Miscellaneous 0) Week to Apr 22, 2022: 0 rigs total (Oil 0, Gas 0, Miscellaneous 0) Week to Apr 29, 2022: 0 rigs total (Oil 0, Gas 0, Miscellaneous 0) Week to May 6, 2022: 0 rigs total (Oil 0, Gas 0, Miscellaneous 0) Week to May 13, 2022: 0 rigs total (Oil 0, Gas 0, Miscellaneous 0) Week to May 20, 2022: 0 rigs total (Oil 0, Gas 0, Miscellaneous 0) Week to May 27, 2022: 0 rigs total (Oil 0, Gas 0, Miscellaneous 0) Week to Jun 3, 2022: 0 rigs total (Oil 0, Gas 0, Miscellaneous 0) Week to Jun 10, 2022: 0 rigs total (Oil 0, Gas 0, Miscellaneous 0) Week to Jun 17, 2022: 0 rigs total (Oil 0, Gas 0, Miscellaneous 0) Week to Jun 24, 2022: 0 rigs total (Oil 0, Gas 0, Miscellaneous 0) Week to Jul 1, 2022: 0 rigs total (Oil 0, Gas 0, Miscellaneous 0) Week to Jul 8, 2022: 0 rigs total (Oil 0, Gas 0, Miscellaneous 0) Week to Jul 15, 2022: 0 rigs total (Oil 0, Gas 0, Miscellaneous 0) Week to Jul 22, 2022: 0 rigs total (Oil 0, Gas 0, Miscellaneous 0) Week to Jul 29, 2022: 0 rigs total (Oil 0, Gas 0, Miscellaneous 0) Week to Aug 5, 2022: 1 rig total (Oil 0, Gas 1, Miscellaneous 0) Week to Aug 12, 2022: 1 rig total (Oil 0, Gas 1, Miscellaneous 0) Week to Aug 19, 2022: 1 rig total (Oil 1, Gas 0, Miscellaneous 0) Week to Aug 26, 2022: 1 rig total (Oil 1, Gas 0, Miscellaneous 0) Week to Sep 2, 2022: 1 rig total (Oil 1, Gas 0, Miscellaneous 0) Week to Sep 9, 2022: 1 rig total (Oil 1, Gas 0, Miscellaneous 0) Week to Sep 16, 2022: 1 rig total (Oil 1, Gas 0, Miscellaneous 0) Week to Sep 23, 2022: 1 rig total (Oil 1, Gas 0, Miscellaneous 0) Week to Sep 30, 2022: 1 rig total (Oil 1, Gas 0, Miscellaneous 0) Week to Oct 7, 2022: 1 rig total (Oil 1, Gas 0, Miscellaneous 0) Week to Oct 14, 2022: 1 rig total (Oil 1, Gas 0, Miscellaneous 0) Week to Oct 21, 2022: 1 rig total (Oil 1, Gas 0, Miscellaneous 0) Week to Oct 28, 2022: 1 rig total (Oil 1, Gas 0, Miscellaneous 0) Week to Nov 4, 2022: 1 rig total (Oil 1, Gas 0, Miscellaneous 0) Week to Nov 10, 2022: 1 rig total (Oil 1, Gas 0, Miscellaneous 0) Week to Nov 18, 2022: 1 rig total (Oil 1, Gas 0, Miscellaneous 0) Week to Nov 23, 2022: 1 rig total (Oil 1, Gas 0, Miscellaneous 0) Week to Dec 2, 2022: 1 rig total (Oil 1, Gas 0, Miscellaneous 0) Week to Dec 9, 2022: 1 rig total (Oil 1, Gas 0, Miscellaneous 0) Week to Dec 16, 2022: 2 rigs total (Oil 2, Gas 0, Miscellaneous 0) Week to Dec 22, 2022: 2 rigs total (Oil 2, Gas 0, Miscellaneous 0) Week to Dec 30, 2022: 1 rig total (Oil 1, Gas 0, Miscellaneous 0) Week to Jan 6, 2023: 1 rig total (Oil 1, Gas 0, Miscellaneous 0) Week to Jan 13, 2023: 1 rig total (Oil 1, Gas 0, Miscellaneous 0) Week to Jan 20, 2023: 1 rig total (Oil 1, Gas 0, Miscellaneous 0) Week to Jan 27, 2023: 1 rig total (Oil 1, Gas 0, Miscellaneous 0) Week to Feb 3, 2023: 0 rigs total (Oil 0, Gas 0, Miscellaneous 0) Week to Feb 10, 2023: 0 rigs total (Oil 0, Gas 0, Miscellaneous 0) Week to Feb 17, 2023: 0 rigs total (Oil 0, Gas 0, Miscellaneous 0) Week to Feb 24, 2023: 0 rigs total (Oil 0, Gas 0, Miscellaneous 0) Week to Mar 3, 2023: 0 rigs total (Oil 0, Gas 0, Miscellaneous 0) Week to Mar 10, 2023: 0 rigs total (Oil 0, Gas 0, Miscellaneous 0) Week to Mar 17, 2023: 0 rigs total (Oil 0, Gas 0, Miscellaneous 0) Week to Mar 24, 2023: 0 rigs total (Oil 0, Gas 0, Miscellaneous 0) Week to Mar 31, 2023: 0 rigs total (Oil 0, Gas 0, Miscellaneous 0) Week to Apr 6, 2023: 0 rigs total (Oil 0, Gas 0, Miscellaneous 0) Week to Apr 14, 2023: 0 rigs total (Oil 0, Gas 0, Miscellaneous 0) Week to Apr 21, 2023: 0 rigs total (Oil 0, Gas 0, Miscellaneous 0) Week to Apr 28, 2023: 0 rigs total (Oil 0, Gas 0, Miscellaneous 0) Week to May 5, 2023: 0 rigs total (Oil 0, Gas 0, Miscellaneous 0) Week to May 12, 2023: 1 rig total (Oil 0, Gas 0, Miscellaneous 1) Week to May 19, 2023: 1 rig total (Oil 0, Gas 0, Miscellaneous 1) Week to May 26, 2023: 1 rig total (Oil 0, Gas 0, Miscellaneous 1) Week to Jun 2, 2023: 1 rig total (Oil 0, Gas 0, Miscellaneous 1) Week to Jun 9, 2023: 2 rigs total (Oil 1, Gas 0, Miscellaneous 1) Week to Jun 16, 2023: 2 rigs total (Oil 1, Gas 0, Miscellaneous 1) Week to Jun 23, 2023: 2 rigs total (Oil 1, Gas 0, Miscellaneous 1) Week to Jun 30, 2023: 2 rigs total (Oil 1, Gas 0, Miscellaneous 1) Week to Jul 7, 2023: 2 rigs total (Oil 1, Gas 0, Miscellaneous 1) Week to Jul 14, 2023: 2 rigs total (Oil 1, Gas 0, Miscellaneous 1) Week to Jul 21, 2023: 4 rigs total (Oil 1, Gas 0, Miscellaneous 3) Week to Jul 28, 2023: 4 rigs total (Oil 1, Gas 0, Miscellaneous 3) Week to Aug 4, 2023: 4 rigs total (Oil 2, Gas 0, Miscellaneous 2) Week to Aug 11, 2023: 4 rigs total (Oil 2, Gas 0, Miscellaneous 2) Week to Aug 18, 2023: 4 rigs total (Oil 2, Gas 0, Miscellaneous 2) Week to Aug 25, 2023: 4 rigs total (Oil 2, Gas 0, Miscellaneous 2) Week to Sep 1, 2023: 4 rigs total (Oil 2, Gas 0, Miscellaneous 2) Week to Sep 8, 2023: 4 rigs total (Oil 2, Gas 0, Miscellaneous 2) Week to Sep 15, 2023: 5 rigs total (Oil 2, Gas 1, Miscellaneous 2) Week to Sep 22, 2023: 5 rigs total (Oil 2, Gas 1, Miscellaneous 2) Week to Sep 29, 2023: 5 rigs total (Oil 2, Gas 1, Miscellaneous 2) Week to Oct 6, 2023: 5 rigs total (Oil 2, Gas 1, Miscellaneous 2) Week to Oct 13, 2023: 5 rigs total (Oil 2, Gas 1, Miscellaneous 2) Week to Oct 20, 2023: 3 rigs total (Oil 0, Gas 1, Miscellaneous 2) Week to Oct 27, 2023: 3 rigs total (Oil 0, Gas 1, Miscellaneous 2) Week to Nov 3, 2023: 3 rigs total (Oil 0, Gas 1, Miscellaneous 2) Week to Nov 10, 2023: 4 rigs total (Oil 0, Gas 2, Miscellaneous 2) Week to Nov 17, 2023: 4 rigs total (Oil 0, Gas 2, Miscellaneous 2) Week to Nov 22, 2023: 4 rigs total (Oil 0, Gas 2, Miscellaneous 2) Week to Dec 1, 2023: 4 rigs total (Oil 0, Gas 2, Miscellaneous 2) Week to Dec 8, 2023: 4 rigs total (Oil 0, Gas 2, Miscellaneous 2) Week to Dec 15, 2023: 3 rigs total (Oil 0, Gas 2, Miscellaneous 1) Week to Dec 21, 2023: 3 rigs total (Oil 0, Gas 2, Miscellaneous 1) Week to Dec 29, 2023: 3 rigs total (Oil 0, Gas 2, Miscellaneous 1) Week to Jan 5, 2024: 3 rigs total (Oil 0, Gas 2, Miscellaneous 1) Week to Jan 12, 2024: 3 rigs total (Oil 0, Gas 2, Miscellaneous 1) Week to Jan 19, 2024: 3 rigs total (Oil 0, Gas 2, Miscellaneous 1) Week to Jan 26, 2024: 3 rigs total (Oil 0, Gas 2, Miscellaneous 1) Week to Feb 2, 2024: 3 rigs total (Oil 0, Gas 2, Miscellaneous 1) Week to Feb 9, 2024: 3 rigs total (Oil 0, Gas 2, Miscellaneous 1) Week to Feb 16, 2024: 3 rigs total (Oil 0, Gas 2, Miscellaneous 1) Week to Feb 23, 2024: 3 rigs total (Oil 0, Gas 2, Miscellaneous 1) Week to Mar 1, 2024: 3 rigs total (Oil 0, Gas 2, Miscellaneous 1) Week to Mar 8, 2024: 3 rigs total (Oil 0, Gas 2, Miscellaneous 1) Week to Mar 15, 2024: 3 rigs total (Oil 0, Gas 2, Miscellaneous 1) Week to Mar 22, 2024: 3 rigs total (Oil 0, Gas 2, Miscellaneous 1) Week to Mar 28, 2024: 3 rigs total (Oil 0, Gas 2, Miscellaneous 1) Week to Apr 5, 2024: 3 rigs total (Oil 0, Gas 2, Miscellaneous 1) Week to Apr 12, 2024: 3 rigs total (Oil 0, Gas 2, Miscellaneous 1) Week to Apr 19, 2024: 3 rigs total (Oil 0, Gas 2, Miscellaneous 1) Week to Apr 26, 2024: 3 rigs total (Oil 0, Gas 2, Miscellaneous 1) Week to May 3, 2024: 3 rigs total (Oil 0, Gas 2, Miscellaneous 1) Week to May 10, 2024: 3 rigs total (Oil 0, Gas 2, Miscellaneous 1) Week to May 17, 2024: 3 rigs total (Oil 0, Gas 2, Miscellaneous 1) Week to May 24, 2024: 3 rigs total (Oil 0, Gas 2, Miscellaneous 1) Week to May 31, 2024: 3 rigs total (Oil 0, Gas 2, Miscellaneous 1) Week to Jun 7, 2024: 3 rigs total (Oil 0, Gas 2, Miscellaneous 1) Week to Jun 14, 2024: 3 rigs total (Oil 0, Gas 2, Miscellaneous 1) Week to Jun 21, 2024: 3 rigs total (Oil 0, Gas 2, Miscellaneous 1) Week to Jun 28, 2024: 3 rigs total (Oil 0, Gas 2, Miscellaneous 1) Week to Jul 5, 2024: 3 rigs total (Oil 0, Gas 2, Miscellaneous 1) Week to Jul 12, 2024: 3 rigs total (Oil 0, Gas 2, Miscellaneous 1) Week to Jul 19, 2024: 3 rigs total (Oil 0, Gas 2, Miscellaneous 1) Week to Jul 26, 2024: 3 rigs total (Oil 0, Gas 2, Miscellaneous 1) Week to Aug 2, 2024: 3 rigs total (Oil 0, Gas 2, Miscellaneous 1) Week to Aug 9, 2024: 3 rigs total (Oil 0, Gas 2, Miscellaneous 1) Week to Aug 16, 2024: 3 rigs total (Oil 0, Gas 2, Miscellaneous 1) Week to Aug 23, 2024: 3 rigs total (Oil 0, Gas 2, Miscellaneous 1) Week to Aug 30, 2024: 3 rigs total (Oil 0, Gas 2, Miscellaneous 1) Week to Sep 6, 2024: 3 rigs total (Oil 0, Gas 2, Miscellaneous 1) Week to Sep 13, 2024: 3 rigs total (Oil 0, Gas 2, Miscellaneous 1) Week to Sep 20, 2024: 3 rigs total (Oil 0, Gas 2, Miscellaneous 1) Week to Sep 27, 2024: 3 rigs total (Oil 0, Gas 2, Miscellaneous 1) Week to Oct 4, 2024: 3 rigs total (Oil 0, Gas 2, Miscellaneous 1) Week to Oct 11, 2024: 3 rigs total (Oil 0, Gas 2, Miscellaneous 1) Week to Oct 18, 2024: 3 rigs total (Oil 0, Gas 2, Miscellaneous 1) Week to Oct 25, 2024: 3 rigs total (Oil 0, Gas 2, Miscellaneous 1) Week to Nov 1, 2024: 3 rigs total (Oil 0, Gas 2, Miscellaneous 1) Week to Nov 8, 2024: 3 rigs total (Oil 0, Gas 2, Miscellaneous 1) Week to Nov 15, 2024: 3 rigs total (Oil 0, Gas 2, Miscellaneous 1) Week to Nov 22, 2024: 3 rigs total (Oil 0, Gas 2, Miscellaneous 1) Week to Nov 27, 2024: 3 rigs total (Oil 0, Gas 2, Miscellaneous 1) Week to Dec 6, 2024: 3 rigs total (Oil 0, Gas 2, Miscellaneous 1) Week to Dec 13, 2024: 3 rigs total (Oil 0, Gas 2, Miscellaneous 1) Week to Dec 20, 2024: 3 rigs total (Oil 0, Gas 2, Miscellaneous 1) Week to Dec 27, 2024: 3 rigs total (Oil 0, Gas 2, Miscellaneous 1) Week to Jan 3, 2025: 3 rigs total (Oil 0, Gas 2, Miscellaneous 1) Week to Jan 10, 2025: 3 rigs total (Oil 0, Gas 2, Miscellaneous 1) Week to Jan 17, 2025: 3 rigs total (Oil 0, Gas 2, Miscellaneous 1) Week to Jan 24, 2025: 3 rigs total (Oil 0, Gas 2, Miscellaneous 1) Week to Jan 31, 2025: 3 rigs total (Oil 0, Gas 2, Miscellaneous 1) Week to Feb 7, 2025: 3 rigs total (Oil 0, Gas 2, Miscellaneous 1) Week to Feb 14, 2025: 3 rigs total (Oil 0, Gas 2, Miscellaneous 1) Week to Feb 21, 2025: 3 rigs total (Oil 0, Gas 2, Miscellaneous 1) Week to Feb 28, 2025: 3 rigs total (Oil 0, Gas 2, Miscellaneous 1) Week to Mar 7, 2025: 3 rigs total (Oil 0, Gas 2, Miscellaneous 1) Week to Mar 14, 2025: 3 rigs total (Oil 0, Gas 2, Miscellaneous 1) Week to Mar 21, 2025: 3 rigs total (Oil 0, Gas 2, Miscellaneous 1) Week to Mar 28, 2025: 3 rigs total (Oil 0, Gas 2, Miscellaneous 1) Week to Apr 4, 2025: 3 rigs total (Oil 0, Gas 2, Miscellaneous 1) Week to Apr 11, 2025: 3 rigs total (Oil 0, Gas 2, Miscellaneous 1) Week to Apr 17, 2025: 3 rigs total (Oil 0, Gas 2, Miscellaneous 1) Week to Apr 25, 2025: 2 rigs total (Oil 0, Gas 2, Miscellaneous 0) Week to May 2, 2025: 2 rigs total (Oil 0, Gas 2, Miscellaneous 0) Week to May 9, 2025: 2 rigs total (Oil 0, Gas 2, Miscellaneous 0) Week to May 16, 2025: 3 rigs total (Oil 0, Gas 3, Miscellaneous 0) Week to May 23, 2025: 3 rigs total (Oil 0, Gas 3, Miscellaneous 0) Week to May 30, 2025: 3 rigs total (Oil 0, Gas 3, Miscellaneous 0) Week to Jun 6, 2025: 3 rigs total (Oil 0, Gas 3, Miscellaneous 0) Week to Jun 13, 2025: 3 rigs total (Oil 0, Gas 3, Miscellaneous 0) Week to Jun 20, 2025: 3 rigs total (Oil 0, Gas 3, Miscellaneous 0) Week to Jun 27, 2025: 1 rig total (Oil 0, Gas 1, Miscellaneous 0) Week to Jul 3, 2025: 1 rig total (Oil 0, Gas 1, Miscellaneous 0) Week to Jul 11, 2025: 1 rig total (Oil 0, Gas 1, Miscellaneous 0) Week to Jul 18, 2025: 1 rig total (Oil 0, Gas 1, Miscellaneous 0) Week to Jul 25, 2025: 1 rig total (Oil 0, Gas 1, Miscellaneous 0) Week to Aug 1, 2025: 1 rig total (Oil 0, Gas 1, Miscellaneous 0) Week to Aug 8, 2025: 0 rigs total (Oil 0, Gas 0, Miscellaneous 0) Week to Aug 15, 2025: 0 rigs total (Oil 0, Gas 0, Miscellaneous 0) Week to Aug 22, 2025: 0 rigs total (Oil 0, Gas 0, Miscellaneous 0) Week to Aug 29, 2025: 0 rigs total (Oil 0, Gas 0, Miscellaneous 0) Week to Sep 5, 2025: 0 rigs total (Oil 0, Gas 0, Miscellaneous 0) Week to Sep 12, 2025: 0 rigs total (Oil 0, Gas 0, Miscellaneous 0) Week to Sep 19, 2025: 0 rigs total (Oil 0, Gas 0, Miscellaneous 0) Week to Sep 26, 2025: 0 rigs total (Oil 0, Gas 0, Miscellaneous 0) Week to Oct 3, 2025: 0 rigs total (Oil 0, Gas 0, Miscellaneous 0) Week to Oct 10, 2025: 1 rig total (Oil 0, Gas 0, Miscellaneous 1) Week to Oct 17, 2025: 1 rig total (Oil 0, Gas 0, Miscellaneous 1) Week to Oct 24, 2025: 1 rig total (Oil 0, Gas 0, Miscellaneous 1) Week to Oct 31, 2025: 1 rig total (Oil 0, Gas 0, Miscellaneous 1) Week to Nov 6, 2025: 1 rig total (Oil 0, Gas 0, Miscellaneous 1) Week to Nov 14, 2025: 1 rig total (Oil 0, Gas 0, Miscellaneous 1) Week to Nov 21, 2025: 1 rig total (Oil 0, Gas 0, Miscellaneous 1) Week to Nov 26, 2025: 1 rig total (Oil 0, Gas 0, Miscellaneous 1) Week to Dec 4, 2025: 1 rig total (Oil 0, Gas 0, Miscellaneous 1) Week to Dec 12, 2025: 1 rig total (Oil 0, Gas 0, Miscellaneous 1) Week to Dec 19, 2025: 1 rig total (Oil 0, Gas 0, Miscellaneous 1) Week to Dec 24, 2025: 1 rig total (Oil 0, Gas 0, Miscellaneous 1) Week to Dec 30, 2025: 1 rig total (Oil 0, Gas 0, Miscellaneous 1) Week to Jan 9, 2026: 3 rigs total (Oil 0, Gas 0, Miscellaneous 3) Week to Jan 16, 2026: 3 rigs total (Oil 0, Gas 0, Miscellaneous 3) Week to Jan 23, 2026: 3 rigs total (Oil 0, Gas 0, Miscellaneous 3) Week to Jan 30, 2026: 3 rigs total (Oil 0, Gas 0, Miscellaneous 3) Week to Feb 6, 2026: 3 rigs total (Oil 0, Gas 0, Miscellaneous 3) Week to Feb 13, 2026: 3 rigs total (Oil 0, Gas 0, Miscellaneous 3) Week to Feb 20, 2026: 3 rigs total (Oil 0, Gas 0, Miscellaneous 3) Week to Feb 27, 2026: 3 rigs total (Oil 0, Gas 0, Miscellaneous 3) Week to Mar 6, 2026: 3 rigs total (Oil 0, Gas 1, Miscellaneous 2) Week to Mar 13, 2026: 3 rigs total (Oil 0, Gas 1, Miscellaneous 2) Week to Mar 20, 2026: 3 rigs total (Oil 0, Gas 1, Miscellaneous 2) Week to Mar 27, 2026: 2 rigs total (Oil 0, Gas 0, Miscellaneous 2) Week to Apr 2, 2026: 2 rigs total (Oil 0, Gas 0, Miscellaneous 2) Week to Apr 10, 2026: 2 rigs total (Oil 0, Gas 0, Miscellaneous 2) Week to Apr 17, 2026: 2 rigs total (Oil 0, Gas 0, Miscellaneous 2) Week to Apr 24, 2026: 2 rigs total (Oil 0, Gas 0, Miscellaneous 2) Week to May 1, 2026: 2 rigs total (Oil 0, Gas 0, Miscellaneous 2) Week to May 8, 2026: 2 rigs total (Oil 0, Gas 0, Miscellaneous 2) Week to May 15, 2026: 2 rigs total (Oil 0, Gas 0, Miscellaneous 2) Week to May 22, 2026: 2 rigs total (Oil 0, Gas 0, Miscellaneous 2) Week to May 29, 2026: 2 rigs total (Oil 0, Gas 0, Miscellaneous 2) Week to Jun 5, 2026: 2 rigs total (Oil 0, Gas 0, Miscellaneous 2) Week to Jun 12, 2026: 2 rigs total (Oil 0, Gas 0, Miscellaneous 2) Week to Jun 18, 2026: 2 rigs total (Oil 0, Gas 0, Miscellaneous 2) Week to Jun 26, 2026: 2 rigs total (Oil 0, Gas 0, Miscellaneous 2) Week to Jul 2, 2026: 2 rigs total (Oil 0, Gas 0, Miscellaneous 2) Week to Jul 10, 2026: 2 rigs total (Oil 0, Gas 0, Miscellaneous 2) Week to Jul 17, 2026: 2 rigs total (Oil 0, Gas 0, Miscellaneous 2) Week to Jul 24, 2026: 2 rigs total (Oil 0, Gas 0, Miscellaneous 2) Week to Jul 31, 2026: 2 rigs total (Oil 0, Gas 0, Miscellaneous 2) Week to Aug 7, 2026: 2 rigs total (Oil 0, Gas 0, Miscellaneous 2) Week to Aug 14, 2026: 2 rigs total (Oil 0, Gas 0, Miscellaneous 2) Week to Aug 21, 2026: 2 rigs total (Oil 0, Gas 0, Miscellaneous 2) Week to Aug 28, 2026: 2 rigs total (Oil 0, Gas 0, Miscellaneous 2) Week to Sep 4, 2026: 2 rigs total (Oil 0, Gas 0, Miscellaneous 2) Week to Sep 11, 2026: 2 rigs total (Oil 0, Gas 0, Miscellaneous 2)

Interactive chart. Focus it and use the left and right arrow keys to read each week, Page Up and Page Down to move a year, Home and End for the ends of the series. The full figures are also in the table below.

  • In the Other Rockies, 2 drilling rigs were active in the week to September 11, 2026 (2 more than a year earlier).
  • Since Sep 2016, the weekly count peaked at 5 in Sep 2023.
  • Rig locations are reported by county and rolled up to this supply area's footprint; each county counts toward exactly one area.
Average active rigs per month: full table
Month Oil-directedGas-directedMiscellaneousAll rigs
Sep 2026 (through September 11, 2026)0022
Aug 20260022
Jul 20260022
Jun 20260022
May 20260022
Apr 20260022
Mar 202600.622.6
Feb 20260033
Jan 20260033
Dec 20250011
Nov 20250011
Oct 20250011
Sep 20250000
Aug 20250000
Jul 20250101
Jun 202502.202.2
May 202502.802.8
Apr 2025020.52.5
Mar 20250213
Feb 20250213
Jan 20250213
Dec 20240213
Nov 20240213
Oct 20240213

Source: CommoVision (commovision.com)

Formations

A cross-section through the Other Rockies, drawn across Toole County.

Toole County, Montana
05001,0001,5002,0002,5003,000ft TVDSSBlackleafBow IslandKootenaiSunburstMadisonLodgepoleNisku0102030WSWENEmiles along the line · dipping 5 ft/mi toward WSW (256°) · pale ribbon shows how certain each depth is
N3,150 producing wells (thinned)

7 formations along a 30-mile line, west-southwest to east-northeast.

Every depth drawn here is our own estimate, built from the curated formation tops of Montana wells across the basin. The pale ribbon along each boundary shows how certain that depth is. Where the ribbon is wider, the depth is less certain.

How these sections are built

Each section follows one straight line across its county, and the map beside it shows where that line runs.

West is on the left.

The depth of each formation along the line is estimated from the depths at which Montana wells across the basin met that formation, as recorded in the official source's own formation-top records.

A formation is drawn where enough wells along the line place it and where it stands clear of the formation above or below.

Key numbers

40.2 Mbbl/d (est.) Jun 2026 oil production Jun 2026 is still filling in. The figure is the filings already in plus an estimate of the part not yet filed. The change compares this estimate with the same month last year. -5.9% vs Jun last year
706 MMcf/d (est.) Jun 2026 gas production Jun 2026 is still filling in. The figure is the filings already in plus an estimate of the part not yet filed. The change compares this estimate with the same month last year. -5.1% vs Jun last year
42.6 Mbbl/d 2025 oil production
699.3 MMcf/d 2025 gas production
62,948 wells Wells in the total footprint all formations & trajectories
13,905 wells Producing wells tracked trailing 12 months per region
35.2 Mbbl/d Existing wells, Sep 2027 forecast

What we cover here

Each row names the grain a region’s production is held at. Where a source publishes at a coarser grain, the page says so.

DataGrainSinceBenchmark
Colorado production well 1999-01 ~100% of EIA
Montana production well 1986-01 ~96–100% of EIA
New Mexico production well 1924-01 ~100% of EIA
Utah production well 1984-01 ~100% of EIA
Wyoming production well 1978-01 ~100–101% of EIA

Benchmark cells compare our series with the EIA’s published estimates.

About the EIA comparison

The two are produced differently: the EIA estimates from a survey of the largest operators and a model built to anticipate late filings, while the series compared here are rebuilt from the source’s own records as they arrive. Recent months can differ without either being wrong; the methodology page explains both methods.

Coverage rows for Other Rockies are regenerated at every build from the same catalog of sources the data is built from.

What the data shows

  • The Other Rockies footprint produced 15.6 MMbbl of oil and 255.3 Bcf of natural gas in 2025.
  • Natural gas production in the Other Rockies footprint peaked in 1994 at 835.7 Bcf; 2025 output of 255.3 Bcf ran at 31% of that peak.
  • Other Rockies is a producing area, not a single rock target: the 62,948 wells here are grouped by where they are, across every formation and trajectory drilled inside it.
  • The figures here start in 1984, when Utah filings begin. Before that only New Mexico and Wyoming report, together 71% of the area's volume at that point, so the earlier years are not drawn as the whole area. Montana from 1986 (5% of the area at that point) and Colorado from 1999 (4% of the area at that point) are included from their own first year.
  • 13,905 producing wells tracked, trailing 12 months per region.

Get early access

Watch supply move as soon as its sources publish, with forecasts on 1.1+ million producing wells. The portal, an API and MCP access for AI tools open on October 1, 2026.

Data use is subject to our Terms of Service.