CommoVision

See the future in real time

Aethon Energy

Aethon Energy produced 108 Mbbl (thousand barrels) of oil and 1.01 Tcf of natural gas in 2025. 2,625 operated producing wells tracked, trailing 12 months per region.

  • Fourth-largest operator by operated natural gas in Texas, 2025.
  • Operated 3.7% of the natural gas produced in Texas, 2025.
  • Natural gas production rose 7% in 2025 from 2024.
Operator

Under Current operator an old month can show a later company.
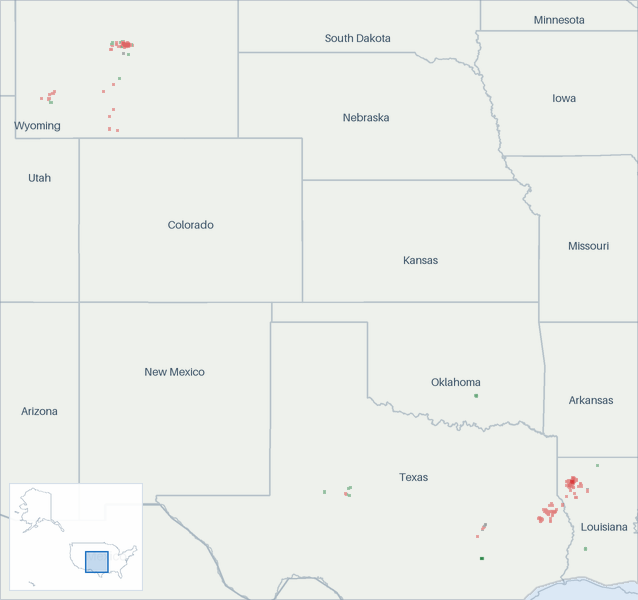
Well map of Aethon Energy. The full map is further down this page.

Production

Aethon Energy natural gas production (MMcf/d, grouped by when each well first produced)
As reported. Reported data only.
Aethon Energy natural gas production: million cubic feet per day, by first-production vintage as filed so far today 1,0002,0003,0004,000 MMcf/d 2017201820192020202120222023202420252026 May 2016: 65 MMcf/d total Jun 2016: 63.5 MMcf/d total Jul 2016: 197 MMcf/d total Aug 2016: 195 MMcf/d total Sep 2016: 203 MMcf/d total Oct 2016: 271 MMcf/d total Nov 2016: 263 MMcf/d total Dec 2016: 256 MMcf/d total Jan 2017: 317 MMcf/d total Feb 2017: 303 MMcf/d total Mar 2017: 318 MMcf/d total Apr 2017: 319 MMcf/d total May 2017: 309 MMcf/d total Jun 2017: 303 MMcf/d total Jul 2017: 287 MMcf/d total Aug 2017: 298 MMcf/d total Sep 2017: 338 MMcf/d total Oct 2017: 359 MMcf/d total Nov 2017: 363 MMcf/d total Dec 2017: 355 MMcf/d total Jan 2018: 367 MMcf/d total Feb 2018: 394 MMcf/d total Mar 2018: 403 MMcf/d total Apr 2018: 404 MMcf/d total May 2018: 406 MMcf/d total Jun 2018: 473 MMcf/d total Jul 2018: 474 MMcf/d total Aug 2018: 485 MMcf/d total Sep 2018: 528 MMcf/d total Oct 2018: 591 MMcf/d total Nov 2018: 564 MMcf/d total Dec 2018: 547 MMcf/d total Jan 2019: 532 MMcf/d total Feb 2019: 740 MMcf/d total Mar 2019: 671 MMcf/d total Apr 2019: 656 MMcf/d total May 2019: 725 MMcf/d total Jun 2019: 802 MMcf/d total Jul 2019: 971 MMcf/d total Aug 2019: 993 MMcf/d total Sep 2019: 1,070 MMcf/d total Oct 2019: 1,122 MMcf/d total Nov 2019: 1,148 MMcf/d total Dec 2019: 1,157 MMcf/d total Jan 2020: 1,202 MMcf/d total Feb 2020: 1,171 MMcf/d total Mar 2020: 1,239 MMcf/d total Apr 2020: 1,216 MMcf/d total May 2020: 1,364 MMcf/d total Jun 2020: 1,319 MMcf/d total Jul 2020: 1,261 MMcf/d total Aug 2020: 1,336 MMcf/d total Sep 2020: 1,518 MMcf/d total Oct 2020: 1,461 MMcf/d total Nov 2020: 1,611 MMcf/d total Dec 2020: 1,679 MMcf/d total Jan 2021: 1,675 MMcf/d total Feb 2021: 1,451 MMcf/d total Mar 2021: 1,688 MMcf/d total Apr 2021: 1,752 MMcf/d total May 2021: 1,752 MMcf/d total Jun 2021: 1,747 MMcf/d total Jul 2021: 1,917 MMcf/d total Aug 2021: 1,838 MMcf/d total Sep 2021: 1,889 MMcf/d total Oct 2021: 2,053 MMcf/d total Nov 2021: 2,159 MMcf/d total Dec 2021: 2,295 MMcf/d total Jan 2022: 2,197 MMcf/d total Feb 2022: 2,201 MMcf/d total Mar 2022: 1,639 MMcf/d total Apr 2022: 1,930 MMcf/d total May 2022: 2,366 MMcf/d total Jun 2022: 2,214 MMcf/d total Jul 2022: 2,166 MMcf/d total Aug 2022: 2,350 MMcf/d total Sep 2022: 2,320 MMcf/d total Oct 2022: 2,530 MMcf/d total Nov 2022: 2,587 MMcf/d total Dec 2022: 2,598 MMcf/d total Jan 2023: 2,632 MMcf/d total Feb 2023: 2,615 MMcf/d total Mar 2023: 2,608 MMcf/d total Apr 2023: 2,577 MMcf/d total May 2023: 2,827 MMcf/d total Jun 2023: 2,815 MMcf/d total Jul 2023: 2,765 MMcf/d total Aug 2023: 2,677 MMcf/d total Sep 2023: 2,649 MMcf/d total Oct 2023: 2,587 MMcf/d total Nov 2023: 2,583 MMcf/d total Dec 2023: 2,459 MMcf/d total Jan 2024: 2,603 MMcf/d total Feb 2024: 2,606 MMcf/d total Mar 2024: 2,432 MMcf/d total Apr 2024: 2,322 MMcf/d total May 2024: 2,242 MMcf/d total Jun 2024: 2,347 MMcf/d total Jul 2024: 2,361 MMcf/d total Aug 2024: 2,557 MMcf/d total Sep 2024: 2,755 MMcf/d total Oct 2024: 2,793 MMcf/d total Nov 2024: 3,067 MMcf/d total Dec 2024: 2,757 MMcf/d total Jan 2025: 2,918 MMcf/d total Feb 2025: 3,075 MMcf/d total Mar 2025: 2,866 MMcf/d total Apr 2025: 2,826 MMcf/d total May 2025: 2,736 MMcf/d total Jun 2025: 2,793 MMcf/d total Jul 2025: 2,760 MMcf/d total Aug 2025: 2,664 MMcf/d total Sep 2025: 2,710 MMcf/d total Oct 2025: 2,621 MMcf/d total Nov 2025: 2,609 MMcf/d total Dec 2025: 2,494 MMcf/d total Jan 2026: 2,495 MMcf/d total Feb 2026: 2,556 MMcf/d total Mar 2026: 0 MMcf/d total Apr 2026: 0 MMcf/d total May 2026: 0 MMcf/d as filed so far. Filings for this month are still arriving. The chart shows what has been filed. Jun 2026: 0 MMcf/d as filed so far. Filings for this month are still arriving. The chart shows what has been filed. Jul 2026: 0.08 MMcf/d as filed so far. Filings for this month are still arriving. The chart shows what has been filed. Aug 2026: 0.08 MMcf/d as filed so far. Filings for this month are still arriving. The chart shows what has been filed.

Still arriving: Sep 2026 43% filed, Oct 2026 <1% filed.

All from what the source published. All held at well grain.

How the volume breaks down
  • 77.8% Reported by the official source by well
  • 22.0% Reported by the official source as a lease total, split across the lease's wells. The regional total shown is the reported number, to rounding.
  • 0.06% A series adjusted to match official published figures: a well's cumulative, a later correction netted into the months before it, a field's oil volume from the royalty file for a month missing from the production report, or a state's yearly total from a second official source.
  • 0.09% The official source filed this volume for its reporting unit without naming the well. The well shown is our attribution, made only where a measured one-well ground identifies it; the volume itself is the source's own figure, untouched.

Every cubic foot here starts from what the official source published for the months measured. Measured over January 1978 to April 2026.

Aethon Energy natural gas production (MMcf/d, grouped by when each well first produced)
As reported. Reported data only.
Aethon Energy natural gas production: million cubic feet per day, by first-production vintage as filed so far today 20406080 MMcf/d 2017201820192020202120222023202420252026 May 2016: 23.2 MMcf/d total Jun 2016: 23.2 MMcf/d total Jul 2016: 24.8 MMcf/d total Aug 2016: 20.2 MMcf/d total Sep 2016: 21.3 MMcf/d total Oct 2016: 24.9 MMcf/d total Nov 2016: 23.8 MMcf/d total Dec 2016: 23.1 MMcf/d total Jan 2017: 22.9 MMcf/d total Feb 2017: 22.9 MMcf/d total Mar 2017: 22.6 MMcf/d total Apr 2017: 22.5 MMcf/d total May 2017: 23 MMcf/d total Jun 2017: 22.5 MMcf/d total Jul 2017: 21.5 MMcf/d total Aug 2017: 21.6 MMcf/d total Sep 2017: 21.3 MMcf/d total Oct 2017: 21.5 MMcf/d total Nov 2017: 21.2 MMcf/d total Dec 2017: 20.5 MMcf/d total Jan 2018: 19.3 MMcf/d total Feb 2018: 19.1 MMcf/d total Mar 2018: 30.7 MMcf/d total Apr 2018: 56.8 MMcf/d total May 2018: 52.9 MMcf/d total Jun 2018: 49.3 MMcf/d total Jul 2018: 46 MMcf/d total Aug 2018: 43.7 MMcf/d total Sep 2018: 39.6 MMcf/d total Oct 2018: 38.6 MMcf/d total Nov 2018: 35.7 MMcf/d total Dec 2018: 31.1 MMcf/d total Jan 2019: 37.7 MMcf/d total Feb 2019: 31.8 MMcf/d total Mar 2019: 32.1 MMcf/d total Apr 2019: 41.3 MMcf/d total May 2019: 36.9 MMcf/d total Jun 2019: 36 MMcf/d total Jul 2019: 43.6 MMcf/d total Aug 2019: 42.4 MMcf/d total Sep 2019: 40.3 MMcf/d total Oct 2019: 37.3 MMcf/d total Nov 2019: 36.1 MMcf/d total Dec 2019: 37.4 MMcf/d total Jan 2020: 32.2 MMcf/d total Feb 2020: 31.2 MMcf/d total Mar 2020: 33.1 MMcf/d total Apr 2020: 27.6 MMcf/d total May 2020: 27.9 MMcf/d total Jun 2020: 21.5 MMcf/d total Jul 2020: 23.4 MMcf/d total Aug 2020: 36.1 MMcf/d total Sep 2020: 35.7 MMcf/d total Oct 2020: 55.3 MMcf/d total Nov 2020: 53.4 MMcf/d total Dec 2020: 34.1 MMcf/d total Jan 2021: 31.2 MMcf/d total Feb 2021: 29.2 MMcf/d total Mar 2021: 23 MMcf/d total Apr 2021: 25.8 MMcf/d total May 2021: 27.1 MMcf/d total Jun 2021: 28.2 MMcf/d total Jul 2021: 25.9 MMcf/d total Aug 2021: 32.4 MMcf/d total Sep 2021: 41.8 MMcf/d total Oct 2021: 39.4 MMcf/d total Nov 2021: 54.8 MMcf/d total Dec 2021: 57.4 MMcf/d total Jan 2022: 39.6 MMcf/d total Feb 2022: 39.6 MMcf/d total Mar 2022: 36 MMcf/d total Apr 2022: 33.2 MMcf/d total May 2022: 38.5 MMcf/d total Jun 2022: 48.4 MMcf/d total Jul 2022: 48.9 MMcf/d total Aug 2022: 43.2 MMcf/d total Sep 2022: 58.7 MMcf/d total Oct 2022: 44.4 MMcf/d total Nov 2022: 43.4 MMcf/d total Dec 2022: 32.9 MMcf/d total Jan 2023: 36.3 MMcf/d total Feb 2023: 34 MMcf/d total Mar 2023: 29.8 MMcf/d total Apr 2023: 26.8 MMcf/d total May 2023: 24.7 MMcf/d total Jun 2023: 21.4 MMcf/d total Jul 2023: 19.3 MMcf/d total Aug 2023: 17.9 MMcf/d total Sep 2023: 15.8 MMcf/d total Oct 2023: 15.3 MMcf/d total Nov 2023: 13 MMcf/d total Dec 2023: 11.3 MMcf/d total Jan 2024: 13.3 MMcf/d total Feb 2024: 24 MMcf/d total Mar 2024: 23.8 MMcf/d total Apr 2024: 21 MMcf/d total May 2024: 17.9 MMcf/d total Jun 2024: 15.6 MMcf/d total Jul 2024: 12 MMcf/d total Aug 2024: 9.87 MMcf/d total Sep 2024: 9.05 MMcf/d total Oct 2024: 8.97 MMcf/d total Nov 2024: 8.46 MMcf/d total Dec 2024: 8.62 MMcf/d total Jan 2025: 8.17 MMcf/d total Feb 2025: 4.69 MMcf/d total Mar 2025: 4.94 MMcf/d total Apr 2025: 5.07 MMcf/d total May 2025: 4.58 MMcf/d total Jun 2025: 4.45 MMcf/d total Jul 2025: 4.06 MMcf/d total Aug 2025: 6.33 MMcf/d total Sep 2025: 3.09 MMcf/d total Oct 2025: 1.27 MMcf/d total Nov 2025: 0.94 MMcf/d total Dec 2025: 0.54 MMcf/d total Jan 2026: 0.22 MMcf/d total Feb 2026: 0.06 MMcf/d total Mar 2026: 0.08 MMcf/d total Apr 2026: 0.06 MMcf/d total May 2026: 0.08 MMcf/d as filed so far. Filings for this month are still arriving. The chart shows what has been filed. Jun 2026: 0.06 MMcf/d as filed so far. Filings for this month are still arriving. The chart shows what has been filed. Jul 2026: 0.08 MMcf/d as filed so far. Filings for this month are still arriving. The chart shows what has been filed. Aug 2026: 0.08 MMcf/d as filed so far. Filings for this month are still arriving. The chart shows what has been filed.

Still arriving: Sep 2026 65% filed, Oct 2026 <1% filed.

Aethon Energy oil production (bbl/d, grouped by when each well first produced)
As reported. Reported data only.
Aethon Energy oil production: barrels per day, by first-production vintage as filed so far today 5001,0001,5002,000 bbl/d 2017201820192020202120222023202420252026 May 2016: 611 bbl/d total Jun 2016: 582 bbl/d total Jul 2016: 641 bbl/d total Aug 2016: 666 bbl/d total Sep 2016: 721 bbl/d total Oct 2016: 869 bbl/d total Nov 2016: 842 bbl/d total Dec 2016: 803 bbl/d total Jan 2017: 871 bbl/d total Feb 2017: 854 bbl/d total Mar 2017: 902 bbl/d total Apr 2017: 909 bbl/d total May 2017: 847 bbl/d total Jun 2017: 849 bbl/d total Jul 2017: 827 bbl/d total Aug 2017: 919 bbl/d total Sep 2017: 771 bbl/d total Oct 2017: 729 bbl/d total Nov 2017: 718 bbl/d total Dec 2017: 756 bbl/d total Jan 2018: 769 bbl/d total Feb 2018: 952 bbl/d total Mar 2018: 1,469 bbl/d total Apr 2018: 1,170 bbl/d total May 2018: 1,024 bbl/d total Jun 2018: 936 bbl/d total Jul 2018: 889 bbl/d total Aug 2018: 864 bbl/d total Sep 2018: 883 bbl/d total Oct 2018: 866 bbl/d total Nov 2018: 791 bbl/d total Dec 2018: 807 bbl/d total Jan 2019: 809 bbl/d total Feb 2019: 727 bbl/d total Mar 2019: 693 bbl/d total Apr 2019: 726 bbl/d total May 2019: 662 bbl/d total Jun 2019: 648 bbl/d total Jul 2019: 632 bbl/d total Aug 2019: 610 bbl/d total Sep 2019: 628 bbl/d total Oct 2019: 614 bbl/d total Nov 2019: 588 bbl/d total Dec 2019: 598 bbl/d total Jan 2020: 577 bbl/d total Feb 2020: 562 bbl/d total Mar 2020: 526 bbl/d total Apr 2020: 507 bbl/d total May 2020: 564 bbl/d total Jun 2020: 519 bbl/d total Jul 2020: 463 bbl/d total Aug 2020: 459 bbl/d total Sep 2020: 469 bbl/d total Oct 2020: 473 bbl/d total Nov 2020: 475 bbl/d total Dec 2020: 431 bbl/d total Jan 2021: 395 bbl/d total Feb 2021: 455 bbl/d total Mar 2021: 444 bbl/d total Apr 2021: 496 bbl/d total May 2021: 495 bbl/d total Jun 2021: 454 bbl/d total Jul 2021: 410 bbl/d total Aug 2021: 434 bbl/d total Sep 2021: 381 bbl/d total Oct 2021: 460 bbl/d total Nov 2021: 452 bbl/d total Dec 2021: 417 bbl/d total Jan 2022: 370 bbl/d total Feb 2022: 383 bbl/d total Mar 2022: 385 bbl/d total Apr 2022: 410 bbl/d total May 2022: 427 bbl/d total Jun 2022: 431 bbl/d total Jul 2022: 369 bbl/d total Aug 2022: 305 bbl/d total Sep 2022: 373 bbl/d total Oct 2022: 371 bbl/d total Nov 2022: 337 bbl/d total Dec 2022: 317 bbl/d total Jan 2023: 328 bbl/d total Feb 2023: 337 bbl/d total Mar 2023: 308 bbl/d total Apr 2023: 346 bbl/d total May 2023: 385 bbl/d total Jun 2023: 384 bbl/d total Jul 2023: 339 bbl/d total Aug 2023: 306 bbl/d total Sep 2023: 359 bbl/d total Oct 2023: 342 bbl/d total Nov 2023: 352 bbl/d total Dec 2023: 336 bbl/d total Jan 2024: 328 bbl/d total Feb 2024: 386 bbl/d total Mar 2024: 282 bbl/d total Apr 2024: 301 bbl/d total May 2024: 268 bbl/d total Jun 2024: 245 bbl/d total Jul 2024: 342 bbl/d total Aug 2024: 323 bbl/d total Sep 2024: 274 bbl/d total Oct 2024: 272 bbl/d total Nov 2024: 242 bbl/d total Dec 2024: 299 bbl/d total Jan 2025: 319 bbl/d total Feb 2025: 290 bbl/d total Mar 2025: 286 bbl/d total Apr 2025: 371 bbl/d total May 2025: 333 bbl/d total Jun 2025: 293 bbl/d total Jul 2025: 260 bbl/d total Aug 2025: 320 bbl/d total Sep 2025: 244 bbl/d total Oct 2025: 295 bbl/d total Nov 2025: 271 bbl/d total Dec 2025: 275 bbl/d total Jan 2026: 266 bbl/d total Feb 2026: 316 bbl/d total Mar 2026: 0 bbl/d total Apr 2026: 0 bbl/d total May 2026: 0 bbl/d as filed so far. Filings for this month are still arriving. The chart shows what has been filed. Jun 2026: 0 bbl/d as filed so far. Filings for this month are still arriving. The chart shows what has been filed. Jul 2026: 169 bbl/d as filed so far. Filings for this month are still arriving. The chart shows what has been filed. Aug 2026: 186 bbl/d as filed so far. Filings for this month are still arriving. The chart shows what has been filed.

Still arriving: Sep 2026 43% filed, Oct 2026 <1% filed.

All from what the source published. All held at well grain.

How the volume breaks down
  • 29.4% Reported by the official source by well
  • 70.5% Reported by the official source as a lease total, split across the lease's wells. The regional total shown is the reported number, to rounding.
  • 0.01% A series adjusted to match official published figures: a well's cumulative, a later correction netted into the months before it, a field's oil volume from the royalty file for a month missing from the production report, or a state's yearly total from a second official source.

Every barrel here starts from what the official source published for the months measured. Measured over January 1978 to April 2026.

Aethon Energy oil production (bbl/d, grouped by when each well first produced)
As reported. Reported data only.
Aethon Energy oil production: barrels per day, by first-production vintage as filed so far today 100200300400 bbl/d 2017201820192020202120222023202420252026 May 2016: 311 bbl/d total Jun 2016: 312 bbl/d total Jul 2016: 297 bbl/d total Aug 2016: 283 bbl/d total Sep 2016: 323 bbl/d total Oct 2016: 320 bbl/d total Nov 2016: 330 bbl/d total Dec 2016: 290 bbl/d total Jan 2017: 339 bbl/d total Feb 2017: 301 bbl/d total Mar 2017: 353 bbl/d total Apr 2017: 326 bbl/d total May 2017: 302 bbl/d total Jun 2017: 282 bbl/d total Jul 2017: 264 bbl/d total Aug 2017: 269 bbl/d total Sep 2017: 319 bbl/d total Oct 2017: 325 bbl/d total Nov 2017: 322 bbl/d total Dec 2017: 330 bbl/d total Jan 2018: 302 bbl/d total Feb 2018: 281 bbl/d total Mar 2018: 278 bbl/d total Apr 2018: 306 bbl/d total May 2018: 328 bbl/d total Jun 2018: 290 bbl/d total Jul 2018: 286 bbl/d total Aug 2018: 286 bbl/d total Sep 2018: 291 bbl/d total Oct 2018: 299 bbl/d total Nov 2018: 283 bbl/d total Dec 2018: 293 bbl/d total Jan 2019: 267 bbl/d total Feb 2019: 304 bbl/d total Mar 2019: 289 bbl/d total Apr 2019: 297 bbl/d total May 2019: 268 bbl/d total Jun 2019: 284 bbl/d total Jul 2019: 293 bbl/d total Aug 2019: 265 bbl/d total Sep 2019: 264 bbl/d total Oct 2019: 263 bbl/d total Nov 2019: 260 bbl/d total Dec 2019: 226 bbl/d total Jan 2020: 262 bbl/d total Feb 2020: 223 bbl/d total Mar 2020: 213 bbl/d total Apr 2020: 179 bbl/d total May 2020: 238 bbl/d total Jun 2020: 212 bbl/d total Jul 2020: 212 bbl/d total Aug 2020: 206 bbl/d total Sep 2020: 196 bbl/d total Oct 2020: 198 bbl/d total Nov 2020: 197 bbl/d total Dec 2020: 194 bbl/d total Jan 2021: 192 bbl/d total Feb 2021: 126 bbl/d total Mar 2021: 174 bbl/d total Apr 2021: 166 bbl/d total May 2021: 172 bbl/d total Jun 2021: 164 bbl/d total Jul 2021: 144 bbl/d total Aug 2021: 264 bbl/d total Sep 2021: 260 bbl/d total Oct 2021: 258 bbl/d total Nov 2021: 224 bbl/d total Dec 2021: 200 bbl/d total Jan 2022: 226 bbl/d total Feb 2022: 179 bbl/d total Mar 2022: 214 bbl/d total Apr 2022: 208 bbl/d total May 2022: 193 bbl/d total Jun 2022: 189 bbl/d total Jul 2022: 169 bbl/d total Aug 2022: 183 bbl/d total Sep 2022: 305 bbl/d total Oct 2022: 241 bbl/d total Nov 2022: 253 bbl/d total Dec 2022: 127 bbl/d total Jan 2023: 190 bbl/d total Feb 2023: 252 bbl/d total Mar 2023: 218 bbl/d total Apr 2023: 213 bbl/d total May 2023: 245 bbl/d total Jun 2023: 288 bbl/d total Jul 2023: 246 bbl/d total Aug 2023: 214 bbl/d total Sep 2023: 275 bbl/d total Oct 2023: 309 bbl/d total Nov 2023: 196 bbl/d total Dec 2023: 253 bbl/d total Jan 2024: 175 bbl/d total Feb 2024: 209 bbl/d total Mar 2024: 185 bbl/d total Apr 2024: 284 bbl/d total May 2024: 212 bbl/d total Jun 2024: 207 bbl/d total Jul 2024: 205 bbl/d total Aug 2024: 216 bbl/d total Sep 2024: 228 bbl/d total Oct 2024: 203 bbl/d total Nov 2024: 218 bbl/d total Dec 2024: 197 bbl/d total Jan 2025: 174 bbl/d total Feb 2025: 199 bbl/d total Mar 2025: 195 bbl/d total Apr 2025: 227 bbl/d total May 2025: 198 bbl/d total Jun 2025: 235 bbl/d total Jul 2025: 186 bbl/d total Aug 2025: 144 bbl/d total Sep 2025: 195 bbl/d total Oct 2025: 219 bbl/d total Nov 2025: 207 bbl/d total Dec 2025: 168 bbl/d total Jan 2026: 176 bbl/d total Feb 2026: 198 bbl/d total Mar 2026: 180 bbl/d total Apr 2026: 183 bbl/d total May 2026: 165 bbl/d as filed so far. Filings for this month are still arriving. The chart shows what has been filed. Jun 2026: 136 bbl/d as filed so far. Filings for this month are still arriving. The chart shows what has been filed. Jul 2026: 169 bbl/d as filed so far. Filings for this month are still arriving. The chart shows what has been filed. Aug 2026: 186 bbl/d as filed so far. Filings for this month are still arriving. The chart shows what has been filed.

Still arriving: Sep 2026 65% filed, Oct 2026 <1% filed.

The bands group wells by when they first produced.

About this chart

The stack shows what is holding today's rate up and how much of it is new drilling. The bands draw the filings already in.

These volumes are the production from the wells and facilities this company operates. Ownership works differently: other parties hold interests in these wells, and this company holds interests in wells that other companies operate. How we attribute production to a company

Annual table (full history)

best estimate incl. adjusted and attributed

YearOil (MMbbl)Gas produced (Bcf)
20250.11,005
20240.1940
20230.1967
20220.1824
20210.2677
20200.2500
20190.2322
20180.3172
20170.3118
20160.355
20150.114
2011——
2010——
2009——
2008<0.1<1
20070.83
20060.93
20051.03
20041.13
20031.13
20020.1<1
20000.0<1
1999——
1998——
1997<0.10
1996——
1995——
1994<0.1<1
19930.0<1
1992——
1991——
1990<0.11
1989<0.1<1
1988<0.1<1
1987<0.1<1
1986<0.11
1985<0.11
1984<0.11
1983<0.11
1982<0.11
1981<0.11
1980<0.11
1979<0.11
1978<0.11

— means no figure is published for that period.

Source: CommoVision (commovision.com)

Monthly table (last 24 months)
MonthOil (Mbbl)Gas produced (MMcf)
2026-075.33
2026-06——
2026-05——
2026-04——
2026-03——
2026-028.971,568
2026-018.277,339
2025-128.577,309
2025-118.178,282
2025-109.181,259
2025-097.381,285
2025-089.982,583
2025-078.185,545
2025-068.883,789
2025-0510.384,805
2025-0411.184,781
2025-038.988,837
2025-028.186,089
2025-019.990,471
2024-129.385,463
2024-117.391,996
2024-108.486,588
2024-098.282,640
2024-0810.079,272

— means no figure is published for that period.

Source: CommoVision (commovision.com)

Source: CommoVision · Aethon Energy, data through April 2026.

Well map

A map of 622 well locations operated by Aethon Energy for which CommoVision holds a published surface coordinate, each drawn where it is and colored by its primary product (green for oil, red for natural gas, gray where undetermined; a spot shared by more than one product shows the one with the most wells there), on a ground of land and water over faint country and state outlines and place names for orientation, with a small inset map locating this frame in the United States.
  • Oil 122
  • Natural gas 484
  • Undetermined 16
622 well locations operated by Aethon Energy, colored by primary product.
About this map

Undetermined means not enough signal to settle it. Producing wells are the ones that reported oil or gas in the trailing 12 months per region.

316.3 bbl/d Feb 2026 oil production +9.2% vs Feb last year best estimate incl. adjusted
2,556 MMcf/d Feb 2026 gas production -16.9% vs Feb last year best estimate incl. attributed
296.4 bbl/d 2025 oil production best estimate incl. adjusted
2,753.5 MMcf/d 2025 gas production best estimate incl. attributed
2,625 wells Operated producing wells tracked trailing 12 months per region

Recent permitting

34 permits approved in the 365 days to October 29, 2026
17 permits in the 90 days to October 29, 2026
17 new-well permits in the 90 days to October 29, 2026
October 29, 2026 latest approval on record
About this chart

Approvals of every permit type per month, the 24 months to Oct 2026. The last bar is Oct 2026 through October 29, 2026 (1 so far), drawn hatched. All 34 approved in the 365 days to October 29, 2026 are permits to drill a new well. Permits to drill a new well: 34 in the 365 days to October 29, 2026 and 17 in the last 90 days of that window. How permits are counted.

  • Aethon Energy was granted 34 well permits in the 365 days to October 29, 2026. Of those, 17 came in the last 90 days of that window. The latest approval on record is dated October 29, 2026.
  • All 34 approved in the 365 days to October 29, 2026 are permits to drill a new well. Permits to drill a new well: 34 in the 365 days to October 29, 2026 and 17 in the last 90 days of that window.
  • Permits counted here come from Louisiana and Texas.
Well permits approved per month: full table
MonthPermits approved
Oct 2026 (through October 29, 2026)1
Sep 20261
Aug 202615
Jul 20260
Jun 20260
May 20260
Apr 20260
Mar 20260
Feb 20264
Jan 20266
Dec 20253
Nov 20254
Oct 20254
Sep 20256
Aug 20259
Jul 20259
Jun 20257
May 20254
Apr 20250
Mar 202513
Feb 20250
Jan 20254
Dec 20246
Nov 20246

Source: CommoVision (commovision.com)

What we cover here

Each row names the grain a region’s production is held at. Where a source publishes at a coarser grain, the page says so.

DataGrainSinceBenchmark
Louisiana production well 1977-01 ~97–98% of EIA
Oklahoma production lease + well 1990-07 ~99–100% of EIA
Texas production well 1993-01 ~100% of EIA
Wyoming production well 1978-01 ~100–101% of EIA

Benchmark cells compare our series with the EIA’s published estimates.

About the EIA comparison

The two are produced differently: the EIA estimates from a survey of the largest operators and a model built to anticipate late filings, while the series compared here are rebuilt from official records as they arrive. Recent months can differ without either being wrong; the methodology page explains both methods.

Coverage rows for Aethon Energy are regenerated at every build from the same catalog of sources the data is built from.

Top regions by 2025 operated production best estimate incl. adjusted and attributed

RegionOil (MMbbl)Gas produced (Bcf)Share of 2025 output
Texas0506.950.4%
Louisiana0488.548.6%
Wyoming0.19.61.1%

Share of output counts oil and gas together, gas at its market-value weight.

What the data shows

  • Aethon Energy produced 108 Mbbl (thousand barrels) of oil and 1.01 Tcf of natural gas in 2025.
  • Aethon Energy gas production reached its highest level on record in 2025 at 1.01 Tcf.
  • Aethon Energy operated production across 4 reporting regions in 1 country (United States) in our coverage.
  • 2,625 operated producing wells tracked, trailing 12 months per region.

Corporate history

Start a free trial

Watch supply move as soon as its sources publish, with forecasts on 1.1+ million producing wells. A real API and MCP access for AI tools are live, and the Portal is open.

What the trial includes

Data use is subject to our Terms of Service.