CommoVision

See the future in real time

New Mexico

New Mexico produced 805.0 MMbbl of oil and 4.08 Tcf of natural gas in 2025. 56,359 producing wells tracked, 12 months to Jun 2026.

  • Second-largest oil-producing state among the US regions we publish, 2025.
  • 16.1% of the oil produced in the United States, 2025.
  • Oil production rose 8% in 2025 from 2024.
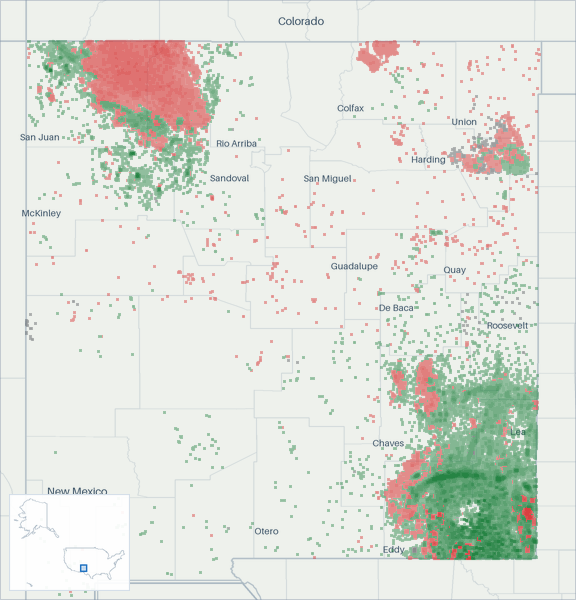
Well map of New Mexico. The full map is further down this page.

Production

New Mexico oil production (MMbbl/d, grouped by when each well first produced)
  • filling in (est. · unconfirmed) . Hatching marks our estimate of the volume still to be filed. That estimate draws on our own production forecast. This estimate is published unconfirmed. It updates as filings arrive
  • estimated . Hatching marks our estimate. In the most recent months that is volume still to be filed. Past the divider it is our estimate of each whole month, built on any filings already in. Beyond the last filings it is our forecast.
New Mexico oil production: million barrels per day, by first-production vintage filed in full 123 MMbbl/d 2017201820192020202120222023202420252026 Oct 2016: 0.41 MMbbl/d total Nov 2016: 0.42 MMbbl/d total Dec 2016: 0.42 MMbbl/d total Jan 2017: 0.42 MMbbl/d total Feb 2017: 0.44 MMbbl/d total Mar 2017: 0.44 MMbbl/d total Apr 2017: 0.45 MMbbl/d total May 2017: 0.46 MMbbl/d total Jun 2017: 0.44 MMbbl/d total Jul 2017: 0.45 MMbbl/d total Aug 2017: 0.46 MMbbl/d total Sep 2017: 0.5 MMbbl/d total Oct 2017: 0.52 MMbbl/d total Nov 2017: 0.53 MMbbl/d total Dec 2017: 0.56 MMbbl/d total Jan 2018: 0.54 MMbbl/d total Feb 2018: 0.59 MMbbl/d total Mar 2018: 0.62 MMbbl/d total Apr 2018: 0.64 MMbbl/d total May 2018: 0.65 MMbbl/d total Jun 2018: 0.66 MMbbl/d total Jul 2018: 0.67 MMbbl/d total Aug 2018: 0.71 MMbbl/d total Sep 2018: 0.74 MMbbl/d total Oct 2018: 0.77 MMbbl/d total Nov 2018: 0.8 MMbbl/d total Dec 2018: 0.82 MMbbl/d total Jan 2019: 0.81 MMbbl/d total Feb 2019: 0.83 MMbbl/d total Mar 2019: 0.86 MMbbl/d total Apr 2019: 0.87 MMbbl/d total May 2019: 0.9 MMbbl/d total Jun 2019: 0.89 MMbbl/d total Jul 2019: 0.89 MMbbl/d total Aug 2019: 0.94 MMbbl/d total Sep 2019: 0.99 MMbbl/d total Oct 2019: 0.99 MMbbl/d total Nov 2019: 1.05 MMbbl/d total Dec 2019: 1.06 MMbbl/d total Jan 2020: 1.07 MMbbl/d total Feb 2020: 1.1 MMbbl/d total Mar 2020: 1.13 MMbbl/d total Apr 2020: 1.02 MMbbl/d total May 2020: 0.85 MMbbl/d total Jun 2020: 0.95 MMbbl/d total Jul 2020: 0.99 MMbbl/d total Aug 2020: 1.01 MMbbl/d total Sep 2020: 1.04 MMbbl/d total Oct 2020: 1.08 MMbbl/d total Nov 2020: 1.1 MMbbl/d total Dec 2020: 1.06 MMbbl/d total Jan 2021: 1.09 MMbbl/d total Feb 2021: 0.99 MMbbl/d total Mar 2021: 1.17 MMbbl/d total Apr 2021: 1.18 MMbbl/d total May 2021: 1.24 MMbbl/d total Jun 2021: 1.28 MMbbl/d total Jul 2021: 1.3 MMbbl/d total Aug 2021: 1.38 MMbbl/d total Sep 2021: 1.36 MMbbl/d total Oct 2021: 1.4 MMbbl/d total Nov 2021: 1.44 MMbbl/d total Dec 2021: 1.4 MMbbl/d total Jan 2022: 1.38 MMbbl/d total Feb 2022: 1.45 MMbbl/d total Mar 2022: 1.52 MMbbl/d total Apr 2022: 1.56 MMbbl/d total May 2022: 1.58 MMbbl/d total Jun 2022: 1.57 MMbbl/d total Jul 2022: 1.63 MMbbl/d total Aug 2022: 1.66 MMbbl/d total Sep 2022: 1.73 MMbbl/d total Oct 2022: 1.75 MMbbl/d total Nov 2022: 1.75 MMbbl/d total Dec 2022: 1.81 MMbbl/d total Jan 2023: 1.86 MMbbl/d total Feb 2023: 1.82 MMbbl/d total Mar 2023: 1.87 MMbbl/d total Apr 2023: 1.88 MMbbl/d total May 2023: 1.83 MMbbl/d total Jun 2023: 1.76 MMbbl/d total Jul 2023: 1.76 MMbbl/d total Aug 2023: 1.81 MMbbl/d total Sep 2023: 1.82 MMbbl/d total Oct 2023: 1.82 MMbbl/d total Nov 2023: 1.91 MMbbl/d total Dec 2023: 1.96 MMbbl/d total Jan 2024: 1.86 MMbbl/d total Feb 2024: 1.97 MMbbl/d total Mar 2024: 2.01 MMbbl/d total Apr 2024: 2 MMbbl/d total May 2024: 2 MMbbl/d total Jun 2024: 1.99 MMbbl/d total Jul 2024: 2.02 MMbbl/d total Aug 2024: 2.1 MMbbl/d total Sep 2024: 2.08 MMbbl/d total Oct 2024: 2.12 MMbbl/d total Nov 2024: 2.13 MMbbl/d total Dec 2024: 2.12 MMbbl/d total Jan 2025: 2.03 MMbbl/d total Feb 2025: 2.11 MMbbl/d total Mar 2025: 2.2 MMbbl/d total Apr 2025: 2.15 MMbbl/d total May 2025: 2.17 MMbbl/d total Jun 2025: 2.18 MMbbl/d total Jul 2025: 2.24 MMbbl/d total Aug 2025: 2.24 MMbbl/d total Sep 2025: 2.28 MMbbl/d total Oct 2025: 2.32 MMbbl/d total Nov 2025: 2.3 MMbbl/d total Dec 2025: 2.23 MMbbl/d total Jan 2026: 2.09 MMbbl/d total Feb 2026: 2.28 MMbbl/d total Mar 2026: 2.25 MMbbl/d total Apr 2026: 2.29 MMbbl/d total May 2026: 2.31 MMbbl/d total Jun 2026: ≈2.35 MMbbl/d total (98% arrived, remainder estimated) Jul 2026: ≈2.32 MMbbl/d total (32% arrived, remainder estimated) Aug 2026: ≈2.28 MMbbl/d total (<1% arrived, remainder estimated) Sep 2026: ≈2.28 MMbbl/d total (<1% arrived, remainder estimated)

In this view, hatching marks our estimate, and in the most recent months that is volume still to be filed. Past the divider, the chart continues only the bands it has drawn. Each band continues as our estimate, from any filings already in and then from our forecast, built by summing our per-well forecasts. The method behind each well is recorded with the forecast. The forward months cover existing wells only. How our methods work

All from what the source published. All held at well grain.

How the volume breaks down
  • 79.2% Reported by the official source by well
  • 20.8% Reported by the official source for a longer period, spread across its months. The period total is the reported number.

Every barrel through May 2026 starts from what the official source published for those months. Measured over January 1930 to May 2026.

New Mexico natural gas production (Bcf/d, grouped by when each well first produced)
  • filling in (est. · unconfirmed) . Hatching marks our estimate of the volume still to be filed. That estimate draws on our own production forecast. This estimate is published unconfirmed. It updates as filings arrive
  • estimated . Hatching marks our estimate. In the most recent months that is volume still to be filed. Past the divider it is our estimate of each whole month, built on any filings already in. Beyond the last filings it is our forecast.
New Mexico natural gas production: billion cubic feet per day, by first-production vintage filed in full 51015 Bcf/d 2017201820192020202120222023202420252026 Oct 2016: 3.78 Bcf/d total Nov 2016: 3.8 Bcf/d total Dec 2016: 3.7 Bcf/d total Jan 2017: 3.63 Bcf/d total Feb 2017: 3.71 Bcf/d total Mar 2017: 3.77 Bcf/d total Apr 2017: 3.79 Bcf/d total May 2017: 3.89 Bcf/d total Jun 2017: 3.81 Bcf/d total Jul 2017: 3.84 Bcf/d total Aug 2017: 3.18 Bcf/d total Sep 2017: 3.97 Bcf/d total Oct 2017: 4.04 Bcf/d total Nov 2017: 4.05 Bcf/d total Dec 2017: 3.98 Bcf/d total Jan 2018: 3.89 Bcf/d total Feb 2018: 4.08 Bcf/d total Mar 2018: 4.21 Bcf/d total Apr 2018: 4.3 Bcf/d total May 2018: 4.28 Bcf/d total Jun 2018: 4.4 Bcf/d total Jul 2018: 4.49 Bcf/d total Aug 2018: 4.56 Bcf/d total Sep 2018: 4.55 Bcf/d total Oct 2018: 4.63 Bcf/d total Nov 2018: 4.64 Bcf/d total Dec 2018: 4.78 Bcf/d total Jan 2019: 4.76 Bcf/d total Feb 2019: 4.87 Bcf/d total Mar 2019: 4.92 Bcf/d total Apr 2019: 5 Bcf/d total May 2019: 5.01 Bcf/d total Jun 2019: 5.06 Bcf/d total Jul 2019: 5.07 Bcf/d total Aug 2019: 5.26 Bcf/d total Sep 2019: 5.35 Bcf/d total Oct 2019: 5.41 Bcf/d total Nov 2019: 5.48 Bcf/d total Dec 2019: 5.5 Bcf/d total Jan 2020: 5.58 Bcf/d total Feb 2020: 5.64 Bcf/d total Mar 2020: 5.74 Bcf/d total Apr 2020: 5.42 Bcf/d total May 2020: 4.83 Bcf/d total Jun 2020: 5.19 Bcf/d total Jul 2020: 5.52 Bcf/d total Aug 2020: 5.65 Bcf/d total Sep 2020: 5.77 Bcf/d total Oct 2020: 5.82 Bcf/d total Nov 2020: 5.81 Bcf/d total Dec 2020: 5.65 Bcf/d total Jan 2021: 5.76 Bcf/d total Feb 2021: 5.35 Bcf/d total Mar 2021: 6 Bcf/d total Apr 2021: 6.12 Bcf/d total May 2021: 6.24 Bcf/d total Jun 2021: 6.33 Bcf/d total Jul 2021: 6.48 Bcf/d total Aug 2021: 6.61 Bcf/d total Sep 2021: 6.68 Bcf/d total Oct 2021: 6.78 Bcf/d total Nov 2021: 6.89 Bcf/d total Dec 2021: 6.86 Bcf/d total Jan 2022: 6.64 Bcf/d total Feb 2022: 6.85 Bcf/d total Mar 2022: 7.31 Bcf/d total Apr 2022: 7.47 Bcf/d total May 2022: 7.46 Bcf/d total Jun 2022: 7.42 Bcf/d total Jul 2022: 7.64 Bcf/d total Aug 2022: 7.74 Bcf/d total Sep 2022: 8 Bcf/d total Oct 2022: 8.1 Bcf/d total Nov 2022: 8.09 Bcf/d total Dec 2022: 8.24 Bcf/d total Jan 2023: 8.35 Bcf/d total Feb 2023: 8.4 Bcf/d total Mar 2023: 8.78 Bcf/d total Apr 2023: 8.77 Bcf/d total May 2023: 8.65 Bcf/d total Jun 2023: 8.41 Bcf/d total Jul 2023: 8.61 Bcf/d total Aug 2023: 8.77 Bcf/d total Sep 2023: 8.81 Bcf/d total Oct 2023: 8.77 Bcf/d total Nov 2023: 9.13 Bcf/d total Dec 2023: 9.41 Bcf/d total Jan 2024: 8.92 Bcf/d total Feb 2024: 9.43 Bcf/d total Mar 2024: 9.57 Bcf/d total Apr 2024: 9.47 Bcf/d total May 2024: 9.5 Bcf/d total Jun 2024: 9.67 Bcf/d total Jul 2024: 9.87 Bcf/d total Aug 2024: 10.1 Bcf/d total Sep 2024: 10.1 Bcf/d total Oct 2024: 10.4 Bcf/d total Nov 2024: 10.4 Bcf/d total Dec 2024: 10.6 Bcf/d total Jan 2025: 10.2 Bcf/d total Feb 2025: 10.5 Bcf/d total Mar 2025: 11 Bcf/d total Apr 2025: 10.9 Bcf/d total May 2025: 11 Bcf/d total Jun 2025: 11 Bcf/d total Jul 2025: 11.3 Bcf/d total Aug 2025: 11.5 Bcf/d total Sep 2025: 11.7 Bcf/d total Oct 2025: 11.5 Bcf/d total Nov 2025: 11.8 Bcf/d total Dec 2025: 11.8 Bcf/d total Jan 2026: 11.4 Bcf/d total Feb 2026: 11.9 Bcf/d total Mar 2026: 11.8 Bcf/d total Apr 2026: 11.8 Bcf/d total May 2026: 11.8 Bcf/d total Jun 2026: ≈12.3 Bcf/d total (98% arrived, remainder estimated) Jul 2026: ≈12.3 Bcf/d total (32% arrived, remainder estimated) Aug 2026: ≈12.2 Bcf/d total (<1% arrived, remainder estimated) Sep 2026: ≈12.2 Bcf/d total (<1% arrived, remainder estimated)

In this view, hatching marks our estimate, and in the most recent months that is volume still to be filed. Past the divider, the chart continues only the bands it has drawn. Each band continues as our estimate, from any filings already in and then from our forecast, built by summing our per-well forecasts. The method behind each well is recorded with the forecast. The forward months cover existing wells only. How our methods work

All from what the source published. All held at well grain.

How the volume breaks down
  • 76.6% Reported by the official source by well
  • 23.4% Reported by the official source for a longer period, spread across its months. The period total is the reported number.

Every cubic foot through May 2026 starts from what the official source published for those months. Measured over January 1930 to May 2026.

The bands group wells by when they first produced.

About this chart

The stack shows what is holding today's rate up and how much of it is new drilling. In the reported months the bands draw the filings already in. The months still filling in are marked.

Annual table (full history)

best estimate incl. allocated

YearOil (MMbbl)Gas produced (Bcf)
2025805.04,083
2024744.63,598
2023672.33,190
2022590.12,768
2021463.82,316
2020377.92,032
2019337.01,877
2018249.31,607
2017172.31,388
2016146.61,361
2015148.11,381
2014125.11,360
2013102.81,347
201285.61,371
201171.51,384
201065.61,443
200961.21,510
200860.21,569
200759.21,635
200659.51,693
200561.01,702
200464.51,723
200366.61,712
200267.61,741
200169.21,801
200068.81,801
199965.81,769
199869.41,764
199773.81,739
199674.11,708
199571.01,628
199466.11,588
199368.41,429
199270.01,290
199170.41,059
199067.2973
198968.7910
198871.2881
198772.3862
198675.7852
198578.5834
198479.3817
198375.2797
198271.0770
198171.6735
198070.4701
197944.3545
197842.4501
197740.4465
197638.6438
197536.5414
197433.7375
197331.9347
197230.1327
197129.1316
197028.2308
196927.2301
196826.3292
196725.5284
196624.6274
196523.4255
196422.1236
196320.5221
196219.4209
196118.4196
196017.2183
195915.9167
195814.6154
195713.8139
195613.0121
195512.4102
195411.889
195311.071
195210.052
19519.141
19508.535
19498.030
19487.726
19477.423
19467.220
19457.118
19446.917
19436.817
19426.717
19416.516
19406.116
19395.414
19384.512
19373.610
19362.76
19351.73
19341.42
19331.22
19321.12
19310.91
19300.41

Source: CommoVision (commovision.com)

Monthly table (last 24 months)
MonthOil (Mbbl)Gas produced (MMcf)
2026-0668,696.7360,681
2026-0571,603.9367,205
2026-0468,617.3352,775
2026-0369,660.1366,375
2026-0263,693.0334,485
2026-0164,725.1352,889
2025-1269,234.0365,955
2025-1168,940.0353,797
2025-1071,961.2357,208
2025-0968,455.2349,512
2025-0869,538.1356,558
2025-0769,289.1351,428
2025-0665,369.4329,332
2025-0567,383.9339,652
2025-0464,636.4325,608
2025-0368,027.9341,625
2025-0259,209.1294,831
2025-0162,969.8317,127
2024-1265,638.7329,161
2024-1163,883.4312,581
2024-1065,819.0321,292
2024-0962,358.8302,040
2024-0865,070.6311,555
2024-0762,769.2306,046

Source: CommoVision (commovision.com)

Source: CommoVision · New Mexico, data through August 2026.

Well map

A map of 142,089 well locations in New Mexico for which CommoVision holds a published surface coordinate, each drawn where it is and colored by its primary product (green for oil, red for natural gas, gray where undetermined; a spot shared by more than one product shows the one with the most wells there), on a ground of land and water over faint country, state and county outlines and place names for orientation, with a small inset map locating this frame in the United States.
  • Oil 84,825
  • Natural gas 53,480
  • Undetermined 3,784
142,089 well locations in New Mexico, colored by primary product.
About this map

Undetermined means not enough signal to settle it. Producing wells are the ones that reported oil or gas in the 12 months to Jun 2026.

2.35 MMbbl/d (est.) Jun 2026 oil production Jun 2026 is still filling in. The figure is the filings already in plus an estimate of the part not yet filed. The change compares this estimate with the same month last year. +7.7% vs Jun last year
12.34 Bcf/d (est.) Jun 2026 gas production Jun 2026 is still filling in. The figure is the filings already in plus an estimate of the part not yet filed. The change compares this estimate with the same month last year. +12.4% vs Jun last year
2.21 MMbbl/d 2025 oil production
11.19 Bcf/d 2025 gas production
56,359 wells Producing wells tracked 12 months to Jun 2026
1.18 MMbbl/d Existing wells, Sep 2027 forecast Our forecast for existing wells.
8.33 Bcf/d Existing wells, Sep 2027 forecast Our forecast for existing wells.

Type curves

New Mexico oil type curves (bbl/d per well, log scale, against months on production; cohorts 2010–2026)
New Mexico oil type curves: average barrels per day per well on a log scale against months on production 2010-2014: 2,590 wells; starts at 188 bbl/d per well, 152 Mbbl cumulative through month 139 (100% of its wells old enough at that month); the dashed curve runs through month 199, on our forecast where a well’s own record ends2015: 686 wells; starts at 247 bbl/d per well, 238 Mbbl cumulative through month 127 (100% of its wells old enough at that month); the dashed curve runs through month 187, on our forecast where a well’s own record ends2016: 417 wells; starts at 341 bbl/d per well, 311 Mbbl cumulative through month 115 (100% of its wells old enough at that month); the dashed curve runs through month 175, on our forecast where a well’s own record ends2017: 605 wells; starts at 424 bbl/d per well, 343 Mbbl cumulative through month 103 (100% of its wells old enough at that month); the dashed curve runs through month 163, on our forecast where a well’s own record ends2018: 984 wells; starts at 519 bbl/d per well, 374 Mbbl cumulative through month 91 (100% of its wells old enough at that month); the dashed curve runs through month 151, on our forecast where a well’s own record ends2019: 1,132 wells; starts at 624 bbl/d per well, 400 Mbbl cumulative through month 79 (100% of its wells old enough at that month); the dashed curve runs through month 139, on our forecast where a well’s own record ends2020: 846 wells; starts at 670 bbl/d per well, 434 Mbbl cumulative through month 67 (100% of its wells old enough at that month); the dashed curve runs through month 127, on our forecast where a well’s own record ends2021: 1,324 wells; starts at 562 bbl/d per well, 410 Mbbl cumulative through month 55 (100% of its wells old enough at that month); the dashed curve runs through month 115, on our forecast where a well’s own record ends2022: 1,922 wells; starts at 520 bbl/d per well, 344 Mbbl cumulative through month 43 (100% of its wells old enough at that month); the dashed curve runs through month 103, on our forecast where a well’s own record ends2023: 1,730 wells; starts at 536 bbl/d per well, 297 Mbbl cumulative through month 31 (100% of its wells old enough at that month); the dashed curve runs through month 91, on our forecast where a well’s own record ends2024: 1,907 wells; starts at 524 bbl/d per well, 242 Mbbl cumulative through month 19 (100% of its wells old enough at that month); the dashed curve runs through month 79, on our forecast where a well’s own record ends2025: 2,020 wells; starts at 483 bbl/d per well, 143 Mbbl cumulative through month 7 (100% of its wells old enough at that month); the dashed curve runs through month 67, on our forecast where a well’s own record ends2026: 1,010 wells; starts at 465 bbl/d per well, 14.2 Mbbl cumulative through month 1 (100% of its wells old enough at that month); the dashed curve runs through month 61, on our forecast where a well’s own record ends71020501002005001,0001,500bbl/d24487296120144168192216Months on production
New Mexico natural gas type curves (Mcf/d per well, log scale, against months on production; cohorts 2010–2026)
New Mexico natural gas type curves: average thousand cubic feet per day per well on a log scale against months on production 2010-2014: 2,590 wells; starts at 323 Mcf/d per well, 0.7 Bcf cumulative through month 139 (100% of its wells old enough at that month); the dashed curve runs through month 199, on our forecast where a well’s own record ends2015: 686 wells; starts at 384 Mcf/d per well, 1.0 Bcf cumulative through month 127 (100% of its wells old enough at that month); the dashed curve runs through month 187, on our forecast where a well’s own record ends2016: 417 wells; starts at 603 Mcf/d per well, 1.2 Bcf cumulative through month 115 (100% of its wells old enough at that month); the dashed curve runs through month 175, on our forecast where a well’s own record ends2017: 605 wells; starts at 836 Mcf/d per well, 1.5 Bcf cumulative through month 103 (100% of its wells old enough at that month); the dashed curve runs through month 163, on our forecast where a well’s own record ends2018: 984 wells; starts at 1,089 Mcf/d per well, 1.5 Bcf cumulative through month 91 (100% of its wells old enough at that month); the dashed curve runs through month 151, on our forecast where a well’s own record ends2019: 1,132 wells; starts at 1,308 Mcf/d per well, 1.6 Bcf cumulative through month 79 (100% of its wells old enough at that month); the dashed curve runs through month 139, on our forecast where a well’s own record ends2020: 846 wells; starts at 1,534 Mcf/d per well, 1.7 Bcf cumulative through month 67 (100% of its wells old enough at that month); the dashed curve runs through month 127, on our forecast where a well’s own record ends2021: 1,324 wells; starts at 1,368 Mcf/d per well, 1.6 Bcf cumulative through month 55 (100% of its wells old enough at that month); the dashed curve runs through month 115, on our forecast where a well’s own record ends2022: 1,922 wells; starts at 1,270 Mcf/d per well, 1.4 Bcf cumulative through month 43 (100% of its wells old enough at that month); the dashed curve runs through month 103, on our forecast where a well’s own record ends2023: 1,730 wells; starts at 1,288 Mcf/d per well, 1.1 Bcf cumulative through month 31 (100% of its wells old enough at that month); the dashed curve runs through month 91, on our forecast where a well’s own record ends2024: 1,907 wells; starts at 1,290 Mcf/d per well, 0.9 Bcf cumulative through month 19 (100% of its wells old enough at that month); the dashed curve runs through month 79, on our forecast where a well’s own record ends2025: 2,020 wells; starts at 1,223 Mcf/d per well, 0.4 Bcf cumulative through month 7 (100% of its wells old enough at that month); the dashed curve runs through month 67, on our forecast where a well’s own record ends2026: 1,010 wells; starts at 1,166 Mcf/d per well, 0.0 Bcf cumulative through month 1 (100% of its wells old enough at that month); the dashed curve runs through month 61, on our forecast where a well’s own record ends20501002005001,0002,0003,000Mcf/d24487296120144168192216Months on production

best estimate incl. allocated

Horizontal wells only. Average production per well, for wells grouped by when they first produced.

How these curves are built

Horizontal wells only: 17,173 of the 21,320 wells in these cohorts. Average daily production per well, for wells grouped by when they first produced. Includes every well of the cohort that is old enough at each month. Wells that are shut in or have stopped producing count as zero, so the average reflects the full cohort, not just survivors. Rates are calendar-day (volume ÷ days in month). The cumulative axis accumulates those same monthly averages at the average month length. Months not yet fully reported are excluded. The 2010-2014 curve draws those years as one group. The chart opens on average daily rate against months on production, the rate on a log scale. The view control switches to rate against cumulative production per well, on the same log rate scale, or to cumulative production per well against months on production, on a linear scale. Every view draws the same cohorts from the same production history. Each cohort is solid through the last month all of its wells sit inside fully reported data. Past it the dashed curve carries the same wells forward, on our forecast where a well’s own record ends, for up to five years. A dashed curve runs as far as at least nine in ten of its wells are accounted for. A well that is old enough but shut in still counts, as zero. The measured months are what these wells reported. In the forward months each well counts its own reported figure for each month it has one, our forecast for each month it has only that, and zero for the rest. The forward average counts every well of the cohort. The drawn forecast runs up to five years past the measured months. Line thickness tracks the size of each cohort.

Cohort summary table
First produced Wells Peak oil (bbl/d per well) Month-12 oil (bbl/d per well) Cum oil in series (Mbbl per well) Peak gas (Mcf/d per well) Month-12 gas (Mcf/d per well) Cum gas in series (Bcf per well) Months in series Wells old enough at last month in series Forecast months drawn
2026 1,010 465 14.2 1,166 0.0 1 100% 60
2025 2,020 1,022 143 2,695 0.4 7 100% 60
2024 1,907 1,069 280 242 2,814 1,306 0.9 19 100% 60
2023 1,730 1,031 287 297 2,478 1,159 1.1 31 100% 60
2022 1,922 1,087 286 344 2,809 1,153 1.4 43 100% 60
2021 1,324 1,161 318 410 2,810 1,182 1.6 55 100% 60
2020 846 1,135 319 434 2,776 1,199 1.7 67 100% 60
2019 1,132 1,058 274 400 2,315 1,018 1.6 79 100% 60
2018 984 911 249 374 2,019 951 1.5 91 100% 60
2017 605 807 222 343 1,747 894 1.5 103 100% 60
2016 417 674 190 311 1,356 708 1.2 115 100% 60
2015 686 451 141 238 812 544 1.0 127 100% 60
2010-2014 2,590 303 83.9 152 633 357 0.7 139 100% 60

Source: CommoVision (commovision.com)

Source: CommoVision · New Mexico type curves, per-well production by first-production cohort.

Top operators in New Mexico, 2025

  1. EOG Resources 15.7%
  2. Mewbourne Oil Company 11.1%
  3. Devon Energy 10.3%
  4. XTO Energy 10.1%
  5. Occidental Petroleum 6.5%
  6. Matador Resources Company 6.5%
  7. Permian Resources 6.2%
  8. Concho Resources 5.2%
  9. Chevron 4.8%
  10. Coterra Energy 4.1%
  11. 327 other operators 19.6%
Top operators in New Mexico, 2025: full table
OperatorOil (Mbbl/d, 2025)Gas produced (MMcf/d, 2025)Share of output
EOG Resources 350.11,697.615.7%
Mewbourne Oil Company 260.3994.211.1%
Devon Energy 229.61,103.410.3%
XTO Energy 226.01,079.710.1%
Occidental Petroleum 143.3743.66.5%
Matador Resources Company 150.6613.16.5%
Permian Resources 150.5498.26.2%
Concho Resources 117.2532.55.2%
Chevron 108.8476.54.8%
Coterra Energy 97.3344.84.1%
327 other operators 371.83,101.819.6%

Mbbl/d = thousand barrels per day · MMcf/d = million cubic feet per day (units).

Source: CommoVision (commovision.com)

Top counties by 2025 production

CountyOil (MMbbl)Gas produced (Bcf)Share of 2025 output
Lea County, New Mexico434.81576.647.0%
Eddy County, New Mexico356.31894.745.2%
San Juan County, New Mexico7.8283.33.7%
Rio Arriba County, New Mexico1.8243.42.9%
Harding County, New Mexico028.50.3%

Share of output counts oil and gas together, gas at its market-value weight.

Recent permitting

3,549 permits approved in the 365 days to September 14, 2026
1,277 permits in the 90 days to September 14, 2026
1,277 new-well permits in the 90 days to September 14, 2026
September 14, 2026 latest approval on record
About this chart

Approvals of every permit type per month, the 24 months to Sep 2026. The last bar is Sep 2026 through September 14, 2026 (117 so far), drawn hatched. All 3,549 approved in the 365 days to September 14, 2026 are permits to drill a new well. Permits to drill a new well: 3,549 in the 365 days to September 14, 2026 and 1,277 in the last 90 days of that window. How permits are counted.

Most permits 365 days to September 14, 2026

  1. Permian Resources 524 · 14.8%
  2. EOG Resources 447 · 12.6%
  3. Devon Energy 394 · 11.1%
  4. XTO Energy 315 · 8.9%
  5. Matador Resources Company 247 · 7.0%
  • In New Mexico, 3,549 well permits were approved in the 365 days to September 14, 2026. Of those, 1,277 came in the last 90 days of that window. The latest approval on record is dated September 14, 2026.
  • All 3,549 approved in the 365 days to September 14, 2026 are permits to drill a new well. Permits to drill a new well: 3,549 in the 365 days to September 14, 2026 and 1,277 in the last 90 days of that window.
Well permits approved per month: full table
MonthPermits approved
Sep 2026 (through September 14, 2026)117
Aug 2026503
Jul 2026404
Jun 2026394
May 2026210
Apr 2026228
Mar 2026219
Feb 2026243
Jan 2026318
Dec 2025331
Nov 2025189
Oct 2025218
Sep 2025346
Aug 2025308
Jul 2025281
Jun 2025366
May 2025188
Apr 2025256
Mar 2025225
Feb 2025339
Jan 2025276
Dec 2024380
Nov 2024207
Oct 2024391

Source: CommoVision (commovision.com)

Active drilling rigs

92 rigs active in the week to September 11, 2026
−2 rigs vs the same week a year earlier
117 rigs peak week, Mar 2020 (since Sep 2016)
Active drilling rigs by rig type (rigs, weekly count)Source: Baker Hughes rig count
Oil Gas Miscellaneous
Active drilling rigs by rig type: rigs, weekly count 50 100 150 rigs 2017201820192020202120222023202420252026 Week to Sep 16, 2016: 28 rigs total (Oil 28, Gas 0, Miscellaneous 0) Week to Sep 23, 2016: 27 rigs total (Oil 27, Gas 0, Miscellaneous 0) Week to Sep 30, 2016: 30 rigs total (Oil 30, Gas 0, Miscellaneous 0) Week to Oct 7, 2016: 29 rigs total (Oil 29, Gas 0, Miscellaneous 0) Week to Oct 14, 2016: 32 rigs total (Oil 32, Gas 0, Miscellaneous 0) Week to Oct 21, 2016: 34 rigs total (Oil 34, Gas 0, Miscellaneous 0) Week to Oct 28, 2016: 32 rigs total (Oil 32, Gas 0, Miscellaneous 0) Week to Nov 4, 2016: 32 rigs total (Oil 32, Gas 0, Miscellaneous 0) Week to Nov 11, 2016: 31 rigs total (Oil 31, Gas 0, Miscellaneous 0) Week to Nov 18, 2016: 31 rigs total (Oil 31, Gas 0, Miscellaneous 0) Week to Nov 23, 2016: 29 rigs total (Oil 29, Gas 0, Miscellaneous 0) Week to Dec 2, 2016: 29 rigs total (Oil 29, Gas 0, Miscellaneous 0) Week to Dec 9, 2016: 30 rigs total (Oil 30, Gas 0, Miscellaneous 0) Week to Dec 16, 2016: 32 rigs total (Oil 32, Gas 0, Miscellaneous 0) Week to Dec 23, 2016: 33 rigs total (Oil 33, Gas 0, Miscellaneous 0) Week to Dec 30, 2016: 34 rigs total (Oil 34, Gas 0, Miscellaneous 0) Week to Jan 6, 2017: 37 rigs total (Oil 37, Gas 0, Miscellaneous 0) Week to Jan 13, 2017: 37 rigs total (Oil 37, Gas 0, Miscellaneous 0) Week to Jan 20, 2017: 38 rigs total (Oil 38, Gas 0, Miscellaneous 0) Week to Jan 27, 2017: 42 rigs total (Oil 42, Gas 0, Miscellaneous 0) Week to Feb 3, 2017: 46 rigs total (Oil 46, Gas 0, Miscellaneous 0) Week to Feb 10, 2017: 50 rigs total (Oil 50, Gas 0, Miscellaneous 0) Week to Feb 17, 2017: 48 rigs total (Oil 48, Gas 0, Miscellaneous 0) Week to Feb 24, 2017: 48 rigs total (Oil 48, Gas 0, Miscellaneous 0) Week to Mar 3, 2017: 47 rigs total (Oil 47, Gas 0, Miscellaneous 0) Week to Mar 10, 2017: 46 rigs total (Oil 46, Gas 0, Miscellaneous 0) Week to Mar 17, 2017: 45 rigs total (Oil 45, Gas 0, Miscellaneous 0) Week to Mar 24, 2017: 48 rigs total (Oil 48, Gas 0, Miscellaneous 0) Week to Mar 31, 2017: 50 rigs total (Oil 49, Gas 1, Miscellaneous 0) Week to Apr 7, 2017: 51 rigs total (Oil 50, Gas 1, Miscellaneous 0) Week to Apr 13, 2017: 58 rigs total (Oil 57, Gas 1, Miscellaneous 0) Week to Apr 21, 2017: 58 rigs total (Oil 57, Gas 1, Miscellaneous 0) Week to Apr 28, 2017: 55 rigs total (Oil 54, Gas 1, Miscellaneous 0) Week to May 5, 2017: 56 rigs total (Oil 55, Gas 1, Miscellaneous 0) Week to May 12, 2017: 55 rigs total (Oil 54, Gas 1, Miscellaneous 0) Week to May 19, 2017: 56 rigs total (Oil 55, Gas 1, Miscellaneous 0) Week to May 26, 2017: 57 rigs total (Oil 57, Gas 0, Miscellaneous 0) Week to Jun 2, 2017: 55 rigs total (Oil 55, Gas 0, Miscellaneous 0) Week to Jun 9, 2017: 59 rigs total (Oil 59, Gas 0, Miscellaneous 0) Week to Jun 16, 2017: 61 rigs total (Oil 61, Gas 0, Miscellaneous 0) Week to Jun 23, 2017: 60 rigs total (Oil 60, Gas 0, Miscellaneous 0) Week to Jun 30, 2017: 60 rigs total (Oil 60, Gas 0, Miscellaneous 0) Week to Jul 7, 2017: 59 rigs total (Oil 59, Gas 0, Miscellaneous 0) Week to Jul 14, 2017: 59 rigs total (Oil 59, Gas 0, Miscellaneous 0) Week to Jul 21, 2017: 57 rigs total (Oil 57, Gas 0, Miscellaneous 0) Week to Jul 28, 2017: 61 rigs total (Oil 61, Gas 0, Miscellaneous 0) Week to Aug 4, 2017: 60 rigs total (Oil 60, Gas 0, Miscellaneous 0) Week to Aug 11, 2017: 61 rigs total (Oil 61, Gas 0, Miscellaneous 0) Week to Aug 18, 2017: 62 rigs total (Oil 62, Gas 0, Miscellaneous 0) Week to Aug 25, 2017: 62 rigs total (Oil 62, Gas 0, Miscellaneous 0) Week to Sep 1, 2017: 65 rigs total (Oil 65, Gas 0, Miscellaneous 0) Week to Sep 8, 2017: 68 rigs total (Oil 68, Gas 0, Miscellaneous 0) Week to Sep 15, 2017: 67 rigs total (Oil 67, Gas 0, Miscellaneous 0) Week to Sep 22, 2017: 68 rigs total (Oil 68, Gas 0, Miscellaneous 0) Week to Sep 29, 2017: 69 rigs total (Oil 69, Gas 0, Miscellaneous 0) Week to Oct 6, 2017: 69 rigs total (Oil 69, Gas 0, Miscellaneous 0) Week to Oct 13, 2017: 69 rigs total (Oil 69, Gas 0, Miscellaneous 0) Week to Oct 20, 2017: 68 rigs total (Oil 68, Gas 0, Miscellaneous 0) Week to Oct 27, 2017: 67 rigs total (Oil 67, Gas 0, Miscellaneous 0) Week to Nov 3, 2017: 65 rigs total (Oil 65, Gas 0, Miscellaneous 0) Week to Nov 10, 2017: 69 rigs total (Oil 69, Gas 0, Miscellaneous 0) Week to Nov 17, 2017: 68 rigs total (Oil 68, Gas 0, Miscellaneous 0) Week to Nov 22, 2017: 69 rigs total (Oil 69, Gas 0, Miscellaneous 0) Week to Dec 1, 2017: 70 rigs total (Oil 70, Gas 0, Miscellaneous 0) Week to Dec 8, 2017: 73 rigs total (Oil 73, Gas 0, Miscellaneous 0) Week to Dec 15, 2017: 71 rigs total (Oil 71, Gas 0, Miscellaneous 0) Week to Dec 22, 2017: 75 rigs total (Oil 75, Gas 0, Miscellaneous 0) Week to Dec 29, 2017: 75 rigs total (Oil 75, Gas 0, Miscellaneous 0) Week to Jan 5, 2018: 76 rigs total (Oil 75, Gas 1, Miscellaneous 0) Week to Jan 12, 2018: 81 rigs total (Oil 80, Gas 1, Miscellaneous 0) Week to Jan 19, 2018: 82 rigs total (Oil 80, Gas 2, Miscellaneous 0) Week to Jan 26, 2018: 85 rigs total (Oil 83, Gas 2, Miscellaneous 0) Week to Feb 2, 2018: 85 rigs total (Oil 84, Gas 1, Miscellaneous 0) Week to Feb 9, 2018: 88 rigs total (Oil 86, Gas 2, Miscellaneous 0) Week to Feb 16, 2018: 85 rigs total (Oil 83, Gas 2, Miscellaneous 0) Week to Feb 23, 2018: 87 rigs total (Oil 86, Gas 1, Miscellaneous 0) Week to Mar 2, 2018: 88 rigs total (Oil 86, Gas 2, Miscellaneous 0) Week to Mar 9, 2018: 87 rigs total (Oil 86, Gas 1, Miscellaneous 0) Week to Mar 16, 2018: 88 rigs total (Oil 86, Gas 2, Miscellaneous 0) Week to Mar 23, 2018: 88 rigs total (Oil 87, Gas 1, Miscellaneous 0) Week to Mar 29, 2018: 87 rigs total (Oil 86, Gas 1, Miscellaneous 0) Week to Apr 6, 2018: 90 rigs total (Oil 88, Gas 2, Miscellaneous 0) Week to Apr 13, 2018: 89 rigs total (Oil 88, Gas 1, Miscellaneous 0) Week to Apr 20, 2018: 90 rigs total (Oil 88, Gas 2, Miscellaneous 0) Week to Apr 27, 2018: 87 rigs total (Oil 86, Gas 1, Miscellaneous 0) Week to May 4, 2018: 93 rigs total (Oil 91, Gas 2, Miscellaneous 0) Week to May 11, 2018: 89 rigs total (Oil 88, Gas 1, Miscellaneous 0) Week to May 18, 2018: 92 rigs total (Oil 90, Gas 2, Miscellaneous 0) Week to May 25, 2018: 91 rigs total (Oil 89, Gas 2, Miscellaneous 0) Week to Jun 1, 2018: 90 rigs total (Oil 88, Gas 2, Miscellaneous 0) Week to Jun 8, 2018: 90 rigs total (Oil 88, Gas 2, Miscellaneous 0) Week to Jun 15, 2018: 93 rigs total (Oil 90, Gas 3, Miscellaneous 0) Week to Jun 22, 2018: 93 rigs total (Oil 91, Gas 2, Miscellaneous 0) Week to Jun 29, 2018: 95 rigs total (Oil 93, Gas 2, Miscellaneous 0) Week to Jul 6, 2018: 99 rigs total (Oil 97, Gas 2, Miscellaneous 0) Week to Jul 13, 2018: 99 rigs total (Oil 97, Gas 2, Miscellaneous 0) Week to Jul 20, 2018: 103 rigs total (Oil 101, Gas 2, Miscellaneous 0) Week to Jul 27, 2018: 104 rigs total (Oil 102, Gas 2, Miscellaneous 0) Week to Aug 3, 2018: 102 rigs total (Oil 100, Gas 2, Miscellaneous 0) Week to Aug 10, 2018: 107 rigs total (Oil 106, Gas 1, Miscellaneous 0) Week to Aug 17, 2018: 104 rigs total (Oil 103, Gas 1, Miscellaneous 0) Week to Aug 24, 2018: 103 rigs total (Oil 102, Gas 1, Miscellaneous 0) Week to Aug 31, 2018: 102 rigs total (Oil 101, Gas 1, Miscellaneous 0) Week to Sep 7, 2018: 100 rigs total (Oil 99, Gas 1, Miscellaneous 0) Week to Sep 14, 2018: 99 rigs total (Oil 99, Gas 0, Miscellaneous 0) Week to Sep 21, 2018: 99 rigs total (Oil 99, Gas 0, Miscellaneous 0) Week to Sep 28, 2018: 97 rigs total (Oil 97, Gas 0, Miscellaneous 0) Week to Oct 5, 2018: 99 rigs total (Oil 99, Gas 0, Miscellaneous 0) Week to Oct 12, 2018: 102 rigs total (Oil 102, Gas 0, Miscellaneous 0) Week to Oct 19, 2018: 100 rigs total (Oil 100, Gas 0, Miscellaneous 0) Week to Oct 26, 2018: 101 rigs total (Oil 101, Gas 0, Miscellaneous 0) Week to Nov 2, 2018: 102 rigs total (Oil 102, Gas 0, Miscellaneous 0) Week to Nov 9, 2018: 106 rigs total (Oil 105, Gas 1, Miscellaneous 0) Week to Nov 16, 2018: 105 rigs total (Oil 104, Gas 1, Miscellaneous 0) Week to Nov 21, 2018: 108 rigs total (Oil 107, Gas 1, Miscellaneous 0) Week to Nov 30, 2018: 108 rigs total (Oil 107, Gas 1, Miscellaneous 0) Week to Dec 7, 2018: 110 rigs total (Oil 109, Gas 1, Miscellaneous 0) Week to Dec 14, 2018: 105 rigs total (Oil 104, Gas 1, Miscellaneous 0) Week to Dec 21, 2018: 106 rigs total (Oil 105, Gas 1, Miscellaneous 0) Week to Dec 28, 2018: 106 rigs total (Oil 105, Gas 1, Miscellaneous 0) Week to Jan 4, 2019: 105 rigs total (Oil 104, Gas 1, Miscellaneous 0) Week to Jan 11, 2019: 107 rigs total (Oil 106, Gas 1, Miscellaneous 0) Week to Jan 18, 2019: 108 rigs total (Oil 107, Gas 1, Miscellaneous 0) Week to Jan 25, 2019: 112 rigs total (Oil 111, Gas 1, Miscellaneous 0) Week to Feb 1, 2019: 112 rigs total (Oil 111, Gas 1, Miscellaneous 0) Week to Feb 8, 2019: 111 rigs total (Oil 110, Gas 1, Miscellaneous 0) Week to Feb 15, 2019: 109 rigs total (Oil 108, Gas 1, Miscellaneous 0) Week to Feb 22, 2019: 108 rigs total (Oil 107, Gas 1, Miscellaneous 0) Week to Mar 1, 2019: 107 rigs total (Oil 105, Gas 2, Miscellaneous 0) Week to Mar 8, 2019: 105 rigs total (Oil 103, Gas 2, Miscellaneous 0) Week to Mar 15, 2019: 106 rigs total (Oil 104, Gas 2, Miscellaneous 0) Week to Mar 22, 2019: 104 rigs total (Oil 102, Gas 2, Miscellaneous 0) Week to Mar 29, 2019: 104 rigs total (Oil 102, Gas 2, Miscellaneous 0) Week to Apr 5, 2019: 107 rigs total (Oil 105, Gas 2, Miscellaneous 0) Week to Apr 12, 2019: 105 rigs total (Oil 103, Gas 2, Miscellaneous 0) Week to Apr 18, 2019: 105 rigs total (Oil 103, Gas 2, Miscellaneous 0) Week to Apr 26, 2019: 104 rigs total (Oil 102, Gas 2, Miscellaneous 0) Week to May 3, 2019: 106 rigs total (Oil 104, Gas 2, Miscellaneous 0) Week to May 10, 2019: 102 rigs total (Oil 100, Gas 2, Miscellaneous 0) Week to May 17, 2019: 103 rigs total (Oil 101, Gas 2, Miscellaneous 0) Week to May 24, 2019: 99 rigs total (Oil 97, Gas 2, Miscellaneous 0) Week to May 31, 2019: 101 rigs total (Oil 99, Gas 2, Miscellaneous 0) Week to Jun 7, 2019: 101 rigs total (Oil 99, Gas 2, Miscellaneous 0) Week to Jun 14, 2019: 101 rigs total (Oil 98, Gas 3, Miscellaneous 0) Week to Jun 21, 2019: 100 rigs total (Oil 98, Gas 2, Miscellaneous 0) Week to Jun 28, 2019: 99 rigs total (Oil 97, Gas 2, Miscellaneous 0) Week to Jul 3, 2019: 102 rigs total (Oil 100, Gas 2, Miscellaneous 0) Week to Jul 12, 2019: 102 rigs total (Oil 100, Gas 2, Miscellaneous 0) Week to Jul 19, 2019: 107 rigs total (Oil 105, Gas 2, Miscellaneous 0) Week to Jul 26, 2019: 109 rigs total (Oil 107, Gas 2, Miscellaneous 0) Week to Aug 2, 2019: 107 rigs total (Oil 105, Gas 2, Miscellaneous 0) Week to Aug 9, 2019: 109 rigs total (Oil 107, Gas 2, Miscellaneous 0) Week to Aug 16, 2019: 111 rigs total (Oil 109, Gas 2, Miscellaneous 0) Week to Aug 23, 2019: 109 rigs total (Oil 107, Gas 2, Miscellaneous 0) Week to Aug 30, 2019: 108 rigs total (Oil 106, Gas 2, Miscellaneous 0) Week to Sep 6, 2019: 108 rigs total (Oil 106, Gas 2, Miscellaneous 0) Week to Sep 13, 2019: 108 rigs total (Oil 106, Gas 2, Miscellaneous 0) Week to Sep 20, 2019: 109 rigs total (Oil 107, Gas 2, Miscellaneous 0) Week to Sep 27, 2019: 109 rigs total (Oil 107, Gas 2, Miscellaneous 0) Week to Oct 4, 2019: 113 rigs total (Oil 111, Gas 2, Miscellaneous 0) Week to Oct 11, 2019: 112 rigs total (Oil 110, Gas 2, Miscellaneous 0) Week to Oct 18, 2019: 111 rigs total (Oil 109, Gas 2, Miscellaneous 0) Week to Oct 25, 2019: 110 rigs total (Oil 109, Gas 1, Miscellaneous 0) Week to Nov 1, 2019: 108 rigs total (Oil 107, Gas 1, Miscellaneous 0) Week to Nov 8, 2019: 104 rigs total (Oil 103, Gas 1, Miscellaneous 0) Week to Nov 15, 2019: 105 rigs total (Oil 104, Gas 1, Miscellaneous 0) Week to Nov 22, 2019: 104 rigs total (Oil 103, Gas 1, Miscellaneous 0) Week to Nov 27, 2019: 103 rigs total (Oil 102, Gas 1, Miscellaneous 0) Week to Dec 6, 2019: 103 rigs total (Oil 102, Gas 1, Miscellaneous 0) Week to Dec 13, 2019: 102 rigs total (Oil 101, Gas 1, Miscellaneous 0) Week to Dec 20, 2019: 103 rigs total (Oil 102, Gas 1, Miscellaneous 0) Week to Dec 27, 2019: 105 rigs total (Oil 104, Gas 1, Miscellaneous 0) Week to Jan 3, 2020: 104 rigs total (Oil 103, Gas 1, Miscellaneous 0) Week to Jan 10, 2020: 102 rigs total (Oil 102, Gas 0, Miscellaneous 0) Week to Jan 17, 2020: 105 rigs total (Oil 105, Gas 0, Miscellaneous 0) Week to Jan 24, 2020: 109 rigs total (Oil 109, Gas 0, Miscellaneous 0) Week to Jan 31, 2020: 109 rigs total (Oil 109, Gas 0, Miscellaneous 0) Week to Feb 7, 2020: 112 rigs total (Oil 112, Gas 0, Miscellaneous 0) Week to Feb 14, 2020: 113 rigs total (Oil 113, Gas 0, Miscellaneous 0) Week to Feb 21, 2020: 115 rigs total (Oil 115, Gas 0, Miscellaneous 0) Week to Feb 28, 2020: 115 rigs total (Oil 115, Gas 0, Miscellaneous 0) Week to Mar 6, 2020: 116 rigs total (Oil 116, Gas 0, Miscellaneous 0) Week to Mar 13, 2020: 117 rigs total (Oil 117, Gas 0, Miscellaneous 0) Week to Mar 20, 2020: 112 rigs total (Oil 112, Gas 0, Miscellaneous 0) Week to Mar 27, 2020: 109 rigs total (Oil 109, Gas 0, Miscellaneous 0) Week to Apr 3, 2020: 100 rigs total (Oil 100, Gas 0, Miscellaneous 0) Week to Apr 9, 2020: 93 rigs total (Oil 93, Gas 0, Miscellaneous 0) Week to Apr 17, 2020: 84 rigs total (Oil 84, Gas 0, Miscellaneous 0) Week to Apr 24, 2020: 70 rigs total (Oil 70, Gas 0, Miscellaneous 0) Week to May 1, 2020: 66 rigs total (Oil 66, Gas 0, Miscellaneous 0) Week to May 8, 2020: 70 rigs total (Oil 70, Gas 0, Miscellaneous 0) Week to May 15, 2020: 66 rigs total (Oil 66, Gas 0, Miscellaneous 0) Week to May 22, 2020: 63 rigs total (Oil 63, Gas 0, Miscellaneous 0) Week to May 29, 2020: 61 rigs total (Oil 61, Gas 0, Miscellaneous 0) Week to Jun 5, 2020: 58 rigs total (Oil 58, Gas 0, Miscellaneous 0) Week to Jun 12, 2020: 56 rigs total (Oil 56, Gas 0, Miscellaneous 0) Week to Jun 19, 2020: 51 rigs total (Oil 51, Gas 0, Miscellaneous 0) Week to Jun 26, 2020: 50 rigs total (Oil 50, Gas 0, Miscellaneous 0) Week to Jul 2, 2020: 48 rigs total (Oil 48, Gas 0, Miscellaneous 0) Week to Jul 10, 2020: 49 rigs total (Oil 49, Gas 0, Miscellaneous 0) Week to Jul 17, 2020: 50 rigs total (Oil 50, Gas 0, Miscellaneous 0) Week to Jul 24, 2020: 51 rigs total (Oil 51, Gas 0, Miscellaneous 0) Week to Jul 31, 2020: 49 rigs total (Oil 49, Gas 0, Miscellaneous 0) Week to Aug 7, 2020: 46 rigs total (Oil 45, Gas 1, Miscellaneous 0) Week to Aug 14, 2020: 45 rigs total (Oil 44, Gas 1, Miscellaneous 0) Week to Aug 21, 2020: 47 rigs total (Oil 46, Gas 1, Miscellaneous 0) Week to Aug 28, 2020: 46 rigs total (Oil 45, Gas 1, Miscellaneous 0) Week to Sep 4, 2020: 47 rigs total (Oil 46, Gas 0, Miscellaneous 1) Week to Sep 11, 2020: 46 rigs total (Oil 45, Gas 0, Miscellaneous 1) Week to Sep 18, 2020: 43 rigs total (Oil 42, Gas 0, Miscellaneous 1) Week to Sep 25, 2020: 41 rigs total (Oil 40, Gas 0, Miscellaneous 1) Week to Oct 2, 2020: 44 rigs total (Oil 43, Gas 0, Miscellaneous 1) Week to Oct 9, 2020: 45 rigs total (Oil 44, Gas 0, Miscellaneous 1) Week to Oct 16, 2020: 45 rigs total (Oil 44, Gas 0, Miscellaneous 1) Week to Oct 23, 2020: 45 rigs total (Oil 44, Gas 0, Miscellaneous 1) Week to Oct 30, 2020: 47 rigs total (Oil 46, Gas 0, Miscellaneous 1) Week to Nov 6, 2020: 50 rigs total (Oil 49, Gas 0, Miscellaneous 1) Week to Nov 13, 2020: 53 rigs total (Oil 52, Gas 0, Miscellaneous 1) Week to Nov 20, 2020: 55 rigs total (Oil 54, Gas 0, Miscellaneous 1) Week to Nov 25, 2020: 58 rigs total (Oil 57, Gas 0, Miscellaneous 1) Week to Dec 4, 2020: 59 rigs total (Oil 58, Gas 0, Miscellaneous 1) Week to Dec 11, 2020: 60 rigs total (Oil 60, Gas 0, Miscellaneous 0) Week to Dec 18, 2020: 66 rigs total (Oil 66, Gas 0, Miscellaneous 0) Week to Dec 23, 2020: 65 rigs total (Oil 65, Gas 0, Miscellaneous 0) Week to Dec 31, 2020: 65 rigs total (Oil 65, Gas 0, Miscellaneous 0) Week to Jan 8, 2021: 69 rigs total (Oil 69, Gas 0, Miscellaneous 0) Week to Jan 15, 2021: 70 rigs total (Oil 70, Gas 0, Miscellaneous 0) Week to Jan 22, 2021: 65 rigs total (Oil 65, Gas 0, Miscellaneous 0) Week to Jan 29, 2021: 62 rigs total (Oil 62, Gas 0, Miscellaneous 0) Week to Feb 5, 2021: 61 rigs total (Oil 61, Gas 0, Miscellaneous 0) Week to Feb 12, 2021: 61 rigs total (Oil 61, Gas 0, Miscellaneous 0) Week to Feb 19, 2021: 61 rigs total (Oil 61, Gas 0, Miscellaneous 0) Week to Feb 26, 2021: 62 rigs total (Oil 62, Gas 0, Miscellaneous 0) Week to Mar 5, 2021: 61 rigs total (Oil 61, Gas 0, Miscellaneous 0) Week to Mar 12, 2021: 60 rigs total (Oil 60, Gas 0, Miscellaneous 0) Week to Mar 19, 2021: 67 rigs total (Oil 67, Gas 0, Miscellaneous 0) Week to Mar 26, 2021: 67 rigs total (Oil 67, Gas 0, Miscellaneous 0) Week to Apr 1, 2021: 70 rigs total (Oil 70, Gas 0, Miscellaneous 0) Week to Apr 9, 2021: 70 rigs total (Oil 70, Gas 0, Miscellaneous 0) Week to Apr 16, 2021: 70 rigs total (Oil 70, Gas 0, Miscellaneous 0) Week to Apr 23, 2021: 71 rigs total (Oil 71, Gas 0, Miscellaneous 0) Week to Apr 30, 2021: 70 rigs total (Oil 70, Gas 0, Miscellaneous 0) Week to May 7, 2021: 70 rigs total (Oil 70, Gas 0, Miscellaneous 0) Week to May 14, 2021: 70 rigs total (Oil 70, Gas 0, Miscellaneous 0) Week to May 21, 2021: 72 rigs total (Oil 72, Gas 0, Miscellaneous 0) Week to May 28, 2021: 71 rigs total (Oil 71, Gas 0, Miscellaneous 0) Week to Jun 4, 2021: 73 rigs total (Oil 73, Gas 0, Miscellaneous 0) Week to Jun 11, 2021: 75 rigs total (Oil 75, Gas 0, Miscellaneous 0) Week to Jun 18, 2021: 75 rigs total (Oil 75, Gas 0, Miscellaneous 0) Week to Jun 25, 2021: 75 rigs total (Oil 75, Gas 0, Miscellaneous 0) Week to Jul 2, 2021: 75 rigs total (Oil 75, Gas 0, Miscellaneous 0) Week to Jul 9, 2021: 75 rigs total (Oil 75, Gas 0, Miscellaneous 0) Week to Jul 16, 2021: 75 rigs total (Oil 75, Gas 0, Miscellaneous 0) Week to Jul 23, 2021: 75 rigs total (Oil 75, Gas 0, Miscellaneous 0) Week to Jul 30, 2021: 74 rigs total (Oil 74, Gas 0, Miscellaneous 0) Week to Aug 6, 2021: 75 rigs total (Oil 75, Gas 0, Miscellaneous 0) Week to Aug 13, 2021: 80 rigs total (Oil 79, Gas 1, Miscellaneous 0) Week to Aug 20, 2021: 80 rigs total (Oil 79, Gas 1, Miscellaneous 0) Week to Aug 27, 2021: 81 rigs total (Oil 80, Gas 1, Miscellaneous 0) Week to Sep 3, 2021: 82 rigs total (Oil 81, Gas 1, Miscellaneous 0) Week to Sep 10, 2021: 82 rigs total (Oil 81, Gas 1, Miscellaneous 0) Week to Sep 17, 2021: 84 rigs total (Oil 83, Gas 1, Miscellaneous 0) Week to Sep 24, 2021: 84 rigs total (Oil 83, Gas 1, Miscellaneous 0) Week to Oct 1, 2021: 86 rigs total (Oil 85, Gas 1, Miscellaneous 0) Week to Oct 8, 2021: 86 rigs total (Oil 85, Gas 1, Miscellaneous 0) Week to Oct 15, 2021: 85 rigs total (Oil 84, Gas 1, Miscellaneous 0) Week to Oct 22, 2021: 87 rigs total (Oil 86, Gas 1, Miscellaneous 0) Week to Oct 29, 2021: 87 rigs total (Oil 85, Gas 2, Miscellaneous 0) Week to Nov 5, 2021: 86 rigs total (Oil 86, Gas 0, Miscellaneous 0) Week to Nov 12, 2021: 81 rigs total (Oil 81, Gas 0, Miscellaneous 0) Week to Nov 19, 2021: 83 rigs total (Oil 83, Gas 0, Miscellaneous 0) Week to Nov 24, 2021: 83 rigs total (Oil 83, Gas 0, Miscellaneous 0) Week to Dec 3, 2021: 88 rigs total (Oil 88, Gas 0, Miscellaneous 0) Week to Dec 10, 2021: 90 rigs total (Oil 90, Gas 0, Miscellaneous 0) Week to Dec 17, 2021: 89 rigs total (Oil 89, Gas 0, Miscellaneous 0) Week to Dec 23, 2021: 93 rigs total (Oil 93, Gas 0, Miscellaneous 0) Week to Dec 31, 2021: 94 rigs total (Oil 94, Gas 0, Miscellaneous 0) Week to Jan 7, 2022: 95 rigs total (Oil 95, Gas 0, Miscellaneous 0) Week to Jan 14, 2022: 95 rigs total (Oil 95, Gas 0, Miscellaneous 0) Week to Jan 21, 2022: 95 rigs total (Oil 95, Gas 0, Miscellaneous 0) Week to Jan 28, 2022: 94 rigs total (Oil 94, Gas 0, Miscellaneous 0) Week to Feb 4, 2022: 92 rigs total (Oil 92, Gas 0, Miscellaneous 0) Week to Feb 11, 2022: 92 rigs total (Oil 92, Gas 0, Miscellaneous 0) Week to Feb 18, 2022: 94 rigs total (Oil 94, Gas 0, Miscellaneous 0) Week to Feb 25, 2022: 95 rigs total (Oil 95, Gas 0, Miscellaneous 0) Week to Mar 4, 2022: 99 rigs total (Oil 99, Gas 0, Miscellaneous 0) Week to Mar 11, 2022: 98 rigs total (Oil 98, Gas 0, Miscellaneous 0) Week to Mar 18, 2022: 97 rigs total (Oil 95, Gas 2, Miscellaneous 0) Week to Mar 25, 2022: 96 rigs total (Oil 94, Gas 2, Miscellaneous 0) Week to Apr 1, 2022: 96 rigs total (Oil 94, Gas 2, Miscellaneous 0) Week to Apr 8, 2022: 96 rigs total (Oil 94, Gas 2, Miscellaneous 0) Week to Apr 14, 2022: 95 rigs total (Oil 93, Gas 2, Miscellaneous 0) Week to Apr 22, 2022: 95 rigs total (Oil 93, Gas 2, Miscellaneous 0) Week to Apr 29, 2022: 97 rigs total (Oil 94, Gas 3, Miscellaneous 0) Week to May 6, 2022: 98 rigs total (Oil 95, Gas 3, Miscellaneous 0) Week to May 13, 2022: 98 rigs total (Oil 95, Gas 3, Miscellaneous 0) Week to May 20, 2022: 98 rigs total (Oil 95, Gas 3, Miscellaneous 0) Week to May 27, 2022: 98 rigs total (Oil 95, Gas 3, Miscellaneous 0) Week to Jun 3, 2022: 98 rigs total (Oil 95, Gas 3, Miscellaneous 0) Week to Jun 10, 2022: 103 rigs total (Oil 100, Gas 3, Miscellaneous 0) Week to Jun 17, 2022: 110 rigs total (Oil 107, Gas 3, Miscellaneous 0) Week to Jun 24, 2022: 111 rigs total (Oil 108, Gas 3, Miscellaneous 0) Week to Jul 1, 2022: 112 rigs total (Oil 109, Gas 3, Miscellaneous 0) Week to Jul 8, 2022: 112 rigs total (Oil 109, Gas 3, Miscellaneous 0) Week to Jul 15, 2022: 110 rigs total (Oil 107, Gas 3, Miscellaneous 0) Week to Jul 22, 2022: 109 rigs total (Oil 105, Gas 4, Miscellaneous 0) Week to Jul 29, 2022: 110 rigs total (Oil 106, Gas 4, Miscellaneous 0) Week to Aug 5, 2022: 104 rigs total (Oil 99, Gas 5, Miscellaneous 0) Week to Aug 12, 2022: 104 rigs total (Oil 99, Gas 5, Miscellaneous 0) Week to Aug 19, 2022: 106 rigs total (Oil 101, Gas 5, Miscellaneous 0) Week to Aug 26, 2022: 106 rigs total (Oil 100, Gas 6, Miscellaneous 0) Week to Sep 2, 2022: 108 rigs total (Oil 101, Gas 7, Miscellaneous 0) Week to Sep 9, 2022: 109 rigs total (Oil 101, Gas 8, Miscellaneous 0) Week to Sep 16, 2022: 108 rigs total (Oil 100, Gas 8, Miscellaneous 0) Week to Sep 23, 2022: 111 rigs total (Oil 104, Gas 7, Miscellaneous 0) Week to Sep 30, 2022: 113 rigs total (Oil 105, Gas 8, Miscellaneous 0) Week to Oct 7, 2022: 113 rigs total (Oil 105, Gas 8, Miscellaneous 0) Week to Oct 14, 2022: 109 rigs total (Oil 101, Gas 8, Miscellaneous 0) Week to Oct 21, 2022: 105 rigs total (Oil 97, Gas 8, Miscellaneous 0) Week to Oct 28, 2022: 106 rigs total (Oil 100, Gas 6, Miscellaneous 0) Week to Nov 4, 2022: 106 rigs total (Oil 100, Gas 6, Miscellaneous 0) Week to Nov 10, 2022: 106 rigs total (Oil 100, Gas 6, Miscellaneous 0) Week to Nov 18, 2022: 103 rigs total (Oil 97, Gas 6, Miscellaneous 0) Week to Nov 23, 2022: 105 rigs total (Oil 99, Gas 6, Miscellaneous 0) Week to Dec 2, 2022: 104 rigs total (Oil 98, Gas 6, Miscellaneous 0) Week to Dec 9, 2022: 106 rigs total (Oil 100, Gas 6, Miscellaneous 0) Week to Dec 16, 2022: 107 rigs total (Oil 102, Gas 5, Miscellaneous 0) Week to Dec 22, 2022: 103 rigs total (Oil 98, Gas 5, Miscellaneous 0) Week to Dec 30, 2022: 102 rigs total (Oil 97, Gas 5, Miscellaneous 0) Week to Jan 6, 2023: 100 rigs total (Oil 96, Gas 4, Miscellaneous 0) Week to Jan 13, 2023: 103 rigs total (Oil 99, Gas 4, Miscellaneous 0) Week to Jan 20, 2023: 102 rigs total (Oil 98, Gas 4, Miscellaneous 0) Week to Jan 27, 2023: 105 rigs total (Oil 97, Gas 8, Miscellaneous 0) Week to Feb 3, 2023: 105 rigs total (Oil 95, Gas 10, Miscellaneous 0) Week to Feb 10, 2023: 109 rigs total (Oil 106, Gas 3, Miscellaneous 0) Week to Feb 17, 2023: 108 rigs total (Oil 104, Gas 4, Miscellaneous 0) Week to Feb 24, 2023: 106 rigs total (Oil 102, Gas 4, Miscellaneous 0) Week to Mar 3, 2023: 106 rigs total (Oil 102, Gas 4, Miscellaneous 0) Week to Mar 10, 2023: 103 rigs total (Oil 99, Gas 4, Miscellaneous 0) Week to Mar 17, 2023: 106 rigs total (Oil 103, Gas 3, Miscellaneous 0) Week to Mar 24, 2023: 108 rigs total (Oil 104, Gas 4, Miscellaneous 0) Week to Mar 31, 2023: 104 rigs total (Oil 100, Gas 4, Miscellaneous 0) Week to Apr 6, 2023: 103 rigs total (Oil 99, Gas 4, Miscellaneous 0) Week to Apr 14, 2023: 104 rigs total (Oil 100, Gas 4, Miscellaneous 0) Week to Apr 21, 2023: 105 rigs total (Oil 101, Gas 4, Miscellaneous 0) Week to Apr 28, 2023: 107 rigs total (Oil 103, Gas 4, Miscellaneous 0) Week to May 5, 2023: 107 rigs total (Oil 103, Gas 4, Miscellaneous 0) Week to May 12, 2023: 108 rigs total (Oil 104, Gas 4, Miscellaneous 0) Week to May 19, 2023: 109 rigs total (Oil 105, Gas 4, Miscellaneous 0) Week to May 26, 2023: 108 rigs total (Oil 104, Gas 4, Miscellaneous 0) Week to Jun 2, 2023: 107 rigs total (Oil 101, Gas 6, Miscellaneous 0) Week to Jun 9, 2023: 108 rigs total (Oil 102, Gas 6, Miscellaneous 0) Week to Jun 16, 2023: 104 rigs total (Oil 98, Gas 6, Miscellaneous 0) Week to Jun 23, 2023: 106 rigs total (Oil 99, Gas 7, Miscellaneous 0) Week to Jun 30, 2023: 108 rigs total (Oil 102, Gas 6, Miscellaneous 0) Week to Jul 7, 2023: 111 rigs total (Oil 98, Gas 13, Miscellaneous 0) Week to Jul 14, 2023: 113 rigs total (Oil 101, Gas 12, Miscellaneous 0) Week to Jul 21, 2023: 113 rigs total (Oil 102, Gas 11, Miscellaneous 0) Week to Jul 28, 2023: 111 rigs total (Oil 100, Gas 11, Miscellaneous 0) Week to Aug 4, 2023: 113 rigs total (Oil 103, Gas 10, Miscellaneous 0) Week to Aug 11, 2023: 113 rigs total (Oil 107, Gas 6, Miscellaneous 0) Week to Aug 18, 2023: 112 rigs total (Oil 107, Gas 5, Miscellaneous 0) Week to Aug 25, 2023: 107 rigs total (Oil 103, Gas 4, Miscellaneous 0) Week to Sep 1, 2023: 107 rigs total (Oil 103, Gas 4, Miscellaneous 0) Week to Sep 8, 2023: 104 rigs total (Oil 100, Gas 4, Miscellaneous 0) Week to Sep 15, 2023: 102 rigs total (Oil 98, Gas 4, Miscellaneous 0) Week to Sep 22, 2023: 100 rigs total (Oil 96, Gas 4, Miscellaneous 0) Week to Sep 29, 2023: 102 rigs total (Oil 97, Gas 5, Miscellaneous 0) Week to Oct 6, 2023: 106 rigs total (Oil 99, Gas 7, Miscellaneous 0) Week to Oct 13, 2023: 104 rigs total (Oil 97, Gas 7, Miscellaneous 0) Week to Oct 20, 2023: 101 rigs total (Oil 94, Gas 7, Miscellaneous 0) Week to Oct 27, 2023: 100 rigs total (Oil 93, Gas 7, Miscellaneous 0) Week to Nov 3, 2023: 104 rigs total (Oil 96, Gas 8, Miscellaneous 0) Week to Nov 10, 2023: 105 rigs total (Oil 97, Gas 8, Miscellaneous 0) Week to Nov 17, 2023: 107 rigs total (Oil 100, Gas 7, Miscellaneous 0) Week to Nov 22, 2023: 106 rigs total (Oil 99, Gas 7, Miscellaneous 0) Week to Dec 1, 2023: 106 rigs total (Oil 99, Gas 7, Miscellaneous 0) Week to Dec 8, 2023: 102 rigs total (Oil 95, Gas 7, Miscellaneous 0) Week to Dec 15, 2023: 100 rigs total (Oil 93, Gas 7, Miscellaneous 0) Week to Dec 21, 2023: 98 rigs total (Oil 91, Gas 7, Miscellaneous 0) Week to Dec 29, 2023: 97 rigs total (Oil 90, Gas 7, Miscellaneous 0) Week to Jan 5, 2024: 97 rigs total (Oil 91, Gas 6, Miscellaneous 0) Week to Jan 12, 2024: 97 rigs total (Oil 89, Gas 8, Miscellaneous 0) Week to Jan 19, 2024: 98 rigs total (Oil 91, Gas 7, Miscellaneous 0) Week to Jan 26, 2024: 99 rigs total (Oil 92, Gas 7, Miscellaneous 0) Week to Feb 2, 2024: 98 rigs total (Oil 91, Gas 7, Miscellaneous 0) Week to Feb 9, 2024: 101 rigs total (Oil 92, Gas 9, Miscellaneous 0) Week to Feb 16, 2024: 101 rigs total (Oil 92, Gas 9, Miscellaneous 0) Week to Feb 23, 2024: 102 rigs total (Oil 93, Gas 9, Miscellaneous 0) Week to Mar 1, 2024: 103 rigs total (Oil 94, Gas 9, Miscellaneous 0) Week to Mar 8, 2024: 106 rigs total (Oil 97, Gas 9, Miscellaneous 0) Week to Mar 15, 2024: 107 rigs total (Oil 98, Gas 9, Miscellaneous 0) Week to Mar 22, 2024: 106 rigs total (Oil 97, Gas 9, Miscellaneous 0) Week to Mar 28, 2024: 111 rigs total (Oil 102, Gas 9, Miscellaneous 0) Week to Apr 5, 2024: 108 rigs total (Oil 100, Gas 8, Miscellaneous 0) Week to Apr 12, 2024: 109 rigs total (Oil 101, Gas 8, Miscellaneous 0) Week to Apr 19, 2024: 108 rigs total (Oil 101, Gas 7, Miscellaneous 0) Week to Apr 26, 2024: 107 rigs total (Oil 100, Gas 7, Miscellaneous 0) Week to May 3, 2024: 108 rigs total (Oil 102, Gas 6, Miscellaneous 0) Week to May 10, 2024: 109 rigs total (Oil 103, Gas 6, Miscellaneous 0) Week to May 17, 2024: 107 rigs total (Oil 103, Gas 4, Miscellaneous 0) Week to May 24, 2024: 108 rigs total (Oil 104, Gas 4, Miscellaneous 0) Week to May 31, 2024: 107 rigs total (Oil 103, Gas 4, Miscellaneous 0) Week to Jun 7, 2024: 107 rigs total (Oil 103, Gas 4, Miscellaneous 0) Week to Jun 14, 2024: 108 rigs total (Oil 104, Gas 4, Miscellaneous 0) Week to Jun 21, 2024: 108 rigs total (Oil 104, Gas 4, Miscellaneous 0) Week to Jun 28, 2024: 107 rigs total (Oil 103, Gas 4, Miscellaneous 0) Week to Jul 5, 2024: 107 rigs total (Oil 103, Gas 4, Miscellaneous 0) Week to Jul 12, 2024: 107 rigs total (Oil 103, Gas 4, Miscellaneous 0) Week to Jul 19, 2024: 108 rigs total (Oil 103, Gas 5, Miscellaneous 0) Week to Jul 26, 2024: 108 rigs total (Oil 103, Gas 5, Miscellaneous 0) Week to Aug 2, 2024: 108 rigs total (Oil 103, Gas 5, Miscellaneous 0) Week to Aug 9, 2024: 107 rigs total (Oil 102, Gas 5, Miscellaneous 0) Week to Aug 16, 2024: 107 rigs total (Oil 102, Gas 5, Miscellaneous 0) Week to Aug 23, 2024: 106 rigs total (Oil 101, Gas 5, Miscellaneous 0) Week to Aug 30, 2024: 105 rigs total (Oil 100, Gas 5, Miscellaneous 0) Week to Sep 6, 2024: 106 rigs total (Oil 101, Gas 5, Miscellaneous 0) Week to Sep 13, 2024: 107 rigs total (Oil 102, Gas 5, Miscellaneous 0) Week to Sep 20, 2024: 106 rigs total (Oil 101, Gas 5, Miscellaneous 0) Week to Sep 27, 2024: 104 rigs total (Oil 98, Gas 6, Miscellaneous 0) Week to Oct 4, 2024: 101 rigs total (Oil 95, Gas 6, Miscellaneous 0) Week to Oct 11, 2024: 99 rigs total (Oil 93, Gas 6, Miscellaneous 0) Week to Oct 18, 2024: 99 rigs total (Oil 93, Gas 6, Miscellaneous 0) Week to Oct 25, 2024: 100 rigs total (Oil 94, Gas 6, Miscellaneous 0) Week to Nov 1, 2024: 100 rigs total (Oil 94, Gas 6, Miscellaneous 0) Week to Nov 8, 2024: 100 rigs total (Oil 94, Gas 6, Miscellaneous 0) Week to Nov 15, 2024: 102 rigs total (Oil 96, Gas 6, Miscellaneous 0) Week to Nov 22, 2024: 102 rigs total (Oil 96, Gas 6, Miscellaneous 0) Week to Nov 27, 2024: 102 rigs total (Oil 96, Gas 6, Miscellaneous 0) Week to Dec 6, 2024: 102 rigs total (Oil 96, Gas 6, Miscellaneous 0) Week to Dec 13, 2024: 104 rigs total (Oil 97, Gas 7, Miscellaneous 0) Week to Dec 20, 2024: 103 rigs total (Oil 97, Gas 6, Miscellaneous 0) Week to Dec 27, 2024: 103 rigs total (Oil 97, Gas 6, Miscellaneous 0) Week to Jan 3, 2025: 103 rigs total (Oil 97, Gas 6, Miscellaneous 0) Week to Jan 10, 2025: 103 rigs total (Oil 97, Gas 6, Miscellaneous 0) Week to Jan 17, 2025: 103 rigs total (Oil 97, Gas 6, Miscellaneous 0) Week to Jan 24, 2025: 102 rigs total (Oil 96, Gas 6, Miscellaneous 0) Week to Jan 31, 2025: 106 rigs total (Oil 100, Gas 6, Miscellaneous 0) Week to Feb 7, 2025: 106 rigs total (Oil 100, Gas 6, Miscellaneous 0) Week to Feb 14, 2025: 106 rigs total (Oil 100, Gas 6, Miscellaneous 0) Week to Feb 21, 2025: 105 rigs total (Oil 99, Gas 6, Miscellaneous 0) Week to Feb 28, 2025: 105 rigs total (Oil 99, Gas 6, Miscellaneous 0) Week to Mar 7, 2025: 105 rigs total (Oil 99, Gas 6, Miscellaneous 0) Week to Mar 14, 2025: 102 rigs total (Oil 97, Gas 5, Miscellaneous 0) Week to Mar 21, 2025: 102 rigs total (Oil 96, Gas 6, Miscellaneous 0) Week to Mar 28, 2025: 101 rigs total (Oil 95, Gas 6, Miscellaneous 0) Week to Apr 4, 2025: 101 rigs total (Oil 95, Gas 6, Miscellaneous 0) Week to Apr 11, 2025: 100 rigs total (Oil 94, Gas 6, Miscellaneous 0) Week to Apr 17, 2025: 100 rigs total (Oil 94, Gas 6, Miscellaneous 0) Week to Apr 25, 2025: 100 rigs total (Oil 94, Gas 6, Miscellaneous 0) Week to May 2, 2025: 100 rigs total (Oil 94, Gas 6, Miscellaneous 0) Week to May 9, 2025: 96 rigs total (Oil 90, Gas 6, Miscellaneous 0) Week to May 16, 2025: 94 rigs total (Oil 88, Gas 6, Miscellaneous 0) Week to May 23, 2025: 92 rigs total (Oil 86, Gas 6, Miscellaneous 0) Week to May 30, 2025: 91 rigs total (Oil 85, Gas 6, Miscellaneous 0) Week to Jun 6, 2025: 91 rigs total (Oil 84, Gas 7, Miscellaneous 0) Week to Jun 13, 2025: 90 rigs total (Oil 83, Gas 7, Miscellaneous 0) Week to Jun 20, 2025: 92 rigs total (Oil 86, Gas 6, Miscellaneous 0) Week to Jun 27, 2025: 92 rigs total (Oil 86, Gas 6, Miscellaneous 0) Week to Jul 3, 2025: 90 rigs total (Oil 84, Gas 6, Miscellaneous 0) Week to Jul 11, 2025: 90 rigs total (Oil 84, Gas 6, Miscellaneous 0) Week to Jul 18, 2025: 94 rigs total (Oil 85, Gas 9, Miscellaneous 0) Week to Jul 25, 2025: 93 rigs total (Oil 85, Gas 8, Miscellaneous 0) Week to Aug 1, 2025: 96 rigs total (Oil 88, Gas 8, Miscellaneous 0) Week to Aug 8, 2025: 95 rigs total (Oil 87, Gas 8, Miscellaneous 0) Week to Aug 15, 2025: 95 rigs total (Oil 87, Gas 8, Miscellaneous 0) Week to Aug 22, 2025: 95 rigs total (Oil 87, Gas 8, Miscellaneous 0) Week to Aug 29, 2025: 95 rigs total (Oil 87, Gas 8, Miscellaneous 0) Week to Sep 5, 2025: 93 rigs total (Oil 85, Gas 8, Miscellaneous 0) Week to Sep 12, 2025: 94 rigs total (Oil 86, Gas 8, Miscellaneous 0) Week to Sep 19, 2025: 94 rigs total (Oil 86, Gas 8, Miscellaneous 0) Week to Sep 26, 2025: 95 rigs total (Oil 89, Gas 6, Miscellaneous 0) Week to Oct 3, 2025: 96 rigs total (Oil 89, Gas 7, Miscellaneous 0) Week to Oct 10, 2025: 100 rigs total (Oil 93, Gas 7, Miscellaneous 0) Week to Oct 17, 2025: 102 rigs total (Oil 94, Gas 8, Miscellaneous 0) Week to Oct 24, 2025: 102 rigs total (Oil 94, Gas 8, Miscellaneous 0) Week to Oct 31, 2025: 103 rigs total (Oil 95, Gas 8, Miscellaneous 0) Week to Nov 6, 2025: 103 rigs total (Oil 95, Gas 8, Miscellaneous 0) Week to Nov 14, 2025: 105 rigs total (Oil 98, Gas 7, Miscellaneous 0) Week to Nov 21, 2025: 106 rigs total (Oil 99, Gas 7, Miscellaneous 0) Week to Nov 26, 2025: 106 rigs total (Oil 99, Gas 7, Miscellaneous 0) Week to Dec 4, 2025: 107 rigs total (Oil 100, Gas 7, Miscellaneous 0) Week to Dec 12, 2025: 104 rigs total (Oil 100, Gas 4, Miscellaneous 0) Week to Dec 19, 2025: 102 rigs total (Oil 98, Gas 4, Miscellaneous 0) Week to Dec 24, 2025: 101 rigs total (Oil 97, Gas 4, Miscellaneous 0) Week to Dec 30, 2025: 101 rigs total (Oil 97, Gas 4, Miscellaneous 0) Week to Jan 9, 2026: 100 rigs total (Oil 97, Gas 3, Miscellaneous 0) Week to Jan 16, 2026: 102 rigs total (Oil 99, Gas 3, Miscellaneous 0) Week to Jan 23, 2026: 102 rigs total (Oil 99, Gas 3, Miscellaneous 0) Week to Jan 30, 2026: 102 rigs total (Oil 99, Gas 3, Miscellaneous 0) Week to Feb 6, 2026: 101 rigs total (Oil 98, Gas 3, Miscellaneous 0) Week to Feb 13, 2026: 102 rigs total (Oil 99, Gas 3, Miscellaneous 0) Week to Feb 20, 2026: 101 rigs total (Oil 98, Gas 3, Miscellaneous 0) Week to Feb 27, 2026: 102 rigs total (Oil 98, Gas 4, Miscellaneous 0) Week to Mar 6, 2026: 100 rigs total (Oil 97, Gas 3, Miscellaneous 0) Week to Mar 13, 2026: 101 rigs total (Oil 98, Gas 3, Miscellaneous 0) Week to Mar 20, 2026: 102 rigs total (Oil 99, Gas 3, Miscellaneous 0) Week to Mar 27, 2026: 102 rigs total (Oil 99, Gas 3, Miscellaneous 0) Week to Apr 2, 2026: 103 rigs total (Oil 100, Gas 3, Miscellaneous 0) Week to Apr 10, 2026: 101 rigs total (Oil 98, Gas 3, Miscellaneous 0) Week to Apr 17, 2026: 100 rigs total (Oil 96, Gas 3, Miscellaneous 1) Week to Apr 24, 2026: 98 rigs total (Oil 94, Gas 3, Miscellaneous 1) Week to May 1, 2026: 95 rigs total (Oil 91, Gas 3, Miscellaneous 1) Week to May 8, 2026: 95 rigs total (Oil 91, Gas 3, Miscellaneous 1) Week to May 15, 2026: 96 rigs total (Oil 92, Gas 3, Miscellaneous 1) Week to May 22, 2026: 93 rigs total (Oil 88, Gas 4, Miscellaneous 1) Week to May 29, 2026: 98 rigs total (Oil 93, Gas 4, Miscellaneous 1) Week to Jun 5, 2026: 96 rigs total (Oil 91, Gas 4, Miscellaneous 1) Week to Jun 12, 2026: 97 rigs total (Oil 93, Gas 3, Miscellaneous 1) Week to Jun 18, 2026: 97 rigs total (Oil 92, Gas 4, Miscellaneous 1) Week to Jun 26, 2026: 97 rigs total (Oil 92, Gas 4, Miscellaneous 1) Week to Jul 2, 2026: 98 rigs total (Oil 92, Gas 5, Miscellaneous 1) Week to Jul 10, 2026: 94 rigs total (Oil 88, Gas 5, Miscellaneous 1) Week to Jul 17, 2026: 96 rigs total (Oil 90, Gas 5, Miscellaneous 1) Week to Jul 24, 2026: 96 rigs total (Oil 90, Gas 5, Miscellaneous 1) Week to Jul 31, 2026: 96 rigs total (Oil 90, Gas 5, Miscellaneous 1) Week to Aug 7, 2026: 96 rigs total (Oil 90, Gas 5, Miscellaneous 1) Week to Aug 14, 2026: 99 rigs total (Oil 93, Gas 5, Miscellaneous 1) Week to Aug 21, 2026: 96 rigs total (Oil 90, Gas 5, Miscellaneous 1) Week to Aug 28, 2026: 95 rigs total (Oil 89, Gas 5, Miscellaneous 1) Week to Sep 4, 2026: 95 rigs total (Oil 90, Gas 4, Miscellaneous 1) Week to Sep 11, 2026: 92 rigs total (Oil 87, Gas 4, Miscellaneous 1)

Interactive chart. Focus it and use the left and right arrow keys to read each week, Page Up and Page Down to move a year, Home and End for the ends of the series. The full figures are also in the table below.

  • In New Mexico, 92 drilling rigs were active in the week to September 11, 2026 (2 fewer than a year earlier).
  • Since Sep 2016, the weekly count peaked at 117 in Mar 2020.
  • The count covers land and inland-water rigs; rigs in US federal offshore waters are counted on the Gulf of Mexico page.
Average active rigs per month: full table
Month Oil-directedGas-directedMiscellaneousAll rigs
Sep 2026 (through September 11, 2026)874192
Aug 202690.44.8196.2
Jul 202689.55195.5
Jun 2026924197
May 2026913.5195.5
Apr 202694.830.898.5
Mar 202698.630101.6
Feb 202698.23.20101.5
Jan 202698.530101.5
Dec 202598.44.60103
Nov 202597.87.20105
Oct 2025947.80101.8
Sep 2025877.4094.4
Aug 2025878095
Jul 202585.57.8093.2
Jun 202584.66.4091
May 202587.26093.2
Apr 20259460100
Mar 202596.45.80102.2
Feb 202599.560105.5
Jan 202597.560103.5
Dec 202496.86.20103
Nov 202495.560101.5
Oct 202493.56099.5

Source: CommoVision (commovision.com)

What we cover here

Each row names the grain a region’s production is held at. Where a source publishes at a coarser grain, the page says so.

DataGrainSinceBenchmark
New Mexico production well 1924-01 ~100% of EIA

Benchmark cells compare our series with the EIA’s published estimates.

About the EIA comparison

The two are produced differently: the EIA estimates from a survey of the largest operators and a model built to anticipate late filings, while the series compared here are rebuilt from the source’s own records as they arrive. Recent months can differ without either being wrong; the methodology page explains both methods.

Coverage rows for New Mexico are regenerated at every build from the same catalog of sources the data is built from.

How our New Mexico production compares with the EIA

  • Our New Mexico oil total is 0.4% below the EIA series over July 2023 to June 2026. Those are the last 36 months our own figures have settled.
  • Our New Mexico natural gas total is 1.2% below the EIA series over July 2023 to June 2026. Those are the last 36 months our own figures have settled.
Why the two differ

The EIA estimates state totals from an operator survey. The series compared here are rebuilt from the source’s own records as they arrive. Recent months differ while filings are still arriving. Every region, beside the EIA series and why the two differ.

What the data shows

  • New Mexico produced 805.0 MMbbl of oil and 4.08 Tcf of natural gas in 2025.
  • New Mexico oil production reached its highest level on record in 2025 at 805.0 MMbbl.
  • 56,359 producing wells tracked, 12 months to Jun 2026.

Get early access

Watch supply move as soon as its sources publish, with forecasts on 1.1+ million producing wells. The portal, an API and MCP access for AI tools open on October 1, 2026.

Data use is subject to our Terms of Service.