CommoVision

See the future in real time

EOG Resources

EOG Resources produced 254.3 MMbbl of oil and 1.53 Tcf of natural gas in 2025. 12,317 operated producing wells tracked, trailing 12 months per region.

  • Largest operator by operated oil in New Mexico, 2025.
  • Operated 15.9% of the oil produced in New Mexico, 2025.
  • Oil production rose 4% in 2025 from 2024.
Operator

Under Current operator an old month can show a later company.
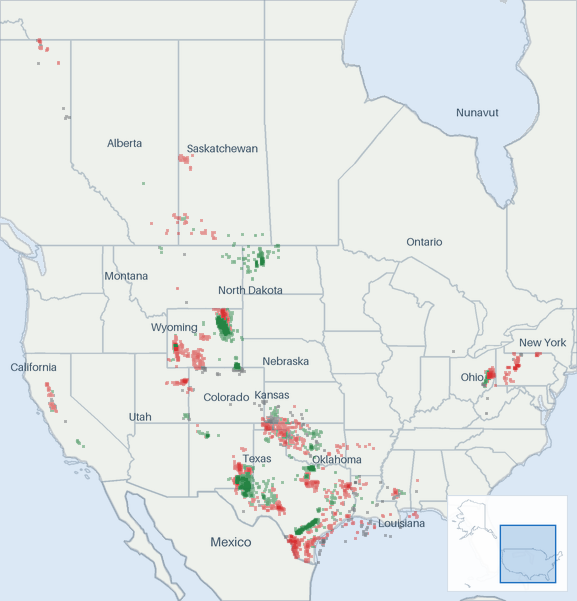
Well map of EOG Resources. The full map is further down this page.

Production

EOG Resources oil production (Mbbl/d, grouped by when each well first produced)
As reported. Reported data only.
EOG Resources oil production: thousand barrels per day, by first-production vintage as filed so far today 200400600800 Mbbl/d 2017201820192020202120222023202420252026 Mar 2016: 376 Mbbl/d total Apr 2016: 380 Mbbl/d total May 2016: 380 Mbbl/d total Jun 2016: 386 Mbbl/d total Jul 2016: 390 Mbbl/d total Aug 2016: 396 Mbbl/d total Sep 2016: 400 Mbbl/d total Oct 2016: 414 Mbbl/d total Nov 2016: 414 Mbbl/d total Dec 2016: 423 Mbbl/d total Jan 2017: 415 Mbbl/d total Feb 2017: 419 Mbbl/d total Mar 2017: 439 Mbbl/d total Apr 2017: 441 Mbbl/d total May 2017: 456 Mbbl/d total Jun 2017: 457 Mbbl/d total Jul 2017: 449 Mbbl/d total Aug 2017: 425 Mbbl/d total Sep 2017: 458 Mbbl/d total Oct 2017: 497 Mbbl/d total Nov 2017: 488 Mbbl/d total Dec 2017: 494 Mbbl/d total Jan 2018: 472 Mbbl/d total Feb 2018: 478 Mbbl/d total Mar 2018: 513 Mbbl/d total Apr 2018: 522 Mbbl/d total May 2018: 519 Mbbl/d total Jun 2018: 534 Mbbl/d total Jul 2018: 530 Mbbl/d total Aug 2018: 547 Mbbl/d total Sep 2018: 618 Mbbl/d total Oct 2018: 583 Mbbl/d total Nov 2018: 598 Mbbl/d total Dec 2018: 611 Mbbl/d total Jan 2019: 593 Mbbl/d total Feb 2019: 619 Mbbl/d total Mar 2019: 627 Mbbl/d total Apr 2019: 633 Mbbl/d total May 2019: 649 Mbbl/d total Jun 2019: 602 Mbbl/d total Jul 2019: 635 Mbbl/d total Aug 2019: 641 Mbbl/d total Sep 2019: 648 Mbbl/d total Oct 2019: 640 Mbbl/d total Nov 2019: 636 Mbbl/d total Dec 2019: 639 Mbbl/d total Jan 2020: 668 Mbbl/d total Feb 2020: 674 Mbbl/d total Mar 2020: 657 Mbbl/d total Apr 2020: 550 Mbbl/d total May 2020: 392 Mbbl/d total Jun 2020: 424 Mbbl/d total Jul 2020: 511 Mbbl/d total Aug 2020: 512 Mbbl/d total Sep 2020: 507 Mbbl/d total Oct 2020: 591 Mbbl/d total Nov 2020: 619 Mbbl/d total Dec 2020: 597 Mbbl/d total Jan 2021: 609 Mbbl/d total Feb 2021: 538 Mbbl/d total Mar 2021: 591 Mbbl/d total Apr 2021: 598 Mbbl/d total May 2021: 602 Mbbl/d total Jun 2021: 597 Mbbl/d total Jul 2021: 590 Mbbl/d total Aug 2021: 607 Mbbl/d total Sep 2021: 590 Mbbl/d total Oct 2021: 603 Mbbl/d total Nov 2021: 613 Mbbl/d total Dec 2021: 600 Mbbl/d total Jan 2022: 598 Mbbl/d total Feb 2022: 602 Mbbl/d total Mar 2022: 595 Mbbl/d total Apr 2022: 616 Mbbl/d total May 2022: 617 Mbbl/d total Jun 2022: 617 Mbbl/d total Jul 2022: 622 Mbbl/d total Aug 2022: 622 Mbbl/d total Sep 2022: 636 Mbbl/d total Oct 2022: 631 Mbbl/d total Nov 2022: 607 Mbbl/d total Dec 2022: 621 Mbbl/d total Jan 2023: 633 Mbbl/d total Feb 2023: 643 Mbbl/d total Mar 2023: 631 Mbbl/d total Apr 2023: 639 Mbbl/d total May 2023: 643 Mbbl/d total Jun 2023: 617 Mbbl/d total Jul 2023: 636 Mbbl/d total Aug 2023: 663 Mbbl/d total Sep 2023: 662 Mbbl/d total Oct 2023: 653 Mbbl/d total Nov 2023: 660 Mbbl/d total Dec 2023: 667 Mbbl/d total Jan 2024: 659 Mbbl/d total Feb 2024: 679 Mbbl/d total Mar 2024: 663 Mbbl/d total Apr 2024: 667 Mbbl/d total May 2024: 659 Mbbl/d total Jun 2024: 670 Mbbl/d total Jul 2024: 658 Mbbl/d total Aug 2024: 692 Mbbl/d total Sep 2024: 657 Mbbl/d total Oct 2024: 678 Mbbl/d total Nov 2024: 662 Mbbl/d total Dec 2024: 661 Mbbl/d total Jan 2025: 673 Mbbl/d total Feb 2025: 689 Mbbl/d total Mar 2025: 681 Mbbl/d total Apr 2025: 678 Mbbl/d total May 2025: 678 Mbbl/d total Jun 2025: 672 Mbbl/d total Jul 2025: 665 Mbbl/d total Aug 2025: 755 Mbbl/d total Sep 2025: 723 Mbbl/d total Oct 2025: 707 Mbbl/d total Nov 2025: 727 Mbbl/d total Dec 2025: 712 Mbbl/d total Jan 2026: 725 Mbbl/d total Feb 2026: 751 Mbbl/d total Mar 2026: 719 Mbbl/d as filed so far. Filings for this month are still arriving. The chart shows what has been filed. Apr 2026: 732 Mbbl/d as filed so far. Filings for this month are still arriving. The chart shows what has been filed. May 2026: 727 Mbbl/d as filed so far. Filings for this month are still arriving. The chart shows what has been filed. Jun 2026: 720 Mbbl/d as filed so far. Filings for this month are still arriving. The chart shows what has been filed. Jul 2026: 632 Mbbl/d as filed so far. Filings for this month are still arriving. The chart shows what has been filed. Aug 2026: 630 Mbbl/d as filed so far. Filings for this month are still arriving. The chart shows what has been filed. Sep 2026: 627 Mbbl/d as filed so far. Filings for this month are still arriving. The chart shows what has been filed.

Still arriving: Oct 2026 <1% filed.

All from what the source published. 99.98% held at well grain.

How the volume breaks down
  • 70.4% Reported by the official source by well
  • 0.02% Reported by the official source as a lease, facility, field or state total. Published without per-well detail.
  • 27.0% Reported by the official source as a lease total, split across the lease's wells. The regional total shown is the reported number, to rounding.
  • 0.98% Reported by the official source for a longer period, spread across its months. The period total is the reported number.
  • 1.6% A series adjusted to match official published figures: a well's cumulative, a later correction netted into the months before it, a field's oil volume from the royalty file for a month missing from the production report, or a state's yearly total from a second official source.

Every barrel here starts from what the official source published for the months measured. Measured over January 1940 to February 2026.

The gray “without per-well detail” band is volume the source reports above the well: fields, facilities, or leases the source publishes as one total. It is included so the stack still sums to the whole entity.

EOG Resources oil production (Mbbl/d, grouped by when each well first produced)
As reported. Reported data only.
EOG Resources oil production: thousand barrels per day, by first-production vintage as filed so far today 200400600800 Mbbl/d 2017201820192020202120222023202420252026 Mar 2016: 386 Mbbl/d total Apr 2016: 388 Mbbl/d total May 2016: 384 Mbbl/d total Jun 2016: 398 Mbbl/d total Jul 2016: 400 Mbbl/d total Aug 2016: 404 Mbbl/d total Sep 2016: 404 Mbbl/d total Oct 2016: 418 Mbbl/d total Nov 2016: 419 Mbbl/d total Dec 2016: 424 Mbbl/d total Jan 2017: 418 Mbbl/d total Feb 2017: 424 Mbbl/d total Mar 2017: 439 Mbbl/d total Apr 2017: 445 Mbbl/d total May 2017: 462 Mbbl/d total Jun 2017: 466 Mbbl/d total Jul 2017: 460 Mbbl/d total Aug 2017: 438 Mbbl/d total Sep 2017: 468 Mbbl/d total Oct 2017: 506 Mbbl/d total Nov 2017: 496 Mbbl/d total Dec 2017: 500 Mbbl/d total Jan 2018: 480 Mbbl/d total Feb 2018: 488 Mbbl/d total Mar 2018: 520 Mbbl/d total Apr 2018: 529 Mbbl/d total May 2018: 524 Mbbl/d total Jun 2018: 539 Mbbl/d total Jul 2018: 534 Mbbl/d total Aug 2018: 552 Mbbl/d total Sep 2018: 625 Mbbl/d total Oct 2018: 589 Mbbl/d total Nov 2018: 605 Mbbl/d total Dec 2018: 618 Mbbl/d total Jan 2019: 598 Mbbl/d total Feb 2019: 623 Mbbl/d total Mar 2019: 631 Mbbl/d total Apr 2019: 640 Mbbl/d total May 2019: 654 Mbbl/d total Jun 2019: 606 Mbbl/d total Jul 2019: 638 Mbbl/d total Aug 2019: 649 Mbbl/d total Sep 2019: 659 Mbbl/d total Oct 2019: 655 Mbbl/d total Nov 2019: 655 Mbbl/d total Dec 2019: 654 Mbbl/d total Jan 2020: 686 Mbbl/d total Feb 2020: 692 Mbbl/d total Mar 2020: 671 Mbbl/d total Apr 2020: 569 Mbbl/d total May 2020: 414 Mbbl/d total Jun 2020: 441 Mbbl/d total Jul 2020: 527 Mbbl/d total Aug 2020: 527 Mbbl/d total Sep 2020: 520 Mbbl/d total Oct 2020: 603 Mbbl/d total Nov 2020: 632 Mbbl/d total Dec 2020: 613 Mbbl/d total Jan 2021: 627 Mbbl/d total Feb 2021: 559 Mbbl/d total Mar 2021: 606 Mbbl/d total Apr 2021: 613 Mbbl/d total May 2021: 615 Mbbl/d total Jun 2021: 609 Mbbl/d total Jul 2021: 604 Mbbl/d total Aug 2021: 619 Mbbl/d total Sep 2021: 600 Mbbl/d total Oct 2021: 614 Mbbl/d total Nov 2021: 626 Mbbl/d total Dec 2021: 612 Mbbl/d total Jan 2022: 616 Mbbl/d total Feb 2022: 622 Mbbl/d total Mar 2022: 611 Mbbl/d total Apr 2022: 637 Mbbl/d total May 2022: 639 Mbbl/d total Jun 2022: 634 Mbbl/d total Jul 2022: 643 Mbbl/d total Aug 2022: 645 Mbbl/d total Sep 2022: 661 Mbbl/d total Oct 2022: 663 Mbbl/d total Nov 2022: 640 Mbbl/d total Dec 2022: 650 Mbbl/d total Jan 2023: 669 Mbbl/d total Feb 2023: 690 Mbbl/d total Mar 2023: 667 Mbbl/d total Apr 2023: 683 Mbbl/d total May 2023: 684 Mbbl/d total Jun 2023: 654 Mbbl/d total Jul 2023: 680 Mbbl/d total Aug 2023: 706 Mbbl/d total Sep 2023: 701 Mbbl/d total Oct 2023: 693 Mbbl/d total Nov 2023: 709 Mbbl/d total Dec 2023: 712 Mbbl/d total Jan 2024: 704 Mbbl/d total Feb 2024: 723 Mbbl/d total Mar 2024: 701 Mbbl/d total Apr 2024: 711 Mbbl/d total May 2024: 700 Mbbl/d total Jun 2024: 707 Mbbl/d total Jul 2024: 699 Mbbl/d total Aug 2024: 738 Mbbl/d total Sep 2024: 705 Mbbl/d total Oct 2024: 725 Mbbl/d total Nov 2024: 716 Mbbl/d total Dec 2024: 716 Mbbl/d total Jan 2025: 729 Mbbl/d total Feb 2025: 753 Mbbl/d total Mar 2025: 747 Mbbl/d total Apr 2025: 750 Mbbl/d total May 2025: 741 Mbbl/d total Jun 2025: 731 Mbbl/d total Jul 2025: 734 Mbbl/d total Aug 2025: 750 Mbbl/d total Sep 2025: 719 Mbbl/d total Oct 2025: 711 Mbbl/d total Nov 2025: 730 Mbbl/d total Dec 2025: 716 Mbbl/d total Jan 2026: 728 Mbbl/d total Feb 2026: 754 Mbbl/d total Mar 2026: 721 Mbbl/d as filed so far. Filings for this month are still arriving. The chart shows what has been filed. Apr 2026: 735 Mbbl/d as filed so far. Filings for this month are still arriving. The chart shows what has been filed. May 2026: 730 Mbbl/d as filed so far. Filings for this month are still arriving. The chart shows what has been filed. Jun 2026: 720 Mbbl/d as filed so far. Filings for this month are still arriving. The chart shows what has been filed. Jul 2026: 632 Mbbl/d as filed so far. Filings for this month are still arriving. The chart shows what has been filed. Aug 2026: 630 Mbbl/d as filed so far. Filings for this month are still arriving. The chart shows what has been filed. Sep 2026: 627 Mbbl/d as filed so far. Filings for this month are still arriving. The chart shows what has been filed.

Still arriving: Oct 2026 <1% filed.

The gray “without per-well detail” band is volume the source reports above the well: fields, facilities, or leases the source publishes as one total. It is included so the stack still sums to the whole entity.

EOG Resources natural gas production (Bcf/d, grouped by when each well first produced)
As reported. Reported data only.
EOG Resources natural gas production: billion cubic feet per day, by first-production vintage as filed so far today 246 Bcf/d 2017201820192020202120222023202420252026 Mar 2016: 1.63 Bcf/d total Apr 2016: 1.64 Bcf/d total May 2016: 1.6 Bcf/d total Jun 2016: 1.58 Bcf/d total Jul 2016: 1.6 Bcf/d total Aug 2016: 1.61 Bcf/d total Sep 2016: 1.58 Bcf/d total Oct 2016: 1.6 Bcf/d total Nov 2016: 1.52 Bcf/d total Dec 2016: 1.49 Bcf/d total Jan 2017: 1.32 Bcf/d total Feb 2017: 1.34 Bcf/d total Mar 2017: 1.37 Bcf/d total Apr 2017: 1.39 Bcf/d total May 2017: 1.41 Bcf/d total Jun 2017: 1.44 Bcf/d total Jul 2017: 1.44 Bcf/d total Aug 2017: 1.4 Bcf/d total Sep 2017: 1.45 Bcf/d total Oct 2017: 1.56 Bcf/d total Nov 2017: 1.56 Bcf/d total Dec 2017: 1.54 Bcf/d total Jan 2018: 1.51 Bcf/d total Feb 2018: 1.51 Bcf/d total Mar 2018: 1.6 Bcf/d total Apr 2018: 1.63 Bcf/d total May 2018: 1.67 Bcf/d total Jun 2018: 1.73 Bcf/d total Jul 2018: 1.77 Bcf/d total Aug 2018: 1.8 Bcf/d total Sep 2018: 1.91 Bcf/d total Oct 2018: 1.88 Bcf/d total Nov 2018: 1.86 Bcf/d total Dec 2018: 1.9 Bcf/d total Jan 2019: 1.88 Bcf/d total Feb 2019: 1.97 Bcf/d total Mar 2019: 1.94 Bcf/d total Apr 2019: 1.96 Bcf/d total May 2019: 2.03 Bcf/d total Jun 2019: 2 Bcf/d total Jul 2019: 2.05 Bcf/d total Aug 2019: 2.09 Bcf/d total Sep 2019: 2.12 Bcf/d total Oct 2019: 2.19 Bcf/d total Nov 2019: 2.24 Bcf/d total Dec 2019: 2.21 Bcf/d total Jan 2020: 2.19 Bcf/d total Feb 2020: 2.23 Bcf/d total Mar 2020: 2.25 Bcf/d total Apr 2020: 1.96 Bcf/d total May 2020: 1.53 Bcf/d total Jun 2020: 1.6 Bcf/d total Jul 2020: 1.84 Bcf/d total Aug 2020: 1.93 Bcf/d total Sep 2020: 1.91 Bcf/d total Oct 2020: 2.05 Bcf/d total Nov 2020: 2.06 Bcf/d total Dec 2020: 1.96 Bcf/d total Jan 2021: 2.05 Bcf/d total Feb 2021: 1.84 Bcf/d total Mar 2021: 2.06 Bcf/d total Apr 2021: 2.16 Bcf/d total May 2021: 2.17 Bcf/d total Jun 2021: 2.17 Bcf/d total Jul 2021: 2.21 Bcf/d total Aug 2021: 2.22 Bcf/d total Sep 2021: 2.23 Bcf/d total Oct 2021: 2.36 Bcf/d total Nov 2021: 2.4 Bcf/d total Dec 2021: 2.39 Bcf/d total Jan 2022: 2.31 Bcf/d total Feb 2022: 2.32 Bcf/d total Mar 2022: 2.46 Bcf/d total Apr 2022: 2.5 Bcf/d total May 2022: 2.44 Bcf/d total Jun 2022: 2.47 Bcf/d total Jul 2022: 2.51 Bcf/d total Aug 2022: 2.51 Bcf/d total Sep 2022: 2.53 Bcf/d total Oct 2022: 2.52 Bcf/d total Nov 2022: 2.49 Bcf/d total Dec 2022: 2.67 Bcf/d total Jan 2023: 2.74 Bcf/d total Feb 2023: 2.79 Bcf/d total Mar 2023: 2.91 Bcf/d total Apr 2023: 2.88 Bcf/d total May 2023: 2.87 Bcf/d total Jun 2023: 2.74 Bcf/d total Jul 2023: 2.89 Bcf/d total Aug 2023: 3.04 Bcf/d total Sep 2023: 3.04 Bcf/d total Oct 2023: 3.13 Bcf/d total Nov 2023: 3.14 Bcf/d total Dec 2023: 3.14 Bcf/d total Jan 2024: 3.11 Bcf/d total Feb 2024: 3.3 Bcf/d total Mar 2024: 3.05 Bcf/d total Apr 2024: 3.1 Bcf/d total May 2024: 3.32 Bcf/d total Jun 2024: 3.02 Bcf/d total Jul 2024: 3.3 Bcf/d total Aug 2024: 3.34 Bcf/d total Sep 2024: 3.21 Bcf/d total Oct 2024: 3.33 Bcf/d total Nov 2024: 3.31 Bcf/d total Dec 2024: 3.45 Bcf/d total Jan 2025: 3.31 Bcf/d total Feb 2025: 3.44 Bcf/d total Mar 2025: 3.49 Bcf/d total Apr 2025: 3.55 Bcf/d total May 2025: 3.73 Bcf/d total Jun 2025: 3.67 Bcf/d total Jul 2025: 3.82 Bcf/d total Aug 2025: 4.94 Bcf/d total Sep 2025: 4.96 Bcf/d total Oct 2025: 4.93 Bcf/d total Nov 2025: 5.25 Bcf/d total Dec 2025: 5.02 Bcf/d total Jan 2026: 5.01 Bcf/d total Feb 2026: 5.13 Bcf/d total Mar 2026: 4.8 Bcf/d as filed so far. Filings for this month are still arriving. The chart shows what has been filed. Apr 2026: 4.96 Bcf/d as filed so far. Filings for this month are still arriving. The chart shows what has been filed. May 2026: 4.99 Bcf/d as filed so far. Filings for this month are still arriving. The chart shows what has been filed. Jun 2026: 5.09 Bcf/d as filed so far. Filings for this month are still arriving. The chart shows what has been filed. Jul 2026: 3.93 Bcf/d as filed so far. Filings for this month are still arriving. The chart shows what has been filed. Aug 2026: 3.95 Bcf/d as filed so far. Filings for this month are still arriving. The chart shows what has been filed. Sep 2026: 3.91 Bcf/d as filed so far. Filings for this month are still arriving. The chart shows what has been filed.

Still arriving: Oct 2026 <1% filed.

All from what the source published. 99.93% held at well grain.

How the volume breaks down
  • 87.1% Reported by the official source by well
  • 0.07% Reported by the official source as a lease, facility, field or state total. Published without per-well detail.
  • 8.6% Reported by the official source as a lease total, split across the lease's wells. The regional total shown is the reported number, to rounding.
  • 2.0% Reported by the official source for a longer period, spread across its months. The period total is the reported number.
  • 2.4% A series adjusted to match official published figures: a well's cumulative, a later correction netted into the months before it, a field's oil volume from the royalty file for a month missing from the production report, or a state's yearly total from a second official source.

Every cubic foot here starts from what the official source published for the months measured. Measured over January 1940 to February 2026.

The gray “without per-well detail” band is volume the source reports above the well: fields, facilities, or leases the source publishes as one total. It is included so the stack still sums to the whole entity.

EOG Resources natural gas production (Bcf/d, grouped by when each well first produced)
As reported. Reported data only.
EOG Resources natural gas production: billion cubic feet per day, by first-production vintage as filed so far today 246 Bcf/d 2017201820192020202120222023202420252026 Mar 2016: 2.04 Bcf/d total Apr 2016: 2.11 Bcf/d total May 2016: 2.05 Bcf/d total Jun 2016: 2.11 Bcf/d total Jul 2016: 2.1 Bcf/d total Aug 2016: 2.09 Bcf/d total Sep 2016: 2.05 Bcf/d total Oct 2016: 2.06 Bcf/d total Nov 2016: 2 Bcf/d total Dec 2016: 1.91 Bcf/d total Jan 2017: 1.92 Bcf/d total Feb 2017: 1.99 Bcf/d total Mar 2017: 1.92 Bcf/d total Apr 2017: 2 Bcf/d total May 2017: 2.07 Bcf/d total Jun 2017: 2.1 Bcf/d total Jul 2017: 2.17 Bcf/d total Aug 2017: 2.15 Bcf/d total Sep 2017: 2.17 Bcf/d total Oct 2017: 2.31 Bcf/d total Nov 2017: 2.35 Bcf/d total Dec 2017: 2.28 Bcf/d total Jan 2018: 2.23 Bcf/d total Feb 2018: 2.26 Bcf/d total Mar 2018: 2.23 Bcf/d total Apr 2018: 2.32 Bcf/d total May 2018: 2.31 Bcf/d total Jun 2018: 2.32 Bcf/d total Jul 2018: 2.33 Bcf/d total Aug 2018: 2.43 Bcf/d total Sep 2018: 2.53 Bcf/d total Oct 2018: 2.56 Bcf/d total Nov 2018: 2.63 Bcf/d total Dec 2018: 2.64 Bcf/d total Jan 2019: 2.59 Bcf/d total Feb 2019: 2.71 Bcf/d total Mar 2019: 2.57 Bcf/d total Apr 2019: 2.69 Bcf/d total May 2019: 2.69 Bcf/d total Jun 2019: 2.64 Bcf/d total Jul 2019: 2.71 Bcf/d total Aug 2019: 2.79 Bcf/d total Sep 2019: 2.85 Bcf/d total Oct 2019: 2.94 Bcf/d total Nov 2019: 3.03 Bcf/d total Dec 2019: 2.92 Bcf/d total Jan 2020: 2.94 Bcf/d total Feb 2020: 3.03 Bcf/d total Mar 2020: 2.93 Bcf/d total Apr 2020: 2.77 Bcf/d total May 2020: 2.37 Bcf/d total Jun 2020: 2.44 Bcf/d total Jul 2020: 2.71 Bcf/d total Aug 2020: 2.89 Bcf/d total Sep 2020: 2.84 Bcf/d total Oct 2020: 2.96 Bcf/d total Nov 2020: 2.98 Bcf/d total Dec 2020: 2.85 Bcf/d total Jan 2021: 2.95 Bcf/d total Feb 2021: 2.82 Bcf/d total Mar 2021: 2.92 Bcf/d total Apr 2021: 3.12 Bcf/d total May 2021: 3.09 Bcf/d total Jun 2021: 3.04 Bcf/d total Jul 2021: 3.14 Bcf/d total Aug 2021: 3.18 Bcf/d total Sep 2021: 3.14 Bcf/d total Oct 2021: 3.29 Bcf/d total Nov 2021: 3.36 Bcf/d total Dec 2021: 3.25 Bcf/d total Jan 2022: 3.18 Bcf/d total Feb 2022: 3.27 Bcf/d total Mar 2022: 3.27 Bcf/d total Apr 2022: 3.53 Bcf/d total May 2022: 3.48 Bcf/d total Jun 2022: 3.45 Bcf/d total Jul 2022: 3.46 Bcf/d total Aug 2022: 3.49 Bcf/d total Sep 2022: 3.48 Bcf/d total Oct 2022: 3.53 Bcf/d total Nov 2022: 3.65 Bcf/d total Dec 2022: 3.75 Bcf/d total Jan 2023: 3.85 Bcf/d total Feb 2023: 4.09 Bcf/d total Mar 2023: 4.01 Bcf/d total Apr 2023: 4.04 Bcf/d total May 2023: 4.01 Bcf/d total Jun 2023: 3.83 Bcf/d total Jul 2023: 3.95 Bcf/d total Aug 2023: 4.04 Bcf/d total Sep 2023: 4.03 Bcf/d total Oct 2023: 4.12 Bcf/d total Nov 2023: 4.17 Bcf/d total Dec 2023: 4.1 Bcf/d total Jan 2024: 4.06 Bcf/d total Feb 2024: 4.28 Bcf/d total Mar 2024: 3.93 Bcf/d total Apr 2024: 4.04 Bcf/d total May 2024: 4.21 Bcf/d total Jun 2024: 3.92 Bcf/d total Jul 2024: 4.2 Bcf/d total Aug 2024: 4.27 Bcf/d total Sep 2024: 4.12 Bcf/d total Oct 2024: 4.21 Bcf/d total Nov 2024: 4.22 Bcf/d total Dec 2024: 4.46 Bcf/d total Jan 2025: 4.3 Bcf/d total Feb 2025: 4.48 Bcf/d total Mar 2025: 4.44 Bcf/d total Apr 2025: 4.58 Bcf/d total May 2025: 4.72 Bcf/d total Jun 2025: 4.67 Bcf/d total Jul 2025: 4.85 Bcf/d total Aug 2025: 4.93 Bcf/d total Sep 2025: 4.95 Bcf/d total Oct 2025: 4.93 Bcf/d total Nov 2025: 5.25 Bcf/d total Dec 2025: 5.03 Bcf/d total Jan 2026: 5.01 Bcf/d total Feb 2026: 5.13 Bcf/d total Mar 2026: 4.8 Bcf/d as filed so far. Filings for this month are still arriving. The chart shows what has been filed. Apr 2026: 4.96 Bcf/d as filed so far. Filings for this month are still arriving. The chart shows what has been filed. May 2026: 5 Bcf/d as filed so far. Filings for this month are still arriving. The chart shows what has been filed. Jun 2026: 5.09 Bcf/d as filed so far. Filings for this month are still arriving. The chart shows what has been filed. Jul 2026: 3.93 Bcf/d as filed so far. Filings for this month are still arriving. The chart shows what has been filed. Aug 2026: 3.95 Bcf/d as filed so far. Filings for this month are still arriving. The chart shows what has been filed. Sep 2026: 3.91 Bcf/d as filed so far. Filings for this month are still arriving. The chart shows what has been filed.

Still arriving: Oct 2026 <1% filed.

The gray “without per-well detail” band is volume the source reports above the well: fields, facilities, or leases the source publishes as one total. It is included so the stack still sums to the whole entity.

The bands group wells by when they first produced.

About this chart

The stack shows what is holding today's rate up and how much of it is new drilling. The bands draw the filings already in.

These volumes are the production from the wells and facilities this company operates. Ownership works differently: other parties hold interests in these wells, and this company holds interests in wells that other companies operate. How we attribute production to a company

In Texas, production is reported for an oil lease or unit as well as for individual gas wells. Those lease and unit totals are divided among the wells they cover, and every Texas barrel is labeled reported or allocated. How well-level Texas production is built

Annual table (full history)

best estimate incl. unsplit totals, allocated and adjusted

YearOil (MMbbl)Gas produced (Bcf)
2025254.31,526
2024244.21,185
2023235.71,075
2022224.6905
2021217.4800
2020204.3716
2019230.1751
2018198.6633
2017165.5524
2016144.3584
2015150.5652
2014149.7696
2013111.0676
201278.7750
201153.9779
201035.5748
200928.4726
200823.5707
200714.8594
200613.6534
200513.6495
200413.8451
200312.1425
200211.6406
200113.7427
200014.6403
199910.5369
199810.4397
199712.1404
199612.6376
199511.7324
19949.0357
199310.4382
19926.0181
19914.5156
19906.794
19896.464
19883.480
19873.159
19862.740
19853.449
19845.652
19833.736
19822.329
19812.424
19802.421
19792.219
19782.317
19771.814
19761.89
19751.47
19741.44
19731.02
19721.01
19711.11
19701.01
19691.01
19681.01
19671.01
19660.9<1
19650.8<1
19640.7<1
19630.7<1
19620.8<1
19610.7<1
19600.7<1
19590.2<1
19580.2<1
19570.2<1
19560.2<1
19550.2<1
19540.2<1
19530.2<1
19520.2<1
19510.2<1
19500.2<1
19490.2<1
19480.2<1
19470.2<1
19460.2<1
19450.2<1
19440.1<1
19430.1<1
19420.1<1
19410.1<1
19400.1<1

Source: CommoVision (commovision.com)

Monthly table (last 24 months)
MonthOil (Mbbl)Gas produced (MMcf)
2025-1222,081.4155,746
2025-1121,800.1157,330
2025-1021,919.9152,851
2025-0921,684.8148,868
2025-0823,391.8153,098
2025-0720,605.8118,357
2025-0620,167.5109,959
2025-0521,007.4115,746
2025-0420,353.6106,582
2025-0321,103.1108,026
2025-0219,291.496,296
2025-0120,854.1102,757
2024-1220,496.7107,045
2024-1119,854.099,335
2024-1021,021.7103,074
2024-0919,721.196,260
2024-0821,451.4103,631
2024-0720,401.5102,247
2024-0620,091.090,504
2024-0520,437.8102,929
2024-0420,021.293,065
2024-0320,563.194,654
2024-0219,693.795,776
2024-0120,424.696,402

Source: CommoVision (commovision.com)

Source: CommoVision · EOG Resources, data through February 2026.

Well map

A map of 26,735 well locations operated by EOG Resources for which CommoVision holds a published surface coordinate, each drawn where it is and colored by its primary product (green for oil, red for natural gas, gray where undetermined; a spot shared by more than one product shows the one with the most wells there), on a ground of land and water over faint country, state and province outlines and place names for orientation, with a small inset map locating this frame in the United States.
  • Oil 15,796
  • Natural gas 10,036
  • Undetermined 903
26,735 well locations operated by EOG Resources, colored by primary product.
About this map

Undetermined means not enough signal to settle it. Producing wells are the ones that reported oil or gas in the trailing 12 months per region.

751.1 Mbbl/d Feb 2026 oil production +9% vs Feb last year best estimate incl. unsplit totals and allocated
5.13 Bcf/d Feb 2026 gas production +49.3% vs Feb last year best estimate incl. unsplit totals and allocated
696.6 Mbbl/d 2025 oil production best estimate incl. unsplit totals and allocated
4.18 Bcf/d 2025 gas production best estimate incl. unsplit totals and allocated
12,317 wells Operated producing wells tracked trailing 12 months per region

Type curves

EOG Resources oil type curves (bbl/d per well, log scale, against months on production; cohorts 2010–2026)
EOG Resources oil type curves: average barrels per day per well on a log scale against months on production 2010-2014: 3,871 wells in curve; starts at 229 bbl/d per well, 168 Mbbl cumulative through month 136 (100% of its wells old enough at that month); the dashed curve runs through month 196, on our forecast where a well’s own record ends2015: 759 wells in curve; starts at 342 bbl/d per well, 223 Mbbl cumulative through month 121 (100% of its wells old enough at that month); the dashed curve runs through month 181, on our forecast where a well’s own record ends2016: 484 wells in curve; starts at 513 bbl/d per well, 279 Mbbl cumulative through month 111 (100% of its wells old enough at that month); the dashed curve runs through month 171, on our forecast where a well’s own record ends2017: 659 wells in curve; starts at 586 bbl/d per well, 293 Mbbl cumulative through month 98 (100% of its wells old enough at that month); the dashed curve runs through month 158, on our forecast where a well’s own record ends2018: 866 wells in curve; starts at 576 bbl/d per well, 286 Mbbl cumulative through month 89 (100% of its wells old enough at that month); the dashed curve runs through month 149, on our forecast where a well’s own record ends2019: 870 wells in curve; starts at 674 bbl/d per well, 302 Mbbl cumulative through month 79 (100% of its wells old enough at that month); the dashed curve runs through month 139, on our forecast where a well’s own record ends2020: 602 wells in curve; starts at 728 bbl/d per well, 292 Mbbl cumulative through month 67 (100% of its wells old enough at that month); the dashed curve runs through month 127, on our forecast where a well’s own record ends2021: 603 wells in curve; starts at 711 bbl/d per well, 303 Mbbl cumulative through month 55 (100% of its wells old enough at that month); the dashed curve runs through month 115, on our forecast where a well’s own record ends2022: 703 wells in curve; starts at 699 bbl/d per well, 268 Mbbl cumulative through month 42 (100% of its wells old enough at that month); the dashed curve runs through month 102, on our forecast where a well’s own record ends2023: 808 wells in curve; starts at 642 bbl/d per well, 221 Mbbl cumulative through month 31 (100% of its wells old enough at that month); the dashed curve runs through month 91, on our forecast where a well’s own record ends2024: 763 wells in curve; starts at 679 bbl/d per well, 190 Mbbl cumulative through month 19 (100% of its wells old enough at that month); the dashed curve runs through month 79, on our forecast where a well’s own record ends2025: 755 wells in curve; starts at 602 bbl/d per well, 125 Mbbl cumulative through month 7 (100% of its wells old enough at that month); the dashed curve runs through month 67, on our forecast where a well’s own record ends2026: 478 wells in curve; starts at 654 bbl/d per well, 19.9 Mbbl cumulative through month 1 (100% of its wells old enough at that month); the dashed curve runs through month 61, on our forecast where a well’s own record ends51020501002005001,0001,500bbl/d24487296120144168192216Months on production

5 of the drawn cohorts’ wells are not in these curves yet: each is still producing and joins its curve once it carries a forecast.

EOG Resources natural gas type curves (Mcf/d per well, log scale, against months on production; cohorts 2010–2026)
EOG Resources natural gas type curves: average thousand cubic feet per day per well on a log scale against months on production 2010-2014: 3,871 wells in curve; starts at 392 Mcf/d per well, 0.8 Bcf cumulative through month 136 (100% of its wells old enough at that month); the dashed curve runs through month 196, on our forecast where a well’s own record ends2015: 759 wells in curve; starts at 759 Mcf/d per well, 1.1 Bcf cumulative through month 121 (100% of its wells old enough at that month); the dashed curve runs through month 181, on our forecast where a well’s own record ends2016: 484 wells in curve; starts at 1,013 Mcf/d per well, 1.1 Bcf cumulative through month 111 (100% of its wells old enough at that month); the dashed curve runs through month 171, on our forecast where a well’s own record ends2017: 659 wells in curve; starts at 1,318 Mcf/d per well, 1.2 Bcf cumulative through month 98 (100% of its wells old enough at that month); the dashed curve runs through month 158, on our forecast where a well’s own record ends2018: 866 wells in curve; starts at 1,191 Mcf/d per well, 1.1 Bcf cumulative through month 89 (100% of its wells old enough at that month); the dashed curve runs through month 149, on our forecast where a well’s own record ends2019: 870 wells in curve; starts at 1,647 Mcf/d per well, 1.3 Bcf cumulative through month 79 (100% of its wells old enough at that month); the dashed curve runs through month 139, on our forecast where a well’s own record ends2020: 602 wells in curve; starts at 2,053 Mcf/d per well, 1.5 Bcf cumulative through month 67 (100% of its wells old enough at that month); the dashed curve runs through month 127, on our forecast where a well’s own record ends2021: 603 wells in curve; starts at 2,182 Mcf/d per well, 1.7 Bcf cumulative through month 55 (100% of its wells old enough at that month); the dashed curve runs through month 115, on our forecast where a well’s own record ends2022: 703 wells in curve; starts at 2,079 Mcf/d per well, 1.7 Bcf cumulative through month 42 (100% of its wells old enough at that month); the dashed curve runs through month 102, on our forecast where a well’s own record ends2023: 808 wells in curve; starts at 1,945 Mcf/d per well, 1.2 Bcf cumulative through month 31 (100% of its wells old enough at that month); the dashed curve runs through month 91, on our forecast where a well’s own record ends2024: 763 wells in curve; starts at 2,037 Mcf/d per well, 1.1 Bcf cumulative through month 19 (100% of its wells old enough at that month); the dashed curve runs through month 79, on our forecast where a well’s own record ends2025: 755 wells in curve; starts at 1,902 Mcf/d per well, 0.7 Bcf cumulative through month 7 (100% of its wells old enough at that month); the dashed curve runs through month 67, on our forecast where a well’s own record ends2026: 478 wells in curve; starts at 1,741 Mcf/d per well, 0.1 Bcf cumulative through month 1 (100% of its wells old enough at that month); the dashed curve runs through month 61, on our forecast where a well’s own record ends40501002005001,0002,0005,000Mcf/d24487296120144168192216Months on production

5 of the drawn cohorts’ wells are not in these curves yet: each is still producing and joins its curve once it carries a forecast.

best estimate incl. allocated and adjusted

Horizontal wells only. Average production per well, for wells grouped by when they first produced.

How these curves are built

Horizontal wells only: 12,226 of the 12,750 wells in these cohorts. Average daily production per well, for wells grouped by when they first produced. Includes every well of the cohort that is old enough at each month, except wells that are still active but not yet covered by our forecasts; those are left out of both the reported and forecast parts until they are. Wells that are shut in or have stopped producing count as zero, so the average reflects the whole group drawn, not just survivors. Rates are calendar-day (volume ÷ days in month). The cumulative axis accumulates those same monthly averages at the average month length. Months not yet fully reported are excluded. The 2010-2014 curve draws those years as one group. The chart opens on average daily rate against months on production, the rate on a log scale. The view control switches to rate against cumulative production per well, on the same log rate scale, or to cumulative production per well against months on production, on a linear scale. Every view draws the same cohorts from the same production history. Each cohort is solid through the last month all the wells in its curve sit inside fully reported data. Past it the dashed curve carries the same wells forward, on our forecast where a well’s own record ends, for up to five years. A dashed curve runs as far as at least nine in ten of its wells are accounted for. A well that is old enough but shut in still counts, as zero. The measured months are what these wells reported. In the forward months each well counts its own reported figure for each month it has one, our forecast for each month it has only that, and zero for the rest. The forward average counts every well in the curve. The drawn forecast runs up to five years past the measured months. Line thickness tracks how many wells each curve is drawn from. 6 wells are counted here but not shown on the age axis: they started producing in 1995 or earlier, too close to the start of our records for their region to verify their true age.

Cohort summary table
First produced Wells in curve Peak oil (bbl/d per well) Month-12 oil (bbl/d per well) Cum oil in series (Mbbl per well) Peak gas (Mcf/d per well) Month-12 gas (Mcf/d per well) Cum gas in series (Bcf per well) Months in series Wells old enough at last month in series Forecast months drawn
2026 478 654 — 19.9 1,741 — 0.1 1 100% 60
2025 755 1,003 — 125 4,091 — 0.7 7 100% 60
2024 763 1,007 195 190 3,609 1,442 1.1 19 100% 60
2023 808 973 185 221 3,576 1,171 1.2 31 100% 60
2022 703 1,051 207 268 4,279 1,390 1.7 42 100% 60
2021 603 1,078 223 303 4,128 1,254 1.7 55 100% 60
2020 602 844 214 292 3,176 1,009 1.5 67 100% 60
2019 870 957 198 302 2,629 830 1.3 79 100% 60
2018 866 863 180 286 1,989 749 1.1 89 100% 60
2017 659 862 189 293 2,303 823 1.2 98 100% 60
2016 484 775 174 279 1,721 665 1.1 111 100% 60
2015 759 520 140 223 1,353 705 1.1 121 100% 60
2010-2014 3,871 393 106 168 789 461 0.8 136 100% 60

Source: CommoVision (commovision.com)

Source: CommoVision · EOG Resources type curves, per-well production by first-production cohort.

Recent permitting

880 permits approved in the 365 days to November 12, 2026
216 permits in the 90 days to November 12, 2026
197 new-well permits in the 90 days to November 12, 2026
November 12, 2026 latest approval on record
About this chart

Approvals of every permit type per month, the 24 months to Nov 2026. The last bar is Nov 2026 through November 12, 2026 (33 so far), drawn hatched. Of the 880 approved in the 365 days to November 12, 2026, 837 are permits to drill a new well, 32 are other permit types, 8 are permits to deepen, sidetrack or re-enter existing wells, 2 are recompletion permits and 1 is a permit to plug a well. Permits to drill a new well: 837 in the 365 days to November 12, 2026 and 197 in the last 90 days of that window. How permits are counted.

  • EOG Resources was granted 880 well permits in the 365 days to November 12, 2026. Of those, 216 came in the last 90 days of that window. The latest approval on record is dated November 12, 2026.
  • Of the 880 approved in the 365 days to November 12, 2026, 837 are permits to drill a new well, 32 are other permit types, 8 are permits to deepen, sidetrack or re-enter existing wells, 2 are recompletion permits and 1 is a permit to plug a well. Permits to drill a new well: 837 in the 365 days to November 12, 2026 and 197 in the last 90 days of that window.
  • Permits counted here come from North Dakota, New Mexico, Ohio, Texas and Wyoming.
  • Gulf of Mexico, Manitoba and Mississippi reach this page through production data alone.
Well permits approved per month: full table
MonthPermits approved
Nov 2026 (through November 12, 2026)33
Oct 202672
Sep 202657
Aug 2026151
Jul 202680
Jun 2026157
May 202682
Apr 202655
Mar 202640
Feb 202661
Jan 202616
Dec 202553
Nov 202561
Oct 202586
Sep 2025106
Aug 202544
Jul 2025114
Jun 202544
May 202585
Apr 202559
Mar 202564
Feb 202563
Jan 202574
Dec 2024121

Source: CommoVision (commovision.com)

What we cover here

Each row names the grain a region’s production is held at. Where a source publishes at a coarser grain, the page says so.

DataGrainSinceBenchmark
Alberta production project + well 1962-01 ~100% of StatCan (oil)
Arkansas production well 1920-04 ~62–101% of EIA
British Columbia production well 1954-06 —
California production well 1944-03 ~98–101% of EIA
Colorado production well 1999-01 ~100% of EIA
Gulf of Mexico production well 1947-11 ~100% of EIA
Kansas production well 1987-01 ~99% of EIA
Louisiana production well 1977-01 ~97–98% of EIA
Manitoba production well 1951-02 ~100% of StatCan (oil)
Mississippi production well 1946-07 ~100–102% of EIA
Montana production well 1986-01 ~96–100% of EIA
North Dakota production well 1951-04 ~99–100% of EIA
New Mexico production well 1924-01 ~98–100% of EIA
Ohio production well 1955-08 ~99% of EIA
Oklahoma production lease + well 1990-07 ~99–100% of EIA
Pennsylvania production well 1980-01 ~100% of EIA
Texas production well 1993-01 ~100% of EIA
Utah production well 1984-01 ~100% of EIA
West Virginia production well 1985-01 ~99–100% of EIA
Wyoming production well 1978-01 ~100–101% of EIA

Where a row carries a Benchmark figure, the cell names the published estimate it compares against: the EIA’s for United States rows, Statistics Canada’s for Canadian rows.

About the benchmark comparisons

Where a row carries a Benchmark figure, it names the agency it compares against: the EIA for United States rows, Statistics Canada for Canadian rows. The compared series are produced differently from ours, so recent months can differ in either direction.

Coverage rows for EOG Resources are regenerated at every build from the same catalog of sources the data is built from.

Top regions by 2025 operated production best estimate incl. unsplit totals and allocated

RegionOil (MMbbl)Gas produced (Bcf)Share of 2025 output
New Mexico127.8619.647.5%
Texas87.1592.335.6%
Ohio16.3204.28.4%
Wyoming1381.35.2%
North Dakota919.92.9%
Oklahoma1.28.30.5%
Kansas000.0%
Alberta——0.0%

Share of output counts oil and gas together, gas at its market-value weight.

— means no figure is published for that period.

What the data shows

  • EOG Resources produced 254.3 MMbbl of oil and 1.53 Tcf of natural gas in 2025.
  • EOG Resources oil production reached its highest level on record in 2025 at 254.3 MMbbl.
  • EOG Resources operated production across 20 reporting regions in 2 countries (Canada, United States) in our coverage.
  • 12,317 operated producing wells tracked, trailing 12 months per region.

Corporate history

Start a free trial

Watch supply move as soon as its sources publish, with forecasts on 1.1+ million producing wells. A real API and MCP access for AI tools are live, and the Portal is open.

What the trial includes

Data use is subject to our Terms of Service.