CommoVision

See the future in real time

Matador Resources Company

Matador Resources Company produced 58.1 MMbbl of oil and 250.6 Bcf of natural gas in 2025. 1,454 operated producing wells tracked, trailing 12 months per region.

  • Fifth-largest operator by operated oil in New Mexico, 2025.
  • Operated 6.8% of the oil produced in New Mexico, 2025.
  • Oil production rose 23% in 2025 as wells changed hands.
Operator

Under Current operator an old month can show a later company.
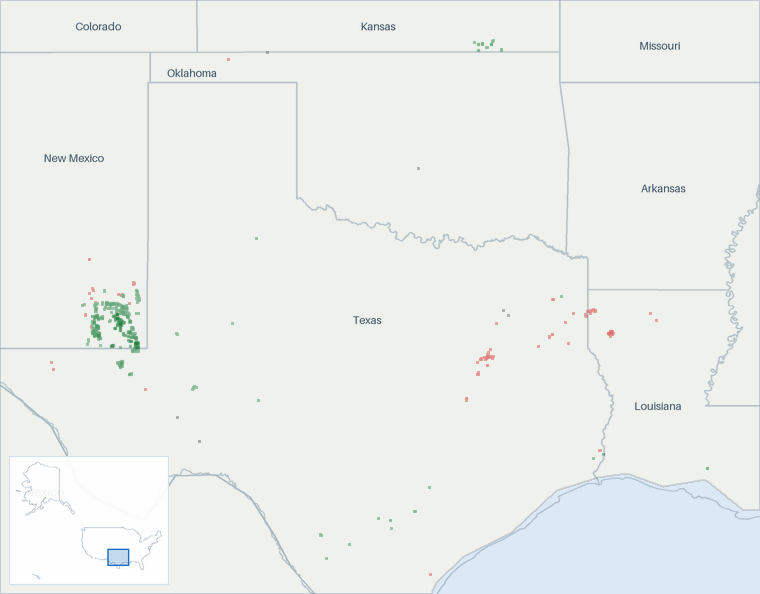
Well map of Matador Resources Company. The full map is further down this page.

Production

Matador Resources Company oil production (Mbbl/d, grouped by when each well first produced)
As reported. Reported data only.
Matador Resources Company oil production: thousand barrels per day, by first-production vintage as filed so far today 50100150200 Mbbl/d 2017201820192020202120222023202420252026 Aug 2016: 20.7 Mbbl/d total Sep 2016: 22.2 Mbbl/d total Oct 2016: 21 Mbbl/d total Nov 2016: 21.3 Mbbl/d total Dec 2016: 24.3 Mbbl/d total Jan 2017: 25.2 Mbbl/d total Feb 2017: 27 Mbbl/d total Mar 2017: 26.3 Mbbl/d total Apr 2017: 25.2 Mbbl/d total May 2017: 27.4 Mbbl/d total Jun 2017: 27.5 Mbbl/d total Jul 2017: 30.9 Mbbl/d total Aug 2017: 31.3 Mbbl/d total Sep 2017: 32.7 Mbbl/d total Oct 2017: 34.2 Mbbl/d total Nov 2017: 32.1 Mbbl/d total Dec 2017: 32.7 Mbbl/d total Jan 2018: 30.7 Mbbl/d total Feb 2018: 34.1 Mbbl/d total Mar 2018: 36.7 Mbbl/d total Apr 2018: 37.7 Mbbl/d total May 2018: 41.4 Mbbl/d total Jun 2018: 41.7 Mbbl/d total Jul 2018: 43.6 Mbbl/d total Aug 2018: 44.2 Mbbl/d total Sep 2018: 44.8 Mbbl/d total Oct 2018: 45.2 Mbbl/d total Nov 2018: 44.4 Mbbl/d total Dec 2018: 46.5 Mbbl/d total Jan 2019: 41.7 Mbbl/d total Feb 2019: 39.6 Mbbl/d total Mar 2019: 42.9 Mbbl/d total Apr 2019: 49.2 Mbbl/d total May 2019: 50.1 Mbbl/d total Jun 2019: 49.3 Mbbl/d total Jul 2019: 49.8 Mbbl/d total Aug 2019: 50.9 Mbbl/d total Sep 2019: 58.5 Mbbl/d total Oct 2019: 53.2 Mbbl/d total Nov 2019: 58.7 Mbbl/d total Dec 2019: 54.7 Mbbl/d total Jan 2020: 55.3 Mbbl/d total Feb 2020: 51.6 Mbbl/d total Mar 2020: 51.6 Mbbl/d total Apr 2020: 57.5 Mbbl/d total May 2020: 51.6 Mbbl/d total Jun 2020: 52.7 Mbbl/d total Jul 2020: 52.7 Mbbl/d total Aug 2020: 50.1 Mbbl/d total Sep 2020: 47.8 Mbbl/d total Oct 2020: 48.6 Mbbl/d total Nov 2020: 48.7 Mbbl/d total Dec 2020: 45.1 Mbbl/d total Jan 2021: 42.1 Mbbl/d total Feb 2021: 37.9 Mbbl/d total Mar 2021: 46.1 Mbbl/d total Apr 2021: 54.4 Mbbl/d total May 2021: 54.3 Mbbl/d total Jun 2021: 55.3 Mbbl/d total Jul 2021: 52.6 Mbbl/d total Aug 2021: 53.6 Mbbl/d total Sep 2021: 48.7 Mbbl/d total Oct 2021: 64.2 Mbbl/d total Nov 2021: 59.5 Mbbl/d total Dec 2021: 54.2 Mbbl/d total Jan 2022: 55.2 Mbbl/d total Feb 2022: 63.3 Mbbl/d total Mar 2022: 71.5 Mbbl/d total Apr 2022: 81.3 Mbbl/d total May 2022: 81.6 Mbbl/d total Jun 2022: 75 Mbbl/d total Jul 2022: 75.1 Mbbl/d total Aug 2022: 72.8 Mbbl/d total Sep 2022: 77.4 Mbbl/d total Oct 2022: 78.3 Mbbl/d total Nov 2022: 79.9 Mbbl/d total Dec 2022: 81.9 Mbbl/d total Jan 2023: 75.3 Mbbl/d total Feb 2023: 75.6 Mbbl/d total Mar 2023: 79.8 Mbbl/d total Apr 2023: 90 Mbbl/d total May 2023: 86.6 Mbbl/d total Jun 2023: 82.7 Mbbl/d total Jul 2023: 90.5 Mbbl/d total Aug 2023: 100 Mbbl/d total Sep 2023: 105 Mbbl/d total Oct 2023: 107 Mbbl/d total Nov 2023: 115 Mbbl/d total Dec 2023: 117 Mbbl/d total Jan 2024: 105 Mbbl/d total Feb 2024: 105 Mbbl/d total Mar 2024: 118 Mbbl/d total Apr 2024: 113 Mbbl/d total May 2024: 124 Mbbl/d total Jun 2024: 129 Mbbl/d total Jul 2024: 123 Mbbl/d total Aug 2024: 127 Mbbl/d total Sep 2024: 134 Mbbl/d total Oct 2024: 155 Mbbl/d total Nov 2024: 157 Mbbl/d total Dec 2024: 155 Mbbl/d total Jan 2025: 148 Mbbl/d total Feb 2025: 141 Mbbl/d total Mar 2025: 153 Mbbl/d total Apr 2025: 162 Mbbl/d total May 2025: 167 Mbbl/d total Jun 2025: 159 Mbbl/d total Jul 2025: 163 Mbbl/d total Aug 2025: 156 Mbbl/d total Sep 2025: 165 Mbbl/d total Oct 2025: 163 Mbbl/d total Nov 2025: 167 Mbbl/d total Dec 2025: 163 Mbbl/d total Jan 2026: 151 Mbbl/d total Feb 2026: 156 Mbbl/d total Mar 2026: 173 Mbbl/d total Apr 2026: 168 Mbbl/d total May 2026: 164 Mbbl/d total Jun 2026: 165 Mbbl/d total Jul 2026: 165 Mbbl/d total Aug 2026: 165 Mbbl/d as filed so far. Filings for this month are still arriving. The chart shows what has been filed. Sep 2026: 9.3 Mbbl/d as filed so far. Filings for this month are still arriving. The chart shows what has been filed.

Still arriving: Oct 2026 <1% filed.

All from what the source published. All held at well grain.

How the volume breaks down
  • 89.6% Reported by the official source by well
  • 10.3% Reported by the official source as a lease total, split across the lease's wells. The regional total shown is the reported number, to rounding.
  • under 0.01% Reported by the official source for a longer period, spread across its months. The period total is the reported number.
  • 0.09% A series adjusted to match official published figures: a well's cumulative, a later correction netted into the months before it, a field's oil volume from the royalty file for a month missing from the production report, or a state's yearly total from a second official source.

Every barrel here starts from what the official source published for the months measured. Measured over January 1974 to July 2026.

Matador Resources Company oil production (Mbbl/d, grouped by when each well first produced)
As reported. Reported data only.
Matador Resources Company oil production: thousand barrels per day, by first-production vintage as filed so far today 50100150200 Mbbl/d 2017201820192020202120222023202420252026 Aug 2016: 20.8 Mbbl/d total Sep 2016: 22.3 Mbbl/d total Oct 2016: 21.2 Mbbl/d total Nov 2016: 22.1 Mbbl/d total Dec 2016: 25 Mbbl/d total Jan 2017: 26.2 Mbbl/d total Feb 2017: 28.8 Mbbl/d total Mar 2017: 28.8 Mbbl/d total Apr 2017: 27.8 Mbbl/d total May 2017: 30.2 Mbbl/d total Jun 2017: 29.3 Mbbl/d total Jul 2017: 29.8 Mbbl/d total Aug 2017: 30.9 Mbbl/d total Sep 2017: 33.2 Mbbl/d total Oct 2017: 34.4 Mbbl/d total Nov 2017: 34.8 Mbbl/d total Dec 2017: 34.7 Mbbl/d total Jan 2018: 35.2 Mbbl/d total Feb 2018: 39.2 Mbbl/d total Mar 2018: 43.2 Mbbl/d total Apr 2018: 44.7 Mbbl/d total May 2018: 49 Mbbl/d total Jun 2018: 50.2 Mbbl/d total Jul 2018: 53.9 Mbbl/d total Aug 2018: 53.2 Mbbl/d total Sep 2018: 54 Mbbl/d total Oct 2018: 55.6 Mbbl/d total Nov 2018: 58.6 Mbbl/d total Dec 2018: 63.1 Mbbl/d total Jan 2019: 58.2 Mbbl/d total Feb 2019: 55.3 Mbbl/d total Mar 2019: 60 Mbbl/d total Apr 2019: 61.5 Mbbl/d total May 2019: 63 Mbbl/d total Jun 2019: 67.1 Mbbl/d total Jul 2019: 64.9 Mbbl/d total Aug 2019: 66.8 Mbbl/d total Sep 2019: 77 Mbbl/d total Oct 2019: 73 Mbbl/d total Nov 2019: 78.4 Mbbl/d total Dec 2019: 74.1 Mbbl/d total Jan 2020: 82.7 Mbbl/d total Feb 2020: 81.8 Mbbl/d total Mar 2020: 81.5 Mbbl/d total Apr 2020: 74.1 Mbbl/d total May 2020: 58.2 Mbbl/d total Jun 2020: 82 Mbbl/d total Jul 2020: 86.5 Mbbl/d total Aug 2020: 79.9 Mbbl/d total Sep 2020: 79.3 Mbbl/d total Oct 2020: 77.6 Mbbl/d total Nov 2020: 77.9 Mbbl/d total Dec 2020: 68 Mbbl/d total Jan 2021: 71.2 Mbbl/d total Feb 2021: 62.3 Mbbl/d total Mar 2021: 79.3 Mbbl/d total Apr 2021: 90.5 Mbbl/d total May 2021: 89.7 Mbbl/d total Jun 2021: 90.9 Mbbl/d total Jul 2021: 82.2 Mbbl/d total Aug 2021: 84.3 Mbbl/d total Sep 2021: 84.9 Mbbl/d total Oct 2021: 98.8 Mbbl/d total Nov 2021: 92.6 Mbbl/d total Dec 2021: 82.4 Mbbl/d total Jan 2022: 88.7 Mbbl/d total Feb 2022: 103 Mbbl/d total Mar 2022: 109 Mbbl/d total Apr 2022: 117 Mbbl/d total May 2022: 112 Mbbl/d total Jun 2022: 103 Mbbl/d total Jul 2022: 117 Mbbl/d total Aug 2022: 122 Mbbl/d total Sep 2022: 127 Mbbl/d total Oct 2022: 128 Mbbl/d total Nov 2022: 127 Mbbl/d total Dec 2022: 132 Mbbl/d total Jan 2023: 124 Mbbl/d total Feb 2023: 121 Mbbl/d total Mar 2023: 129 Mbbl/d total Apr 2023: 136 Mbbl/d total May 2023: 129 Mbbl/d total Jun 2023: 122 Mbbl/d total Jul 2023: 119 Mbbl/d total Aug 2023: 122 Mbbl/d total Sep 2023: 126 Mbbl/d total Oct 2023: 126 Mbbl/d total Nov 2023: 132 Mbbl/d total Dec 2023: 124 Mbbl/d total Jan 2024: 112 Mbbl/d total Feb 2024: 115 Mbbl/d total Mar 2024: 129 Mbbl/d total Apr 2024: 134 Mbbl/d total May 2024: 145 Mbbl/d total Jun 2024: 148 Mbbl/d total Jul 2024: 144 Mbbl/d total Aug 2024: 152 Mbbl/d total Sep 2024: 137 Mbbl/d total Oct 2024: 156 Mbbl/d total Nov 2024: 158 Mbbl/d total Dec 2024: 156 Mbbl/d total Jan 2025: 148 Mbbl/d total Feb 2025: 142 Mbbl/d total Mar 2025: 154 Mbbl/d total Apr 2025: 163 Mbbl/d total May 2025: 168 Mbbl/d total Jun 2025: 160 Mbbl/d total Jul 2025: 164 Mbbl/d total Aug 2025: 157 Mbbl/d total Sep 2025: 166 Mbbl/d total Oct 2025: 164 Mbbl/d total Nov 2025: 171 Mbbl/d total Dec 2025: 174 Mbbl/d total Jan 2026: 163 Mbbl/d total Feb 2026: 168 Mbbl/d total Mar 2026: 186 Mbbl/d total Apr 2026: 184 Mbbl/d total May 2026: 179 Mbbl/d total Jun 2026: 177 Mbbl/d total Jul 2026: 176 Mbbl/d total Aug 2026: 174 Mbbl/d as filed so far. Filings for this month are still arriving. The chart shows what has been filed. Sep 2026: 9.33 Mbbl/d as filed so far. Filings for this month are still arriving. The chart shows what has been filed.

Still arriving: Oct 2026 <1% filed.

Matador Resources Company natural gas production (MMcf/d, grouped by when each well first produced)
As reported. Reported data only.
Matador Resources Company natural gas production: million cubic feet per day, by first-production vintage as filed so far today 200400600800 MMcf/d 2017201820192020202120222023202420252026 Aug 2016: 80.2 MMcf/d total Sep 2016: 87.1 MMcf/d total Oct 2016: 83.6 MMcf/d total Nov 2016: 91.1 MMcf/d total Dec 2016: 84.2 MMcf/d total Jan 2017: 89.2 MMcf/d total Feb 2017: 97.2 MMcf/d total Mar 2017: 100 MMcf/d total Apr 2017: 99.4 MMcf/d total May 2017: 113 MMcf/d total Jun 2017: 118 MMcf/d total Jul 2017: 122 MMcf/d total Aug 2017: 121 MMcf/d total Sep 2017: 119 MMcf/d total Oct 2017: 130 MMcf/d total Nov 2017: 122 MMcf/d total Dec 2017: 124 MMcf/d total Jan 2018: 118 MMcf/d total Feb 2018: 133 MMcf/d total Mar 2018: 148 MMcf/d total Apr 2018: 144 MMcf/d total May 2018: 165 MMcf/d total Jun 2018: 165 MMcf/d total Jul 2018: 176 MMcf/d total Aug 2018: 162 MMcf/d total Sep 2018: 167 MMcf/d total Oct 2018: 164 MMcf/d total Nov 2018: 160 MMcf/d total Dec 2018: 181 MMcf/d total Jan 2019: 171 MMcf/d total Feb 2019: 172 MMcf/d total Mar 2019: 181 MMcf/d total Apr 2019: 192 MMcf/d total May 2019: 187 MMcf/d total Jun 2019: 186 MMcf/d total Jul 2019: 185 MMcf/d total Aug 2019: 189 MMcf/d total Sep 2019: 206 MMcf/d total Oct 2019: 195 MMcf/d total Nov 2019: 199 MMcf/d total Dec 2019: 192 MMcf/d total Jan 2020: 205 MMcf/d total Feb 2020: 191 MMcf/d total Mar 2020: 199 MMcf/d total Apr 2020: 209 MMcf/d total May 2020: 194 MMcf/d total Jun 2020: 207 MMcf/d total Jul 2020: 209 MMcf/d total Aug 2020: 204 MMcf/d total Sep 2020: 197 MMcf/d total Oct 2020: 195 MMcf/d total Nov 2020: 201 MMcf/d total Dec 2020: 190 MMcf/d total Jan 2021: 182 MMcf/d total Feb 2021: 168 MMcf/d total Mar 2021: 196 MMcf/d total Apr 2021: 222 MMcf/d total May 2021: 226 MMcf/d total Jun 2021: 233 MMcf/d total Jul 2021: 224 MMcf/d total Aug 2021: 231 MMcf/d total Sep 2021: 218 MMcf/d total Oct 2021: 294 MMcf/d total Nov 2021: 270 MMcf/d total Dec 2021: 252 MMcf/d total Jan 2022: 258 MMcf/d total Feb 2022: 298 MMcf/d total Mar 2022: 312 MMcf/d total Apr 2022: 343 MMcf/d total May 2022: 336 MMcf/d total Jun 2022: 312 MMcf/d total Jul 2022: 316 MMcf/d total Aug 2022: 310 MMcf/d total Sep 2022: 333 MMcf/d total Oct 2022: 343 MMcf/d total Nov 2022: 354 MMcf/d total Dec 2022: 366 MMcf/d total Jan 2023: 347 MMcf/d total Feb 2023: 336 MMcf/d total Mar 2023: 343 MMcf/d total Apr 2023: 364 MMcf/d total May 2023: 348 MMcf/d total Jun 2023: 364 MMcf/d total Jul 2023: 395 MMcf/d total Aug 2023: 425 MMcf/d total Sep 2023: 440 MMcf/d total Oct 2023: 471 MMcf/d total Nov 2023: 476 MMcf/d total Dec 2023: 513 MMcf/d total Jan 2024: 473 MMcf/d total Feb 2024: 474 MMcf/d total Mar 2024: 510 MMcf/d total Apr 2024: 470 MMcf/d total May 2024: 483 MMcf/d total Jun 2024: 528 MMcf/d total Jul 2024: 546 MMcf/d total Aug 2024: 516 MMcf/d total Sep 2024: 555 MMcf/d total Oct 2024: 646 MMcf/d total Nov 2024: 658 MMcf/d total Dec 2024: 648 MMcf/d total Jan 2025: 641 MMcf/d total Feb 2025: 615 MMcf/d total Mar 2025: 656 MMcf/d total Apr 2025: 688 MMcf/d total May 2025: 696 MMcf/d total Jun 2025: 682 MMcf/d total Jul 2025: 705 MMcf/d total Aug 2025: 700 MMcf/d total Sep 2025: 678 MMcf/d total Oct 2025: 698 MMcf/d total Nov 2025: 732 MMcf/d total Dec 2025: 740 MMcf/d total Jan 2026: 701 MMcf/d total Feb 2026: 720 MMcf/d total Mar 2026: 738 MMcf/d total Apr 2026: 699 MMcf/d total May 2026: 711 MMcf/d total Jun 2026: 730 MMcf/d total Jul 2026: 761 MMcf/d total Aug 2026: 759 MMcf/d as filed so far. Filings for this month are still arriving. The chart shows what has been filed. Sep 2026: 83.5 MMcf/d as filed so far. Filings for this month are still arriving. The chart shows what has been filed.

Still arriving: Oct 2026 <1% filed.

All from what the source published. All held at well grain.

How the volume breaks down
  • 88.1% Reported by the official source by well
  • 9.7% Reported by the official source as a lease total, split across the lease's wells. The regional total shown is the reported number, to rounding.
  • under 0.01% Reported by the official source for a longer period, spread across its months. The period total is the reported number.
  • 2.2% A series adjusted to match official published figures: a well's cumulative, a later correction netted into the months before it, a field's oil volume from the royalty file for a month missing from the production report, or a state's yearly total from a second official source.

Every cubic foot here starts from what the official source published for the months measured. Measured over January 1974 to July 2026.

Matador Resources Company natural gas production (MMcf/d, grouped by when each well first produced)
As reported. Reported data only.
Matador Resources Company natural gas production: million cubic feet per day, by first-production vintage as filed so far today 2505007501,000 MMcf/d 2017201820192020202120222023202420252026 Aug 2016: 78.2 MMcf/d total Sep 2016: 85.2 MMcf/d total Oct 2016: 82.8 MMcf/d total Nov 2016: 90.6 MMcf/d total Dec 2016: 83.3 MMcf/d total Jan 2017: 90.5 MMcf/d total Feb 2017: 99.8 MMcf/d total Mar 2017: 107 MMcf/d total Apr 2017: 106 MMcf/d total May 2017: 118 MMcf/d total Jun 2017: 120 MMcf/d total Jul 2017: 124 MMcf/d total Aug 2017: 123 MMcf/d total Sep 2017: 123 MMcf/d total Oct 2017: 133 MMcf/d total Nov 2017: 128 MMcf/d total Dec 2017: 129 MMcf/d total Jan 2018: 127 MMcf/d total Feb 2018: 147 MMcf/d total Mar 2018: 166 MMcf/d total Apr 2018: 166 MMcf/d total May 2018: 196 MMcf/d total Jun 2018: 200 MMcf/d total Jul 2018: 214 MMcf/d total Aug 2018: 201 MMcf/d total Sep 2018: 204 MMcf/d total Oct 2018: 199 MMcf/d total Nov 2018: 200 MMcf/d total Dec 2018: 230 MMcf/d total Jan 2019: 223 MMcf/d total Feb 2019: 218 MMcf/d total Mar 2019: 228 MMcf/d total Apr 2019: 238 MMcf/d total May 2019: 237 MMcf/d total Jun 2019: 249 MMcf/d total Jul 2019: 232 MMcf/d total Aug 2019: 240 MMcf/d total Sep 2019: 268 MMcf/d total Oct 2019: 266 MMcf/d total Nov 2019: 265 MMcf/d total Dec 2019: 257 MMcf/d total Jan 2020: 273 MMcf/d total Feb 2020: 271 MMcf/d total Mar 2020: 285 MMcf/d total Apr 2020: 266 MMcf/d total May 2020: 221 MMcf/d total Jun 2020: 288 MMcf/d total Jul 2020: 298 MMcf/d total Aug 2020: 292 MMcf/d total Sep 2020: 286 MMcf/d total Oct 2020: 276 MMcf/d total Nov 2020: 287 MMcf/d total Dec 2020: 252 MMcf/d total Jan 2021: 247 MMcf/d total Feb 2021: 216 MMcf/d total Mar 2021: 260 MMcf/d total Apr 2021: 290 MMcf/d total May 2021: 296 MMcf/d total Jun 2021: 304 MMcf/d total Jul 2021: 289 MMcf/d total Aug 2021: 295 MMcf/d total Sep 2021: 306 MMcf/d total Oct 2021: 395 MMcf/d total Nov 2021: 363 MMcf/d total Dec 2021: 339 MMcf/d total Jan 2022: 360 MMcf/d total Feb 2022: 425 MMcf/d total Mar 2022: 450 MMcf/d total Apr 2022: 483 MMcf/d total May 2022: 465 MMcf/d total Jun 2022: 430 MMcf/d total Jul 2022: 458 MMcf/d total Aug 2022: 459 MMcf/d total Sep 2022: 476 MMcf/d total Oct 2022: 477 MMcf/d total Nov 2022: 491 MMcf/d total Dec 2022: 513 MMcf/d total Jan 2023: 500 MMcf/d total Feb 2023: 494 MMcf/d total Mar 2023: 519 MMcf/d total Apr 2023: 533 MMcf/d total May 2023: 510 MMcf/d total Jun 2023: 507 MMcf/d total Jul 2023: 507 MMcf/d total Aug 2023: 503 MMcf/d total Sep 2023: 513 MMcf/d total Oct 2023: 536 MMcf/d total Nov 2023: 530 MMcf/d total Dec 2023: 524 MMcf/d total Jan 2024: 487 MMcf/d total Feb 2024: 498 MMcf/d total Mar 2024: 536 MMcf/d total Apr 2024: 538 MMcf/d total May 2024: 559 MMcf/d total Jun 2024: 600 MMcf/d total Jul 2024: 623 MMcf/d total Aug 2024: 604 MMcf/d total Sep 2024: 573 MMcf/d total Oct 2024: 650 MMcf/d total Nov 2024: 661 MMcf/d total Dec 2024: 651 MMcf/d total Jan 2025: 643 MMcf/d total Feb 2025: 618 MMcf/d total Mar 2025: 659 MMcf/d total Apr 2025: 691 MMcf/d total May 2025: 700 MMcf/d total Jun 2025: 685 MMcf/d total Jul 2025: 707 MMcf/d total Aug 2025: 702 MMcf/d total Sep 2025: 681 MMcf/d total Oct 2025: 701 MMcf/d total Nov 2025: 751 MMcf/d total Dec 2025: 790 MMcf/d total Jan 2026: 750 MMcf/d total Feb 2026: 774 MMcf/d total Mar 2026: 794 MMcf/d total Apr 2026: 760 MMcf/d total May 2026: 777 MMcf/d total Jun 2026: 794 MMcf/d total Jul 2026: 829 MMcf/d total Aug 2026: 827 MMcf/d as filed so far. Filings for this month are still arriving. The chart shows what has been filed. Sep 2026: 83.5 MMcf/d as filed so far. Filings for this month are still arriving. The chart shows what has been filed.

Still arriving: Oct 2026 <1% filed.

The bands group wells by when they first produced.

About this chart

The stack shows what is holding today's rate up and how much of it is new drilling. The bands draw the filings already in.

These volumes are the production from the wells and facilities this company operates. Ownership works differently: other parties hold interests in these wells, and this company holds interests in wells that other companies operate. How we attribute production to a company

In Texas, production is reported for an oil lease or unit as well as for individual gas wells. Those lease and unit totals are divided among the wells they cover, and every Texas barrel is labeled reported or allocated. How well-level Texas production is built

Annual table (full history)

best estimate incl. adjusted

YearOil (MMbbl)Gas produced (Bcf)
202558.1251
202447.1199
202334.2147
202227.2118
202119.083
202018.773
201918.269
201815.057
201710.741
20167.126
20156.119
20144.413
20132.811
20121.78
20110.29
2010<0.14
2009<0.13
2008<0.14
2007<0.12
20060.12
2005<0.11
2004<0.1<1
20030.315
20020.624
20010.815
20000.57
19990.55
19980.54
19970.32
19960.32
19950.22
19940.12
19930.11
1992<0.12
1991<0.12
1990<0.12
1989<0.12
1988<0.11
1987<0.12
1986<0.11
1985<0.12
1984<0.12
1983<0.11
1982<0.11
1981<0.11
1980<0.11
1979<0.12
1978<0.12
1977<0.12
1976<0.12
1975<0.12
1974<0.11

Source: CommoVision (commovision.com)

Monthly table (last 24 months)
MonthOil (Mbbl)Gas produced (MMcf)
2026-064,941.421,901
2026-055,093.622,046
2026-045,030.820,963
2026-035,355.022,864
2026-024,355.320,153
2026-014,695.821,740
2025-125,062.222,955
2025-115,021.721,968
2025-105,046.021,641
2025-094,952.520,348
2025-084,833.621,693
2025-075,064.821,857
2025-064,768.420,447
2025-055,181.821,591
2025-044,863.820,633
2025-034,737.220,335
2025-023,942.417,233
2025-014,578.119,860
2024-124,793.020,085
2024-114,713.319,739
2024-104,799.020,036
2024-094,024.116,640
2024-083,943.216,009
2024-073,825.416,920

Source: CommoVision (commovision.com)

Source: CommoVision · Matador Resources Company, data through July 2026.

Well map

A map of 2,279 well locations operated by Matador Resources Company for which CommoVision holds a published surface coordinate, each drawn where it is and colored by its primary product (green for oil, red for natural gas, gray where undetermined; a spot shared by more than one product shows the one with the most wells there), on a ground of land and water over faint country and state outlines and place names for orientation, with a small inset map locating this frame in the United States.
  • Oil 1,828
  • Natural gas 423
  • Undetermined 28
2,279 well locations operated by Matador Resources Company, colored by primary product.
About this map

Undetermined means not enough signal to settle it. Producing wells are the ones that reported oil or gas in the trailing 12 months per region.

164.9 Mbbl/d Jul 2026 oil production +0.9% vs Jul last year
761.3 MMcf/d Jul 2026 gas production +8% vs Jul last year
159 Mbbl/d 2025 oil production
686.5 MMcf/d 2025 gas production
1,454 wells Operated producing wells tracked trailing 12 months per region

Type curves

Matador Resources Company oil type curves (bbl/d per well, log scale, against months on production; cohorts 2010–2026)
Matador Resources Company oil type curves: average barrels per day per well on a log scale against months on production 2010-2014: 61 wells in curve; starts at 203 bbl/d per well, 212 Mbbl cumulative through month 141 (100% of its wells old enough at that month); the dashed curve runs through month 201, on our forecast where a well’s own record ends2015: 40 wells in curve; starts at 176 bbl/d per well, 241 Mbbl cumulative through month 129 (100% of its wells old enough at that month); the dashed curve runs through month 189, on our forecast where a well’s own record ends2016: 42 wells in curve; starts at 321 bbl/d per well, 363 Mbbl cumulative through month 117 (100% of its wells old enough at that month); the dashed curve runs through month 177, on our forecast where a well’s own record ends2017: 67 wells in curve; starts at 277 bbl/d per well, 249 Mbbl cumulative through month 105 (100% of its wells old enough at that month); the dashed curve runs through month 165, on our forecast where a well’s own record ends2018: 115 wells in curve; starts at 330 bbl/d per well, 297 Mbbl cumulative through month 93 (100% of its wells old enough at that month); the dashed curve runs through month 153, on our forecast where a well’s own record ends2019: 103 wells in curve; starts at 469 bbl/d per well, 384 Mbbl cumulative through month 81 (100% of its wells old enough at that month); the dashed curve runs through month 141, on our forecast where a well’s own record ends2020: 78 wells in curve; starts at 480 bbl/d per well, 391 Mbbl cumulative through month 69 (100% of its wells old enough at that month); the dashed curve runs through month 129, on our forecast where a well’s own record ends2021: 93 wells in curve; starts at 413 bbl/d per well, 364 Mbbl cumulative through month 57 (100% of its wells old enough at that month); the dashed curve runs through month 117, on our forecast where a well’s own record ends2022: 168 wells in curve; starts at 236 bbl/d per well, 340 Mbbl cumulative through month 45 (100% of its wells old enough at that month); the dashed curve runs through month 105, on our forecast where a well’s own record ends2023: 115 wells in curve; starts at 276 bbl/d per well, 273 Mbbl cumulative through month 33 (100% of its wells old enough at that month); the dashed curve runs through month 93, on our forecast where a well’s own record ends2024: 141 wells in curve; starts at 375 bbl/d per well, 222 Mbbl cumulative through month 21 (100% of its wells old enough at that month); the dashed curve runs through month 81, on our forecast where a well’s own record ends2025: 163 wells in curve; starts at 228 bbl/d per well, 144 Mbbl cumulative through month 9 (100% of its wells old enough at that month); the dashed curve runs through month 69, on our forecast where a well’s own record ends2026: 97 wells in curve; starts at 391 bbl/d per well, 11.9 Mbbl cumulative through month 1 (100% of its wells old enough at that month); the dashed curve runs through month 61, on our forecast where a well’s own record ends1020501002005001,000bbl/d24487296120144168192216Months on production

1 of the drawn cohorts’ wells is not in these curves yet: it is still producing and joins its curve once it carries a forecast.

Matador Resources Company natural gas type curves (Mcf/d per well, log scale, against months on production; cohorts 2010–2026)
Matador Resources Company natural gas type curves: average thousand cubic feet per day per well on a log scale against months on production 2010-2014: 61 wells in curve; starts at 379 Mcf/d per well, 0.6 Bcf cumulative through month 141 (100% of its wells old enough at that month); the dashed curve runs through month 201, on our forecast where a well’s own record ends2015: 40 wells in curve; starts at 431 Mcf/d per well, 0.7 Bcf cumulative through month 129 (100% of its wells old enough at that month); the dashed curve runs through month 189, on our forecast where a well’s own record ends2016: 42 wells in curve; starts at 1,123 Mcf/d per well, 1.5 Bcf cumulative through month 117 (100% of its wells old enough at that month); the dashed curve runs through month 177, on our forecast where a well’s own record ends2017: 67 wells in curve; starts at 995 Mcf/d per well, 1.3 Bcf cumulative through month 105 (100% of its wells old enough at that month); the dashed curve runs through month 165, on our forecast where a well’s own record ends2018: 115 wells in curve; starts at 861 Mcf/d per well, 1.4 Bcf cumulative through month 93 (100% of its wells old enough at that month); the dashed curve runs through month 153, on our forecast where a well’s own record ends2019: 103 wells in curve; starts at 1,052 Mcf/d per well, 1.2 Bcf cumulative through month 81 (100% of its wells old enough at that month); the dashed curve runs through month 141, on our forecast where a well’s own record ends2020: 78 wells in curve; starts at 1,178 Mcf/d per well, 1.5 Bcf cumulative through month 69 (100% of its wells old enough at that month); the dashed curve runs through month 129, on our forecast where a well’s own record ends2021: 93 wells in curve; starts at 1,523 Mcf/d per well, 1.8 Bcf cumulative through month 57 (100% of its wells old enough at that month); the dashed curve runs through month 117, on our forecast where a well’s own record ends2022: 168 wells in curve; starts at 562 Mcf/d per well, 1.3 Bcf cumulative through month 45 (100% of its wells old enough at that month); the dashed curve runs through month 105, on our forecast where a well’s own record ends2023: 115 wells in curve; starts at 645 Mcf/d per well, 1.1 Bcf cumulative through month 33 (100% of its wells old enough at that month); the dashed curve runs through month 93, on our forecast where a well’s own record ends2024: 141 wells in curve; starts at 691 Mcf/d per well, 0.7 Bcf cumulative through month 21 (100% of its wells old enough at that month); the dashed curve runs through month 81, on our forecast where a well’s own record ends2025: 163 wells in curve; starts at 479 Mcf/d per well, 0.4 Bcf cumulative through month 9 (100% of its wells old enough at that month); the dashed curve runs through month 69, on our forecast where a well’s own record ends2026: 97 wells in curve; starts at 542 Mcf/d per well, 0.0 Bcf cumulative through month 1 (100% of its wells old enough at that month); the dashed curve runs through month 61, on our forecast where a well’s own record ends20501002005001,0002,000Mcf/d24487296120144168192216Months on production

1 of the drawn cohorts’ wells is not in these curves yet: it is still producing and joins its curve once it carries a forecast.

best estimate incl. adjusted

Horizontal wells only. Average production per well, for wells grouped by when they first produced.

How these curves are built

Horizontal wells only: 1,284 of the 1,316 wells in these cohorts. Average daily production per well, for wells grouped by when they first produced. Includes every well of the cohort that is old enough at each month, except wells that are still active but not yet covered by our forecasts; those are left out of both the reported and forecast parts until they are. Wells that are shut in or have stopped producing count as zero, so the average reflects the whole group drawn, not just survivors. Rates are calendar-day (volume ÷ days in month). The cumulative axis accumulates those same monthly averages at the average month length. Months not yet fully reported are excluded. The 2010-2014 curve draws those years as one group. The chart opens on average daily rate against months on production, the rate on a log scale. The view control switches to rate against cumulative production per well, on the same log rate scale, or to cumulative production per well against months on production, on a linear scale. Every view draws the same cohorts from the same production history. Each cohort is solid through the last month all the wells in its curve sit inside fully reported data. Past it the dashed curve carries the same wells forward, on our forecast where a well’s own record ends, for up to five years. A dashed curve runs as far as at least nine in ten of its wells are accounted for. A well that is old enough but shut in still counts, as zero. The measured months are what these wells reported. In the forward months each well counts its own reported figure for each month it has one, our forecast for each month it has only that, and zero for the rest. The forward average counts every well in the curve. The drawn forecast runs up to five years past the measured months. Line thickness tracks how many wells each curve is drawn from. 6 wells are counted here but not shown on the age axis: they started producing in 1995 or earlier, too close to the start of our records for their region to verify their true age.

Cohort summary table
First produced Wells in curve Peak oil (bbl/d per well) Month-12 oil (bbl/d per well) Cum oil in series (Mbbl per well) Peak gas (Mcf/d per well) Month-12 gas (Mcf/d per well) Cum gas in series (Bcf per well) Months in series Wells old enough at last month in series Forecast months drawn
2026 97 391 — 11.9 542 — 0.0 1 100% 60
2025 163 741 — 144 1,847 — 0.4 9 100% 60
2024 141 738 266 222 1,562 1,063 0.7 21 100% 60
2023 115 635 290 273 1,819 1,083 1.1 33 100% 60
2022 168 664 273 340 1,742 1,096 1.3 45 100% 60
2021 93 651 294 364 1,912 1,355 1.8 57 100% 60
2020 78 733 327 391 1,857 1,181 1.5 69 100% 60
2019 103 870 278 384 1,889 811 1.2 81 100% 60
2018 115 658 196 297 1,799 877 1.4 93 100% 60
2017 67 498 170 249 1,714 838 1.3 105 100% 60
2016 42 610 243 363 1,957 925 1.5 117 100% 60
2015 40 419 153 241 872 426 0.7 129 100% 60
2010-2014 61 350 130 212 536 429 0.6 141 100% 60

Source: CommoVision (commovision.com)

Source: CommoVision · Matador Resources Company type curves, per-well production by first-production cohort.

Recent permitting

285 permits approved in the 365 days to September 22, 2026
95 permits in the 90 days to September 22, 2026
95 new-well permits in the 90 days to September 22, 2026
September 22, 2026 latest approval on record
About this chart

Approvals of every permit type per month, the 24 months to Sep 2026. The last bar is Sep 2026 through September 22, 2026 (34 so far), drawn hatched. All 285 approved in the 365 days to September 22, 2026 are permits to drill a new well. Permits to drill a new well: 285 in the 365 days to September 22, 2026 and 95 in the last 90 days of that window. How permits are counted.

  • Matador Resources Company was granted 285 well permits in the 365 days to September 22, 2026. Of those, 95 came in the last 90 days of that window. The latest approval on record is dated September 22, 2026.
  • All 285 approved in the 365 days to September 22, 2026 are permits to drill a new well. Permits to drill a new well: 285 in the 365 days to September 22, 2026 and 95 in the last 90 days of that window.
  • Permits counted here come from New Mexico and Texas.
Well permits approved per month: full table
MonthPermits approved
Sep 2026 (through September 22, 2026)34
Aug 202634
Jul 202627
Jun 202614
May 202614
Apr 20261
Mar 20265
Feb 202623
Jan 202664
Dec 202531
Nov 202510
Oct 202525
Sep 202517
Aug 20257
Jul 202517
Jun 202525
May 202514
Apr 20252
Mar 202510
Feb 202545
Jan 202511
Dec 202417
Nov 202413
Oct 202443

Source: CommoVision (commovision.com)

What we cover here

Each row names the grain a region’s production is held at. Where a source publishes at a coarser grain, the page says so.

DataGrainSinceBenchmark
Kansas production well 1987-01 ~99% of EIA
Louisiana production well 1977-01 ~97–98% of EIA
New Mexico production well 1924-01 ~98–100% of EIA
Texas production well 1993-01 ~100% of EIA

Benchmark cells compare our series with the EIA’s published estimates.

About the EIA comparison

The two are produced differently: the EIA estimates from a survey of the largest operators and a model built to anticipate late filings, while the series compared here are rebuilt from official records as they arrive. Recent months can differ without either being wrong; the methodology page explains both methods.

Coverage rows for Matador Resources Company are regenerated at every build from the same catalog of sources the data is built from.

Top regions by 2025 operated production

RegionOil (MMbbl)Gas produced (Bcf)Share of 2025 output
New Mexico55223.993.5%
Texas3.126.36.4%
Louisiana00.30.0%
Kansas000.0%

Share of output counts oil and gas together, gas at its market-value weight.

What the data shows

  • Matador Resources Company produced 58.1 MMbbl of oil and 250.6 Bcf of natural gas in 2025.
  • Matador Resources Company oil production reached its highest level on record in 2025 at 58.1 MMbbl.
  • Matador Resources Company operated production across 4 reporting regions in 1 country (United States) in our coverage.
  • 1,454 operated producing wells tracked, trailing 12 months per region.

Corporate history

Start a free trial

Watch supply move as soon as its sources publish, with forecasts on 1.1+ million producing wells. A real API and MCP access for AI tools are live, and the Portal is open.

What the trial includes

Data use is subject to our Terms of Service.