CommoVision

See the future in real time

Gulf of Mexico

Gulf of Mexico produced 711.0 MMbbl of oil and 758.7 Bcf of natural gas in 2025. 1,901 producing wells tracked, 12 months to Jun 2026.

  • Third-largest oil-producing federal offshore area among the US regions we publish, 2025.
  • 14.3% of the oil produced in the United States, 2025.
  • Oil production rose 8% in 2025 from 2024.
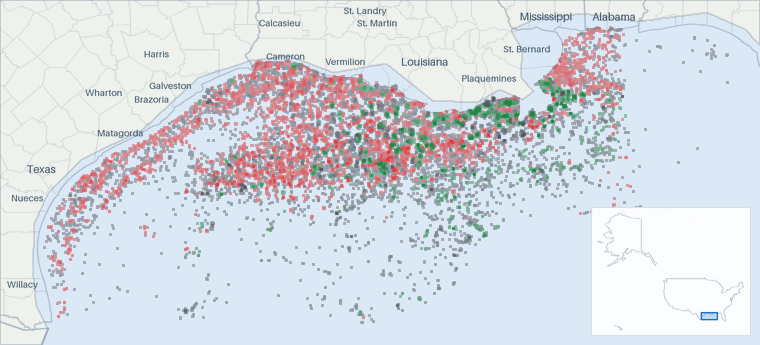
Well map of Gulf of Mexico. The full map is further down this page.

Production

Gulf of Mexico oil production (MMbbl/d, grouped by when each well first produced)
  • filling in (est. · missed) . Hatching marks our estimate of the volume still to be filed. That estimate draws on our own production forecast. A check on the forecast behind this estimate measured a miss. It updates as filings arrive
  • estimated . Hatching marks our estimate. In the most recent months that is volume still to be filed. Past the divider it is our estimate of each whole month, built on any filings already in. Beyond the last filings it is our forecast.
Gulf of Mexico oil production: million barrels per day, by first-production vintage filed in full 123 MMbbl/d 2017201820192020202120222023202420252026 Oct 2016: 1.61 MMbbl/d total Nov 2016: 1.68 MMbbl/d total Dec 2016: 1.74 MMbbl/d total Jan 2017: 1.75 MMbbl/d total Feb 2017: 1.75 MMbbl/d total Mar 2017: 1.77 MMbbl/d total Apr 2017: 1.67 MMbbl/d total May 2017: 1.69 MMbbl/d total Jun 2017: 1.63 MMbbl/d total Jul 2017: 1.76 MMbbl/d total Aug 2017: 1.72 MMbbl/d total Sep 2017: 1.69 MMbbl/d total Oct 2017: 1.48 MMbbl/d total Nov 2017: 1.7 MMbbl/d total Dec 2017: 1.57 MMbbl/d total Jan 2018: 1.64 MMbbl/d total Feb 2018: 1.71 MMbbl/d total Mar 2018: 1.71 MMbbl/d total Apr 2018: 1.6 MMbbl/d total May 2018: 1.54 MMbbl/d total Jun 2018: 1.67 MMbbl/d total Jul 2018: 1.87 MMbbl/d total Aug 2018: 1.96 MMbbl/d total Sep 2018: 1.8 MMbbl/d total Oct 2018: 1.75 MMbbl/d total Nov 2018: 1.95 MMbbl/d total Dec 2018: 1.92 MMbbl/d total Jan 2019: 1.92 MMbbl/d total Feb 2019: 1.74 MMbbl/d total Mar 2019: 1.93 MMbbl/d total Apr 2019: 1.97 MMbbl/d total May 2019: 1.91 MMbbl/d total Jun 2019: 1.93 MMbbl/d total Jul 2019: 1.53 MMbbl/d total Aug 2019: 2.04 MMbbl/d total Sep 2019: 1.92 MMbbl/d total Oct 2019: 1.91 MMbbl/d total Nov 2019: 2 MMbbl/d total Dec 2019: 1.98 MMbbl/d total Jan 2020: 1.99 MMbbl/d total Feb 2020: 2 MMbbl/d total Mar 2020: 1.98 MMbbl/d total Apr 2020: 1.91 MMbbl/d total May 2020: 1.6 MMbbl/d total Jun 2020: 1.56 MMbbl/d total Jul 2020: 1.66 MMbbl/d total Aug 2020: 1.19 MMbbl/d total Sep 2020: 1.54 MMbbl/d total Oct 2020: 1.07 MMbbl/d total Nov 2020: 1.72 MMbbl/d total Dec 2020: 1.82 MMbbl/d total Jan 2021: 1.81 MMbbl/d total Feb 2021: 1.8 MMbbl/d total Mar 2021: 1.88 MMbbl/d total Apr 2021: 1.8 MMbbl/d total May 2021: 1.82 MMbbl/d total Jun 2021: 1.78 MMbbl/d total Jul 2021: 1.85 MMbbl/d total Aug 2021: 1.55 MMbbl/d total Sep 2021: 1.06 MMbbl/d total Oct 2021: 1.68 MMbbl/d total Nov 2021: 1.77 MMbbl/d total Dec 2021: 1.69 MMbbl/d total Jan 2022: 1.69 MMbbl/d total Feb 2022: 1.61 MMbbl/d total Mar 2022: 1.68 MMbbl/d total Apr 2022: 1.75 MMbbl/d total May 2022: 1.61 MMbbl/d total Jun 2022: 1.74 MMbbl/d total Jul 2022: 1.73 MMbbl/d total Aug 2022: 1.76 MMbbl/d total Sep 2022: 1.83 MMbbl/d total Oct 2022: 1.79 MMbbl/d total Nov 2022: 1.8 MMbbl/d total Dec 2022: 1.79 MMbbl/d total Jan 2023: 1.91 MMbbl/d total Feb 2023: 1.85 MMbbl/d total Mar 2023: 1.88 MMbbl/d total Apr 2023: 1.75 MMbbl/d total May 2023: 1.72 MMbbl/d total Jun 2023: 1.85 MMbbl/d total Jul 2023: 1.93 MMbbl/d total Aug 2023: 1.88 MMbbl/d total Sep 2023: 1.97 MMbbl/d total Oct 2023: 1.94 MMbbl/d total Nov 2023: 1.86 MMbbl/d total Dec 2023: 1.85 MMbbl/d total Jan 2024: 1.76 MMbbl/d total Feb 2024: 1.82 MMbbl/d total Mar 2024: 1.81 MMbbl/d total Apr 2024: 1.86 MMbbl/d total May 2024: 1.8 MMbbl/d total Jun 2024: 1.82 MMbbl/d total Jul 2024: 1.83 MMbbl/d total Aug 2024: 1.85 MMbbl/d total Sep 2024: 1.61 MMbbl/d total Oct 2024: 1.82 MMbbl/d total Nov 2024: 1.67 MMbbl/d total Dec 2024: 1.87 MMbbl/d total Jan 2025: 1.81 MMbbl/d total Feb 2025: 1.77 MMbbl/d total Mar 2025: 1.81 MMbbl/d total Apr 2025: 1.83 MMbbl/d total May 2025: 1.84 MMbbl/d total Jun 2025: 1.95 MMbbl/d total Jul 2025: 1.94 MMbbl/d total Aug 2025: 2.03 MMbbl/d total Sep 2025: 2.07 MMbbl/d total Oct 2025: 2.15 MMbbl/d total Nov 2025: 2.07 MMbbl/d total Dec 2025: 2.1 MMbbl/d total Jan 2026: 2.1 MMbbl/d total Feb 2026: 2.03 MMbbl/d total Mar 2026: 2.03 MMbbl/d total Apr 2026: 2.13 MMbbl/d total May 2026: 1.92 MMbbl/d total Jun 2026: ≈2 MMbbl/d total (95% arrived, remainder estimated) Jul 2026: ≈2.01 MMbbl/d total (<1% arrived, remainder estimated) Aug 2026: ≈2 MMbbl/d total (<1% arrived, remainder estimated) Sep 2026: ≈1.99 MMbbl/d total (<1% arrived, remainder estimated)

In this view, hatching marks our estimate, and in the most recent months that is volume still to be filed. Past the divider, the chart continues only the bands it has drawn. Each band continues as our estimate, from any filings already in and then from our forecast, built by summing our per-well forecasts. The method behind each well is recorded with the forecast. The forward months cover existing wells only. How our methods work

All from what the source published. All held at well grain.

How the volume breaks down
  • 100% Reported by the official source by well

Every barrel through May 2026 starts from what the official source published for those months. Measured over January 1948 to May 2026.

Gulf of Mexico natural gas production (Bcf/d, grouped by when each well first produced)
  • filling in (est. · missed) . Hatching marks our estimate of the volume still to be filed. That estimate draws on our own production forecast. A check on the forecast behind this estimate measured a miss. It updates as filings arrive
  • estimated . Hatching marks our estimate. In the most recent months that is volume still to be filed. Past the divider it is our estimate of each whole month, built on any filings already in. Beyond the last filings it is our forecast.
Gulf of Mexico natural gas production: billion cubic feet per day, by first-production vintage filed in full 1234 Bcf/d 2017201820192020202120222023202420252026 Oct 2016: 3.3 Bcf/d total Nov 2016: 3.32 Bcf/d total Dec 2016: 3.39 Bcf/d total Jan 2017: 3.34 Bcf/d total Feb 2017: 3.23 Bcf/d total Mar 2017: 3.34 Bcf/d total Apr 2017: 3.09 Bcf/d total May 2017: 3.12 Bcf/d total Jun 2017: 2.96 Bcf/d total Jul 2017: 3.08 Bcf/d total Aug 2017: 2.92 Bcf/d total Sep 2017: 2.88 Bcf/d total Oct 2017: 2.53 Bcf/d total Nov 2017: 2.65 Bcf/d total Dec 2017: 2.46 Bcf/d total Jan 2018: 2.47 Bcf/d total Feb 2018: 2.61 Bcf/d total Mar 2018: 2.65 Bcf/d total Apr 2018: 2.47 Bcf/d total May 2018: 2.48 Bcf/d total Jun 2018: 2.59 Bcf/d total Jul 2018: 2.91 Bcf/d total Aug 2018: 3.09 Bcf/d total Sep 2018: 2.89 Bcf/d total Oct 2018: 2.73 Bcf/d total Nov 2018: 2.95 Bcf/d total Dec 2018: 2.91 Bcf/d total Jan 2019: 2.96 Bcf/d total Feb 2019: 2.8 Bcf/d total Mar 2019: 3.03 Bcf/d total Apr 2019: 2.96 Bcf/d total May 2019: 2.9 Bcf/d total Jun 2019: 2.8 Bcf/d total Jul 2019: 2.22 Bcf/d total Aug 2019: 3 Bcf/d total Sep 2019: 2.86 Bcf/d total Oct 2019: 2.86 Bcf/d total Nov 2019: 2.85 Bcf/d total Dec 2019: 2.88 Bcf/d total Jan 2020: 2.84 Bcf/d total Feb 2020: 2.86 Bcf/d total Mar 2020: 2.89 Bcf/d total Apr 2020: 2.73 Bcf/d total May 2020: 2.12 Bcf/d total Jun 2020: 2.12 Bcf/d total Jul 2020: 2.26 Bcf/d total Aug 2020: 1.47 Bcf/d total Sep 2020: 1.68 Bcf/d total Oct 2020: 1.31 Bcf/d total Nov 2020: 2.07 Bcf/d total Dec 2020: 2.22 Bcf/d total Jan 2021: 2.36 Bcf/d total Feb 2021: 2.34 Bcf/d total Mar 2021: 2.43 Bcf/d total Apr 2021: 2.36 Bcf/d total May 2021: 2.36 Bcf/d total Jun 2021: 2.29 Bcf/d total Jul 2021: 2.36 Bcf/d total Aug 2021: 2.02 Bcf/d total Sep 2021: 1.19 Bcf/d total Oct 2021: 1.97 Bcf/d total Nov 2021: 2.22 Bcf/d total Dec 2021: 2.23 Bcf/d total Jan 2022: 2.13 Bcf/d total Feb 2022: 2.07 Bcf/d total Mar 2022: 2.12 Bcf/d total Apr 2022: 2.22 Bcf/d total May 2022: 2.04 Bcf/d total Jun 2022: 2.18 Bcf/d total Jul 2022: 2.18 Bcf/d total Aug 2022: 2.23 Bcf/d total Sep 2022: 2.2 Bcf/d total Oct 2022: 2.18 Bcf/d total Nov 2022: 2.19 Bcf/d total Dec 2022: 2.13 Bcf/d total Jan 2023: 2.29 Bcf/d total Feb 2023: 2.22 Bcf/d total Mar 2023: 2.17 Bcf/d total Apr 2023: 2.05 Bcf/d total May 2023: 1.91 Bcf/d total Jun 2023: 1.98 Bcf/d total Jul 2023: 2.01 Bcf/d total Aug 2023: 2.02 Bcf/d total Sep 2023: 2.12 Bcf/d total Oct 2023: 2 Bcf/d total Nov 2023: 1.98 Bcf/d total Dec 2023: 2.01 Bcf/d total Jan 2024: 1.97 Bcf/d total Feb 2024: 1.94 Bcf/d total Mar 2024: 1.81 Bcf/d total Apr 2024: 1.94 Bcf/d total May 2024: 1.79 Bcf/d total Jun 2024: 1.89 Bcf/d total Jul 2024: 1.94 Bcf/d total Aug 2024: 1.96 Bcf/d total Sep 2024: 1.66 Bcf/d total Oct 2024: 1.93 Bcf/d total Nov 2024: 1.73 Bcf/d total Dec 2024: 1.95 Bcf/d total Jan 2025: 1.87 Bcf/d total Feb 2025: 1.87 Bcf/d total Mar 2025: 1.95 Bcf/d total Apr 2025: 1.95 Bcf/d total May 2025: 1.98 Bcf/d total Jun 2025: 2.08 Bcf/d total Jul 2025: 2.12 Bcf/d total Aug 2025: 2.19 Bcf/d total Sep 2025: 2.19 Bcf/d total Oct 2025: 2.27 Bcf/d total Nov 2025: 2.19 Bcf/d total Dec 2025: 2.26 Bcf/d total Jan 2026: 2.24 Bcf/d total Feb 2026: 2.17 Bcf/d total Mar 2026: 2.18 Bcf/d total Apr 2026: 2.26 Bcf/d total May 2026: 1.96 Bcf/d total Jun 2026: ≈2.09 Bcf/d total (95% arrived, remainder estimated) Jul 2026: ≈2.09 Bcf/d total (<1% arrived, remainder estimated) Aug 2026: ≈2.15 Bcf/d total (<1% arrived, remainder estimated) Sep 2026: ≈2.15 Bcf/d total (<1% arrived, remainder estimated)

In this view, hatching marks our estimate, and in the most recent months that is volume still to be filed. Past the divider, the chart continues only the bands it has drawn. Each band continues as our estimate, from any filings already in and then from our forecast, built by summing our per-well forecasts. The method behind each well is recorded with the forecast. The forward months cover existing wells only. How our methods work

All from what the source published. All held at well grain.

How the volume breaks down
  • 100% Reported by the official source by well

Every cubic foot through May 2026 starts from what the official source published for those months. Measured over January 1948 to May 2026.

The bands group wells by when they first produced.

About this chart

The stack shows what is holding today's rate up and how much of it is new drilling. In the reported months the bands draw the filings already in. The months still filling in are marked.

Annual table (full history)
YearOil (MMbbl)Gas produced (Bcf)
2025711.0759
2024656.2687
2023680.8752
2022632.2787
2021623.3795
2020610.2809
2019693.11,038
2018642.2996
2017613.91,082
2016585.91,224
2015553.21,312
2014510.71,282
2013459.21,334
2012465.01,542
2011481.91,833
2010566.72,259
2009570.32,460
2008423.52,339
2007468.02,824
2006472.12,935
2005467.03,169
2004535.44,021
2003561.64,445
2002568.04,539
2001558.95,072
2000523.24,968
1999495.35,066
1998444.55,122
1997411.95,261
1996369.35,196
1995345.54,892
1994314.74,942
1993309.24,769
1992305.34,758
1991295.14,814
1990275.05,017
1989281.24,744
1988301.74,684
1987328.24,636
1986356.44,147
1985351.14,162
1984355.24,657
1983320.64,157
1982286.24,760
1981263.34,987
1980264.64,861
1979263.34,765
1978276.24,329
1977284.03,843
1976300.83,628
1975309.83,495
1974338.13,486
1973366.03,378
1972373.33,064
1971375.82,784
1970329.12,450
1969292.21,989
1968253.81,632
1967209.51,311
1966175.51,012
1965136.0757
1964111.3657
196396.4572
196276.8460
196155.7341
196040.6287
195929.7229
195819.7146
195711.995
19567.093
19553.889
19542.461
19531.325
19520.820
19510.42
19500.2<1
19490.2<1
19480.1<1

Source: CommoVision (commovision.com)

Monthly table (last 24 months)
MonthOil (Mbbl)Gas produced (MMcf)
2026-0657,420.059,457
2026-0559,380.760,611
2026-0463,955.267,773
2026-0362,994.967,625
2026-0256,957.060,787
2026-0164,971.169,342
2025-1265,078.769,976
2025-1162,095.665,830
2025-1066,501.370,337
2025-0961,931.965,700
2025-0862,996.567,957
2025-0759,986.665,723
2025-0658,469.662,339
2025-0557,137.261,282
2025-0454,903.858,559
2025-0356,155.960,550
2025-0249,673.752,394
2025-0156,035.058,090
2024-1258,053.060,377
2024-1150,237.551,941
2024-1056,265.459,936
2024-0948,320.949,616
2024-0857,156.860,724
2024-0756,845.260,181

Source: CommoVision (commovision.com)

Source: CommoVision · Gulf of Mexico, data through June 2026.

Well map

A map of 55,551 well locations in Gulf of Mexico for which CommoVision holds a published surface coordinate, each drawn where it is and colored by its primary product (green for oil, red for natural gas, gray where undetermined; a spot shared by more than one product shows the one with the most wells there), on a ground of land and water over faint country, state and county outlines and place names for orientation, with a small inset map locating this frame in the United States.
  • Oil 12,811
  • Natural gas 15,819
  • Undetermined 26,921
55,551 well locations in Gulf of Mexico, colored by primary product.
About this map

Undetermined means not enough signal to settle it. Producing wells are the ones that reported oil or gas in the 12 months to Jun 2026.

2.01 MMbbl/d (est.) Jun 2026 oil production Jun 2026 is still filling in. The figure is the filings already in plus an estimate of the part not yet filed. The change compares this estimate with the same month last year. +2.9% vs Jun last year
2.09 Bcf/d (est.) Jun 2026 gas production Jun 2026 is still filling in. The figure is the filings already in plus an estimate of the part not yet filed. The change compares this estimate with the same month last year. +0.7% vs Jun last year
1.95 MMbbl/d 2025 oil production
2.08 Bcf/d 2025 gas production
1,901 wells Producing wells tracked 12 months to Jun 2026
1.51 MMbbl/d Existing wells, Sep 2027 forecast Our forecast for existing wells.
1.5 Bcf/d Existing wells, Sep 2027 forecast Our forecast for existing wells.

Type curves

Gulf of Mexico oil type curves (bbl/d per well, log scale, against months on production; cohorts 2010–2026)
Gulf of Mexico oil type curves: average barrels per day per well on a log scale against months on production 2010-2014: 775 wells; starts at 524 bbl/d per well, 2,364 Mbbl cumulative through month 139 (100% of its wells old enough at that month); the dashed curve runs through month 199, on our forecast where a well’s own record ends2015: 125 wells; starts at 929 bbl/d per well, 4,938 Mbbl cumulative through month 127 (100% of its wells old enough at that month); the dashed curve runs through month 187, on our forecast where a well’s own record ends2016: 74 wells; starts at 1,241 bbl/d per well, 9,319 Mbbl cumulative through month 115 (100% of its wells old enough at that month); the dashed curve runs through month 175, on our forecast where a well’s own record ends2017: 68 wells; starts at 912 bbl/d per well, 6,530 Mbbl cumulative through month 103 (100% of its wells old enough at that month); the dashed curve runs through month 163, on our forecast where a well’s own record ends2018: 101 wells; starts at 1,177 bbl/d per well, 6,578 Mbbl cumulative through month 91 (100% of its wells old enough at that month); the dashed curve runs through month 151, on our forecast where a well’s own record ends2019: 82 wells; starts at 1,330 bbl/d per well, 4,830 Mbbl cumulative through month 79 (100% of its wells old enough at that month); the dashed curve runs through month 139, on our forecast where a well’s own record ends2020: 46 wells; starts at 1,341 bbl/d per well, 5,302 Mbbl cumulative through month 67 (100% of its wells old enough at that month); the dashed curve runs through month 127, on our forecast where a well’s own record ends2021: 57 wells; starts at 1,486 bbl/d per well, 5,062 Mbbl cumulative through month 55 (100% of its wells old enough at that month); the dashed curve runs through month 115, on our forecast where a well’s own record ends2022: 75 wells; starts at 1,353 bbl/d per well, 3,798 Mbbl cumulative through month 43 (100% of its wells old enough at that month); the dashed curve runs through month 103, on our forecast where a well’s own record ends2023: 72 wells; starts at 1,653 bbl/d per well, 3,070 Mbbl cumulative through month 31 (100% of its wells old enough at that month); the dashed curve runs through month 91, on our forecast where a well’s own record ends2024: 54 wells; starts at 1,982 bbl/d per well, 2,622 Mbbl cumulative through month 19 (100% of its wells old enough at that month); the dashed curve runs through month 79, on our forecast where a well’s own record ends2025: 72 wells; starts at 1,644 bbl/d per well, 1,228 Mbbl cumulative through month 7 (100% of its wells old enough at that month); the dashed curve runs through month 67, on our forecast where a well’s own record ends2026: 26 wells; starts at 1,448 bbl/d per well, 44.1 Mbbl cumulative through month 1 (100% of its wells old enough at that month); the dashed curve runs through month 61, on our forecast where a well’s own record ends1002005001,0002,0005,00010,000bbl/d24487296120144168192216Months on production
Gulf of Mexico natural gas type curves (Mcf/d per well, log scale, against months on production; cohorts 2010–2026)
Gulf of Mexico natural gas type curves: average thousand cubic feet per day per well on a log scale against months on production 2010-2014: 775 wells; starts at 1,444 Mcf/d per well, 4.6 Bcf cumulative through month 139 (100% of its wells old enough at that month); the dashed curve runs through month 199, on our forecast where a well’s own record ends2015: 125 wells; starts at 1,962 Mcf/d per well, 9.3 Bcf cumulative through month 127 (100% of its wells old enough at that month); the dashed curve runs through month 187, on our forecast where a well’s own record ends2016: 74 wells; starts at 1,456 Mcf/d per well, 9.3 Bcf cumulative through month 115 (100% of its wells old enough at that month); the dashed curve runs through month 175, on our forecast where a well’s own record ends2017: 68 wells; starts at 1,131 Mcf/d per well, 5.4 Bcf cumulative through month 103 (100% of its wells old enough at that month); the dashed curve runs through month 163, on our forecast where a well’s own record ends2018: 101 wells; starts at 1,617 Mcf/d per well, 6.5 Bcf cumulative through month 91 (100% of its wells old enough at that month); the dashed curve runs through month 151, on our forecast where a well’s own record ends2019: 82 wells; starts at 1,767 Mcf/d per well, 5.3 Bcf cumulative through month 79 (100% of its wells old enough at that month); the dashed curve runs through month 139, on our forecast where a well’s own record ends2020: 46 wells; starts at 1,710 Mcf/d per well, 4.9 Bcf cumulative through month 67 (100% of its wells old enough at that month); the dashed curve runs through month 127, on our forecast where a well’s own record ends2021: 57 wells; starts at 1,839 Mcf/d per well, 5.6 Bcf cumulative through month 55 (100% of its wells old enough at that month); the dashed curve runs through month 115, on our forecast where a well’s own record ends2022: 75 wells; starts at 1,754 Mcf/d per well, 3.6 Bcf cumulative through month 43 (100% of its wells old enough at that month); the dashed curve runs through month 103, on our forecast where a well’s own record ends2023: 72 wells; starts at 1,572 Mcf/d per well, 2.9 Bcf cumulative through month 31 (100% of its wells old enough at that month); the dashed curve runs through month 91, on our forecast where a well’s own record ends2024: 54 wells; starts at 2,077 Mcf/d per well, 2.6 Bcf cumulative through month 19 (100% of its wells old enough at that month); the dashed curve runs through month 79, on our forecast where a well’s own record ends2025: 72 wells; starts at 1,269 Mcf/d per well, 1.3 Bcf cumulative through month 7 (100% of its wells old enough at that month); the dashed curve runs through month 67, on our forecast where a well’s own record ends2026: 26 wells; starts at 830 Mcf/d per well, 0.0 Bcf cumulative through month 1 (100% of its wells old enough at that month); the dashed curve runs through month 61, on our forecast where a well’s own record ends1002005001,0002,0005,00010,000Mcf/d24487296120144168192216Months on production

Average production per well, for wells grouped by when they first produced.

How these curves are built

Average daily production per well, for wells grouped by when they first produced. Includes every well of the cohort that is old enough at each month. Wells that are shut in or have stopped producing count as zero, so the average reflects the full cohort, not just survivors. Rates are calendar-day (volume ÷ days in month). The cumulative axis accumulates those same monthly averages at the average month length. Months not yet fully reported are excluded. The 2010-2014 curve draws those years as one group. The chart opens on average daily rate against months on production, the rate on a log scale. The view control switches to rate against cumulative production per well, on the same log rate scale, or to cumulative production per well against months on production, on a linear scale. Every view draws the same cohorts from the same production history. Each cohort is solid through the last month all of its wells sit inside fully reported data. Past it the dashed curve carries the same wells forward, on our forecast where a well’s own record ends, for up to five years. A dashed curve runs as far as at least nine in ten of its wells are accounted for. A well that is old enough but shut in still counts, as zero. The measured months are what these wells reported. In the forward months each well counts its own reported figure for each month it has one, our forecast for each month it has only that, and zero for the rest. The forward average counts every well of the cohort. The drawn forecast runs up to five years past the measured months. Line thickness tracks the size of each cohort.

Cohort summary table
First produced Wells Peak oil (bbl/d per well) Month-12 oil (bbl/d per well) Cum oil in series (Mbbl per well) Peak gas (Mcf/d per well) Month-12 gas (Mcf/d per well) Cum gas in series (Bcf per well) Months in series Wells old enough at last month in series Forecast months drawn
2026 26 1,448 44.1 830 0.0 1 100% 60
2025 72 7,358 1,228 7,990 1.3 7 100% 60
2024 54 5,107 4,685 2,622 5,191 4,566 2.6 19 100% 60
2023 72 4,884 3,651 3,070 4,154 3,399 2.9 31 100% 60
2022 75 4,487 3,832 3,798 4,333 3,469 3.6 43 100% 60
2021 57 4,484 3,475 5,062 5,257 4,101 5.6 55 100% 60
2020 46 3,956 3,686 5,302 4,343 4,082 4.9 67 100% 60
2019 82 3,744 2,959 4,830 5,766 3,908 5.3 79 100% 60
2018 101 4,020 3,527 6,578 5,838 4,479 6.5 91 100% 60
2017 68 3,382 2,893 6,530 3,783 2,887 5.4 103 100% 60
2016 74 5,024 4,958 9,319 5,225 4,909 9.3 115 100% 60
2015 125 2,853 2,596 4,938 6,579 6,038 9.3 127 100% 60
2010-2014 775 1,288 1,107 2,364 3,369 2,694 4.6 139 100% 60

Source: CommoVision (commovision.com)

Source: CommoVision · Gulf of Mexico type curves, per-well production by first-production cohort.

Top operators in Gulf of Mexico, 2025

  1. Shell 27.5%
  2. BP 19.9%
  3. Chevron 14.8%
  4. Anadarko Petroleum 9.2%
  5. Talos Energy 5.6%
  6. Murphy Oil Corporation 5.3%
  7. LLOG Exploration Offshore 3.9%
  8. BOE Exploration & Production LLC 2.0%
  9. Woodside Energy Group 1.7%
  10. Hess Corporation 1.5%
  11. 25 other operators 8.6%
Top operators in Gulf of Mexico, 2025: full table
OperatorOil (Mbbl/d, 2025)Gas produced (MMcf/d, 2025)Share of output
Shell 535.3588.727.5%
BP 396.8267.819.9%
Chevron 297.1183.714.8%
Anadarko Petroleum 182.1160.39.2%
Talos Energy 100.2236.75.6%
Murphy Oil Corporation 100.2146.95.3%
LLOG Exploration Offshore 76.584.73.9%
BOE Exploration & Production LLC 38.936.32.0%
Woodside Energy Group 35.213.91.7%
Hess Corporation (January to July) 47.178.91.5%
25 other operators 158.2313.88.6%

Mbbl/d = thousand barrels per day · MMcf/d = million cubic feet per day (units).

Source: CommoVision (commovision.com)

Active drilling rigs

6 rigs active in the week to September 11, 2026
−4 rigs vs the same week a year earlier
26 rigs peak week, Jun 2019 (since Sep 2016)
Active drilling rigs by rig type (rigs, weekly count)Source: Baker Hughes rig count
Oil Gas Miscellaneous
Active drilling rigs by rig type: rigs, weekly count 10 20 30 rigs 2017201820192020202120222023202420252026 Week to Sep 16, 2016: 20 rigs total (Oil 19, Gas 1, Miscellaneous 0) Week to Sep 23, 2016: 20 rigs total (Oil 19, Gas 1, Miscellaneous 0) Week to Sep 30, 2016: 21 rigs total (Oil 20, Gas 1, Miscellaneous 0) Week to Oct 7, 2016: 22 rigs total (Oil 22, Gas 0, Miscellaneous 0) Week to Oct 14, 2016: 22 rigs total (Oil 22, Gas 0, Miscellaneous 0) Week to Oct 21, 2016: 22 rigs total (Oil 22, Gas 0, Miscellaneous 0) Week to Oct 28, 2016: 21 rigs total (Oil 21, Gas 0, Miscellaneous 0) Week to Nov 4, 2016: 21 rigs total (Oil 21, Gas 0, Miscellaneous 0) Week to Nov 11, 2016: 21 rigs total (Oil 21, Gas 0, Miscellaneous 0) Week to Nov 18, 2016: 23 rigs total (Oil 23, Gas 0, Miscellaneous 0) Week to Nov 23, 2016: 23 rigs total (Oil 23, Gas 0, Miscellaneous 0) Week to Dec 2, 2016: 22 rigs total (Oil 22, Gas 0, Miscellaneous 0) Week to Dec 9, 2016: 22 rigs total (Oil 22, Gas 0, Miscellaneous 0) Week to Dec 16, 2016: 22 rigs total (Oil 22, Gas 0, Miscellaneous 0) Week to Dec 23, 2016: 24 rigs total (Oil 24, Gas 0, Miscellaneous 0) Week to Dec 30, 2016: 22 rigs total (Oil 22, Gas 0, Miscellaneous 0) Week to Jan 6, 2017: 23 rigs total (Oil 23, Gas 0, Miscellaneous 0) Week to Jan 13, 2017: 24 rigs total (Oil 24, Gas 0, Miscellaneous 0) Week to Jan 20, 2017: 23 rigs total (Oil 23, Gas 0, Miscellaneous 0) Week to Jan 27, 2017: 20 rigs total (Oil 20, Gas 0, Miscellaneous 0) Week to Feb 3, 2017: 21 rigs total (Oil 21, Gas 0, Miscellaneous 0) Week to Feb 10, 2017: 20 rigs total (Oil 20, Gas 0, Miscellaneous 0) Week to Feb 17, 2017: 17 rigs total (Oil 17, Gas 0, Miscellaneous 0) Week to Feb 24, 2017: 17 rigs total (Oil 17, Gas 0, Miscellaneous 0) Week to Mar 3, 2017: 18 rigs total (Oil 18, Gas 0, Miscellaneous 0) Week to Mar 10, 2017: 20 rigs total (Oil 20, Gas 0, Miscellaneous 0) Week to Mar 17, 2017: 19 rigs total (Oil 19, Gas 0, Miscellaneous 0) Week to Mar 24, 2017: 18 rigs total (Oil 18, Gas 0, Miscellaneous 0) Week to Mar 31, 2017: 22 rigs total (Oil 21, Gas 1, Miscellaneous 0) Week to Apr 7, 2017: 22 rigs total (Oil 20, Gas 2, Miscellaneous 0) Week to Apr 13, 2017: 21 rigs total (Oil 19, Gas 2, Miscellaneous 0) Week to Apr 21, 2017: 20 rigs total (Oil 18, Gas 2, Miscellaneous 0) Week to Apr 28, 2017: 17 rigs total (Oil 15, Gas 2, Miscellaneous 0) Week to May 5, 2017: 18 rigs total (Oil 15, Gas 3, Miscellaneous 0) Week to May 12, 2017: 20 rigs total (Oil 17, Gas 3, Miscellaneous 0) Week to May 19, 2017: 23 rigs total (Oil 19, Gas 4, Miscellaneous 0) Week to May 26, 2017: 23 rigs total (Oil 19, Gas 4, Miscellaneous 0) Week to Jun 2, 2017: 23 rigs total (Oil 20, Gas 3, Miscellaneous 0) Week to Jun 9, 2017: 21 rigs total (Oil 19, Gas 2, Miscellaneous 0) Week to Jun 16, 2017: 21 rigs total (Oil 19, Gas 2, Miscellaneous 0) Week to Jun 23, 2017: 21 rigs total (Oil 19, Gas 2, Miscellaneous 0) Week to Jun 30, 2017: 21 rigs total (Oil 18, Gas 3, Miscellaneous 0) Week to Jul 7, 2017: 21 rigs total (Oil 18, Gas 3, Miscellaneous 0) Week to Jul 14, 2017: 21 rigs total (Oil 18, Gas 3, Miscellaneous 0) Week to Jul 21, 2017: 23 rigs total (Oil 20, Gas 3, Miscellaneous 0) Week to Jul 28, 2017: 23 rigs total (Oil 19, Gas 4, Miscellaneous 0) Week to Aug 4, 2017: 16 rigs total (Oil 14, Gas 2, Miscellaneous 0) Week to Aug 11, 2017: 17 rigs total (Oil 15, Gas 2, Miscellaneous 0) Week to Aug 18, 2017: 16 rigs total (Oil 14, Gas 2, Miscellaneous 0) Week to Aug 25, 2017: 17 rigs total (Oil 15, Gas 2, Miscellaneous 0) Week to Sep 1, 2017: 16 rigs total (Oil 14, Gas 2, Miscellaneous 0) Week to Sep 8, 2017: 16 rigs total (Oil 13, Gas 3, Miscellaneous 0) Week to Sep 15, 2017: 17 rigs total (Oil 14, Gas 3, Miscellaneous 0) Week to Sep 22, 2017: 19 rigs total (Oil 15, Gas 4, Miscellaneous 0) Week to Sep 29, 2017: 22 rigs total (Oil 18, Gas 4, Miscellaneous 0) Week to Oct 6, 2017: 22 rigs total (Oil 18, Gas 4, Miscellaneous 0) Week to Oct 13, 2017: 20 rigs total (Oil 17, Gas 3, Miscellaneous 0) Week to Oct 20, 2017: 20 rigs total (Oil 17, Gas 3, Miscellaneous 0) Week to Oct 27, 2017: 20 rigs total (Oil 18, Gas 2, Miscellaneous 0) Week to Nov 3, 2017: 18 rigs total (Oil 16, Gas 2, Miscellaneous 0) Week to Nov 10, 2017: 18 rigs total (Oil 16, Gas 2, Miscellaneous 0) Week to Nov 17, 2017: 21 rigs total (Oil 17, Gas 4, Miscellaneous 0) Week to Nov 22, 2017: 22 rigs total (Oil 18, Gas 4, Miscellaneous 0) Week to Dec 1, 2017: 20 rigs total (Oil 16, Gas 4, Miscellaneous 0) Week to Dec 8, 2017: 20 rigs total (Oil 16, Gas 4, Miscellaneous 0) Week to Dec 15, 2017: 19 rigs total (Oil 15, Gas 4, Miscellaneous 0) Week to Dec 22, 2017: 19 rigs total (Oil 15, Gas 4, Miscellaneous 0) Week to Dec 29, 2017: 18 rigs total (Oil 14, Gas 4, Miscellaneous 0) Week to Jan 5, 2018: 17 rigs total (Oil 14, Gas 3, Miscellaneous 0) Week to Jan 12, 2018: 19 rigs total (Oil 16, Gas 3, Miscellaneous 0) Week to Jan 19, 2018: 19 rigs total (Oil 16, Gas 3, Miscellaneous 0) Week to Jan 26, 2018: 17 rigs total (Oil 15, Gas 2, Miscellaneous 0) Week to Feb 2, 2018: 16 rigs total (Oil 14, Gas 2, Miscellaneous 0) Week to Feb 9, 2018: 16 rigs total (Oil 14, Gas 2, Miscellaneous 0) Week to Feb 16, 2018: 18 rigs total (Oil 16, Gas 2, Miscellaneous 0) Week to Feb 23, 2018: 17 rigs total (Oil 16, Gas 1, Miscellaneous 0) Week to Mar 2, 2018: 14 rigs total (Oil 13, Gas 1, Miscellaneous 0) Week to Mar 9, 2018: 13 rigs total (Oil 12, Gas 1, Miscellaneous 0) Week to Mar 16, 2018: 13 rigs total (Oil 12, Gas 1, Miscellaneous 0) Week to Mar 23, 2018: 13 rigs total (Oil 12, Gas 1, Miscellaneous 0) Week to Mar 29, 2018: 12 rigs total (Oil 12, Gas 0, Miscellaneous 0) Week to Apr 6, 2018: 12 rigs total (Oil 12, Gas 0, Miscellaneous 0) Week to Apr 13, 2018: 16 rigs total (Oil 15, Gas 1, Miscellaneous 0) Week to Apr 20, 2018: 18 rigs total (Oil 17, Gas 1, Miscellaneous 0) Week to Apr 27, 2018: 18 rigs total (Oil 17, Gas 1, Miscellaneous 0) Week to May 4, 2018: 19 rigs total (Oil 18, Gas 1, Miscellaneous 0) Week to May 11, 2018: 20 rigs total (Oil 19, Gas 1, Miscellaneous 0) Week to May 18, 2018: 18 rigs total (Oil 17, Gas 1, Miscellaneous 0) Week to May 25, 2018: 18 rigs total (Oil 15, Gas 3, Miscellaneous 0) Week to Jun 1, 2018: 18 rigs total (Oil 15, Gas 3, Miscellaneous 0) Week to Jun 8, 2018: 19 rigs total (Oil 16, Gas 3, Miscellaneous 0) Week to Jun 15, 2018: 19 rigs total (Oil 16, Gas 3, Miscellaneous 0) Week to Jun 22, 2018: 18 rigs total (Oil 15, Gas 3, Miscellaneous 0) Week to Jun 29, 2018: 18 rigs total (Oil 15, Gas 3, Miscellaneous 0) Week to Jul 6, 2018: 18 rigs total (Oil 15, Gas 3, Miscellaneous 0) Week to Jul 13, 2018: 19 rigs total (Oil 16, Gas 3, Miscellaneous 0) Week to Jul 20, 2018: 17 rigs total (Oil 14, Gas 3, Miscellaneous 0) Week to Jul 27, 2018: 15 rigs total (Oil 13, Gas 2, Miscellaneous 0) Week to Aug 3, 2018: 16 rigs total (Oil 14, Gas 2, Miscellaneous 0) Week to Aug 10, 2018: 18 rigs total (Oil 15, Gas 3, Miscellaneous 0) Week to Aug 17, 2018: 19 rigs total (Oil 16, Gas 3, Miscellaneous 0) Week to Aug 24, 2018: 16 rigs total (Oil 14, Gas 2, Miscellaneous 0) Week to Aug 31, 2018: 16 rigs total (Oil 14, Gas 2, Miscellaneous 0) Week to Sep 7, 2018: 17 rigs total (Oil 15, Gas 2, Miscellaneous 0) Week to Sep 14, 2018: 18 rigs total (Oil 16, Gas 2, Miscellaneous 0) Week to Sep 21, 2018: 18 rigs total (Oil 16, Gas 2, Miscellaneous 0) Week to Sep 28, 2018: 18 rigs total (Oil 16, Gas 2, Miscellaneous 0) Week to Oct 5, 2018: 22 rigs total (Oil 17, Gas 5, Miscellaneous 0) Week to Oct 12, 2018: 22 rigs total (Oil 16, Gas 6, Miscellaneous 0) Week to Oct 19, 2018: 19 rigs total (Oil 13, Gas 6, Miscellaneous 0) Week to Oct 26, 2018: 18 rigs total (Oil 13, Gas 5, Miscellaneous 0) Week to Nov 2, 2018: 18 rigs total (Oil 13, Gas 5, Miscellaneous 0) Week to Nov 9, 2018: 21 rigs total (Oil 16, Gas 5, Miscellaneous 0) Week to Nov 16, 2018: 22 rigs total (Oil 16, Gas 6, Miscellaneous 0) Week to Nov 21, 2018: 25 rigs total (Oil 18, Gas 7, Miscellaneous 0) Week to Nov 30, 2018: 23 rigs total (Oil 18, Gas 5, Miscellaneous 0) Week to Dec 7, 2018: 23 rigs total (Oil 18, Gas 5, Miscellaneous 0) Week to Dec 14, 2018: 23 rigs total (Oil 19, Gas 4, Miscellaneous 0) Week to Dec 21, 2018: 24 rigs total (Oil 20, Gas 4, Miscellaneous 0) Week to Dec 28, 2018: 24 rigs total (Oil 20, Gas 4, Miscellaneous 0) Week to Jan 4, 2019: 22 rigs total (Oil 18, Gas 4, Miscellaneous 0) Week to Jan 11, 2019: 21 rigs total (Oil 17, Gas 4, Miscellaneous 0) Week to Jan 18, 2019: 19 rigs total (Oil 15, Gas 4, Miscellaneous 0) Week to Jan 25, 2019: 20 rigs total (Oil 17, Gas 3, Miscellaneous 0) Week to Feb 1, 2019: 19 rigs total (Oil 15, Gas 4, Miscellaneous 0) Week to Feb 8, 2019: 19 rigs total (Oil 15, Gas 4, Miscellaneous 0) Week to Feb 15, 2019: 21 rigs total (Oil 17, Gas 4, Miscellaneous 0) Week to Feb 22, 2019: 19 rigs total (Oil 15, Gas 4, Miscellaneous 0) Week to Mar 1, 2019: 22 rigs total (Oil 18, Gas 4, Miscellaneous 0) Week to Mar 8, 2019: 22 rigs total (Oil 18, Gas 4, Miscellaneous 0) Week to Mar 15, 2019: 22 rigs total (Oil 18, Gas 4, Miscellaneous 0) Week to Mar 22, 2019: 20 rigs total (Oil 16, Gas 4, Miscellaneous 0) Week to Mar 29, 2019: 23 rigs total (Oil 18, Gas 5, Miscellaneous 0) Week to Apr 5, 2019: 22 rigs total (Oil 19, Gas 3, Miscellaneous 0) Week to Apr 12, 2019: 23 rigs total (Oil 20, Gas 3, Miscellaneous 0) Week to Apr 18, 2019: 23 rigs total (Oil 20, Gas 3, Miscellaneous 0) Week to Apr 26, 2019: 21 rigs total (Oil 18, Gas 3, Miscellaneous 0) Week to May 3, 2019: 20 rigs total (Oil 18, Gas 2, Miscellaneous 0) Week to May 10, 2019: 20 rigs total (Oil 18, Gas 2, Miscellaneous 0) Week to May 17, 2019: 22 rigs total (Oil 19, Gas 3, Miscellaneous 0) Week to May 24, 2019: 22 rigs total (Oil 19, Gas 3, Miscellaneous 0) Week to May 31, 2019: 23 rigs total (Oil 20, Gas 3, Miscellaneous 0) Week to Jun 7, 2019: 23 rigs total (Oil 20, Gas 3, Miscellaneous 0) Week to Jun 14, 2019: 24 rigs total (Oil 22, Gas 2, Miscellaneous 0) Week to Jun 21, 2019: 24 rigs total (Oil 22, Gas 2, Miscellaneous 0) Week to Jun 28, 2019: 26 rigs total (Oil 24, Gas 2, Miscellaneous 0) Week to Jul 3, 2019: 24 rigs total (Oil 22, Gas 2, Miscellaneous 0) Week to Jul 12, 2019: 26 rigs total (Oil 24, Gas 2, Miscellaneous 0) Week to Jul 19, 2019: 25 rigs total (Oil 23, Gas 2, Miscellaneous 0) Week to Jul 26, 2019: 23 rigs total (Oil 21, Gas 2, Miscellaneous 0) Week to Aug 2, 2019: 22 rigs total (Oil 20, Gas 2, Miscellaneous 0) Week to Aug 9, 2019: 23 rigs total (Oil 21, Gas 2, Miscellaneous 0) Week to Aug 16, 2019: 25 rigs total (Oil 23, Gas 2, Miscellaneous 0) Week to Aug 23, 2019: 26 rigs total (Oil 24, Gas 2, Miscellaneous 0) Week to Aug 30, 2019: 26 rigs total (Oil 24, Gas 2, Miscellaneous 0) Week to Sep 6, 2019: 26 rigs total (Oil 24, Gas 2, Miscellaneous 0) Week to Sep 13, 2019: 25 rigs total (Oil 24, Gas 1, Miscellaneous 0) Week to Sep 20, 2019: 23 rigs total (Oil 22, Gas 1, Miscellaneous 0) Week to Sep 27, 2019: 22 rigs total (Oil 21, Gas 1, Miscellaneous 0) Week to Oct 4, 2019: 22 rigs total (Oil 21, Gas 1, Miscellaneous 0) Week to Oct 11, 2019: 23 rigs total (Oil 22, Gas 1, Miscellaneous 0) Week to Oct 18, 2019: 21 rigs total (Oil 20, Gas 1, Miscellaneous 0) Week to Oct 25, 2019: 20 rigs total (Oil 19, Gas 1, Miscellaneous 0) Week to Nov 1, 2019: 21 rigs total (Oil 20, Gas 1, Miscellaneous 0) Week to Nov 8, 2019: 22 rigs total (Oil 21, Gas 1, Miscellaneous 0) Week to Nov 15, 2019: 22 rigs total (Oil 21, Gas 1, Miscellaneous 0) Week to Nov 22, 2019: 22 rigs total (Oil 21, Gas 1, Miscellaneous 0) Week to Nov 27, 2019: 22 rigs total (Oil 21, Gas 1, Miscellaneous 0) Week to Dec 6, 2019: 22 rigs total (Oil 21, Gas 1, Miscellaneous 0) Week to Dec 13, 2019: 23 rigs total (Oil 22, Gas 1, Miscellaneous 0) Week to Dec 20, 2019: 24 rigs total (Oil 23, Gas 1, Miscellaneous 0) Week to Dec 27, 2019: 23 rigs total (Oil 22, Gas 1, Miscellaneous 0) Week to Jan 3, 2020: 22 rigs total (Oil 21, Gas 1, Miscellaneous 0) Week to Jan 10, 2020: 21 rigs total (Oil 20, Gas 1, Miscellaneous 0) Week to Jan 17, 2020: 20 rigs total (Oil 19, Gas 1, Miscellaneous 0) Week to Jan 24, 2020: 21 rigs total (Oil 20, Gas 1, Miscellaneous 0) Week to Jan 31, 2020: 21 rigs total (Oil 20, Gas 1, Miscellaneous 0) Week to Feb 7, 2020: 23 rigs total (Oil 21, Gas 2, Miscellaneous 0) Week to Feb 14, 2020: 23 rigs total (Oil 21, Gas 2, Miscellaneous 0) Week to Feb 21, 2020: 22 rigs total (Oil 20, Gas 2, Miscellaneous 0) Week to Feb 28, 2020: 22 rigs total (Oil 20, Gas 2, Miscellaneous 0) Week to Mar 6, 2020: 23 rigs total (Oil 21, Gas 2, Miscellaneous 0) Week to Mar 13, 2020: 19 rigs total (Oil 18, Gas 1, Miscellaneous 0) Week to Mar 20, 2020: 19 rigs total (Oil 18, Gas 1, Miscellaneous 0) Week to Mar 27, 2020: 18 rigs total (Oil 18, Gas 0, Miscellaneous 0) Week to Apr 3, 2020: 18 rigs total (Oil 18, Gas 0, Miscellaneous 0) Week to Apr 9, 2020: 18 rigs total (Oil 18, Gas 0, Miscellaneous 0) Week to Apr 17, 2020: 17 rigs total (Oil 17, Gas 0, Miscellaneous 0) Week to Apr 24, 2020: 17 rigs total (Oil 17, Gas 0, Miscellaneous 0) Week to May 1, 2020: 16 rigs total (Oil 16, Gas 0, Miscellaneous 0) Week to May 8, 2020: 15 rigs total (Oil 15, Gas 0, Miscellaneous 0) Week to May 15, 2020: 12 rigs total (Oil 12, Gas 0, Miscellaneous 0) Week to May 22, 2020: 12 rigs total (Oil 12, Gas 0, Miscellaneous 0) Week to May 29, 2020: 12 rigs total (Oil 12, Gas 0, Miscellaneous 0) Week to Jun 5, 2020: 13 rigs total (Oil 13, Gas 0, Miscellaneous 0) Week to Jun 12, 2020: 13 rigs total (Oil 13, Gas 0, Miscellaneous 0) Week to Jun 19, 2020: 11 rigs total (Oil 11, Gas 0, Miscellaneous 0) Week to Jun 26, 2020: 11 rigs total (Oil 11, Gas 0, Miscellaneous 0) Week to Jul 2, 2020: 12 rigs total (Oil 12, Gas 0, Miscellaneous 0) Week to Jul 10, 2020: 12 rigs total (Oil 12, Gas 0, Miscellaneous 0) Week to Jul 17, 2020: 12 rigs total (Oil 12, Gas 0, Miscellaneous 0) Week to Jul 24, 2020: 12 rigs total (Oil 12, Gas 0, Miscellaneous 0) Week to Jul 31, 2020: 12 rigs total (Oil 12, Gas 0, Miscellaneous 0) Week to Aug 7, 2020: 12 rigs total (Oil 12, Gas 0, Miscellaneous 0) Week to Aug 14, 2020: 13 rigs total (Oil 13, Gas 0, Miscellaneous 0) Week to Aug 21, 2020: 13 rigs total (Oil 13, Gas 0, Miscellaneous 0) Week to Aug 28, 2020: 13 rigs total (Oil 13, Gas 0, Miscellaneous 0) Week to Sep 4, 2020: 15 rigs total (Oil 15, Gas 0, Miscellaneous 0) Week to Sep 11, 2020: 15 rigs total (Oil 15, Gas 0, Miscellaneous 0) Week to Sep 18, 2020: 14 rigs total (Oil 14, Gas 0, Miscellaneous 0) Week to Sep 25, 2020: 14 rigs total (Oil 14, Gas 0, Miscellaneous 0) Week to Oct 2, 2020: 14 rigs total (Oil 14, Gas 0, Miscellaneous 0) Week to Oct 9, 2020: 14 rigs total (Oil 14, Gas 0, Miscellaneous 0) Week to Oct 16, 2020: 14 rigs total (Oil 14, Gas 0, Miscellaneous 0) Week to Oct 23, 2020: 13 rigs total (Oil 13, Gas 0, Miscellaneous 0) Week to Oct 30, 2020: 13 rigs total (Oil 13, Gas 0, Miscellaneous 0) Week to Nov 6, 2020: 12 rigs total (Oil 12, Gas 0, Miscellaneous 0) Week to Nov 13, 2020: 13 rigs total (Oil 13, Gas 0, Miscellaneous 0) Week to Nov 20, 2020: 12 rigs total (Oil 12, Gas 0, Miscellaneous 0) Week to Nov 25, 2020: 12 rigs total (Oil 12, Gas 0, Miscellaneous 0) Week to Dec 4, 2020: 13 rigs total (Oil 13, Gas 0, Miscellaneous 0) Week to Dec 11, 2020: 13 rigs total (Oil 13, Gas 0, Miscellaneous 0) Week to Dec 18, 2020: 16 rigs total (Oil 16, Gas 0, Miscellaneous 0) Week to Dec 23, 2020: 17 rigs total (Oil 17, Gas 0, Miscellaneous 0) Week to Dec 31, 2020: 17 rigs total (Oil 17, Gas 0, Miscellaneous 0) Week to Jan 8, 2021: 17 rigs total (Oil 17, Gas 0, Miscellaneous 0) Week to Jan 15, 2021: 16 rigs total (Oil 16, Gas 0, Miscellaneous 0) Week to Jan 22, 2021: 16 rigs total (Oil 16, Gas 0, Miscellaneous 0) Week to Jan 29, 2021: 16 rigs total (Oil 16, Gas 0, Miscellaneous 0) Week to Feb 5, 2021: 16 rigs total (Oil 16, Gas 0, Miscellaneous 0) Week to Feb 12, 2021: 17 rigs total (Oil 17, Gas 0, Miscellaneous 0) Week to Feb 19, 2021: 16 rigs total (Oil 16, Gas 0, Miscellaneous 0) Week to Feb 26, 2021: 17 rigs total (Oil 17, Gas 0, Miscellaneous 0) Week to Mar 5, 2021: 14 rigs total (Oil 14, Gas 0, Miscellaneous 0) Week to Mar 12, 2021: 13 rigs total (Oil 13, Gas 0, Miscellaneous 0) Week to Mar 19, 2021: 13 rigs total (Oil 13, Gas 0, Miscellaneous 0) Week to Mar 26, 2021: 12 rigs total (Oil 12, Gas 0, Miscellaneous 0) Week to Apr 1, 2021: 14 rigs total (Oil 14, Gas 0, Miscellaneous 0) Week to Apr 9, 2021: 11 rigs total (Oil 11, Gas 0, Miscellaneous 0) Week to Apr 16, 2021: 12 rigs total (Oil 12, Gas 0, Miscellaneous 0) Week to Apr 23, 2021: 11 rigs total (Oil 11, Gas 0, Miscellaneous 0) Week to Apr 30, 2021: 13 rigs total (Oil 13, Gas 0, Miscellaneous 0) Week to May 7, 2021: 13 rigs total (Oil 13, Gas 0, Miscellaneous 0) Week to May 14, 2021: 15 rigs total (Oil 15, Gas 0, Miscellaneous 0) Week to May 21, 2021: 14 rigs total (Oil 14, Gas 0, Miscellaneous 0) Week to May 28, 2021: 14 rigs total (Oil 14, Gas 0, Miscellaneous 0) Week to Jun 4, 2021: 13 rigs total (Oil 13, Gas 0, Miscellaneous 0) Week to Jun 11, 2021: 13 rigs total (Oil 13, Gas 0, Miscellaneous 0) Week to Jun 18, 2021: 13 rigs total (Oil 13, Gas 0, Miscellaneous 0) Week to Jun 25, 2021: 14 rigs total (Oil 14, Gas 0, Miscellaneous 0) Week to Jul 2, 2021: 14 rigs total (Oil 14, Gas 0, Miscellaneous 0) Week to Jul 9, 2021: 17 rigs total (Oil 17, Gas 0, Miscellaneous 0) Week to Jul 16, 2021: 17 rigs total (Oil 17, Gas 0, Miscellaneous 0) Week to Jul 23, 2021: 17 rigs total (Oil 17, Gas 0, Miscellaneous 0) Week to Jul 30, 2021: 14 rigs total (Oil 14, Gas 0, Miscellaneous 0) Week to Aug 6, 2021: 14 rigs total (Oil 14, Gas 0, Miscellaneous 0) Week to Aug 13, 2021: 13 rigs total (Oil 13, Gas 0, Miscellaneous 0) Week to Aug 20, 2021: 14 rigs total (Oil 14, Gas 0, Miscellaneous 0) Week to Aug 27, 2021: 14 rigs total (Oil 14, Gas 0, Miscellaneous 0) Week to Sep 3, 2021: 0 rigs total (Oil 0, Gas 0, Miscellaneous 0) Week to Sep 10, 2021: 4 rigs total (Oil 4, Gas 0, Miscellaneous 0) Week to Sep 17, 2021: 4 rigs total (Oil 4, Gas 0, Miscellaneous 0) Week to Sep 24, 2021: 8 rigs total (Oil 8, Gas 0, Miscellaneous 0) Week to Oct 1, 2021: 11 rigs total (Oil 11, Gas 0, Miscellaneous 0) Week to Oct 8, 2021: 10 rigs total (Oil 10, Gas 0, Miscellaneous 0) Week to Oct 15, 2021: 12 rigs total (Oil 12, Gas 0, Miscellaneous 0) Week to Oct 22, 2021: 13 rigs total (Oil 13, Gas 0, Miscellaneous 0) Week to Oct 29, 2021: 13 rigs total (Oil 13, Gas 0, Miscellaneous 0) Week to Nov 5, 2021: 13 rigs total (Oil 13, Gas 0, Miscellaneous 0) Week to Nov 12, 2021: 15 rigs total (Oil 15, Gas 0, Miscellaneous 0) Week to Nov 19, 2021: 15 rigs total (Oil 15, Gas 0, Miscellaneous 0) Week to Nov 24, 2021: 15 rigs total (Oil 15, Gas 0, Miscellaneous 0) Week to Dec 3, 2021: 13 rigs total (Oil 13, Gas 0, Miscellaneous 0) Week to Dec 10, 2021: 14 rigs total (Oil 14, Gas 0, Miscellaneous 0) Week to Dec 17, 2021: 15 rigs total (Oil 15, Gas 0, Miscellaneous 0) Week to Dec 23, 2021: 15 rigs total (Oil 15, Gas 0, Miscellaneous 0) Week to Dec 31, 2021: 15 rigs total (Oil 15, Gas 0, Miscellaneous 0) Week to Jan 7, 2022: 16 rigs total (Oil 16, Gas 0, Miscellaneous 0) Week to Jan 14, 2022: 18 rigs total (Oil 18, Gas 0, Miscellaneous 0) Week to Jan 21, 2022: 18 rigs total (Oil 18, Gas 0, Miscellaneous 0) Week to Jan 28, 2022: 18 rigs total (Oil 18, Gas 0, Miscellaneous 0) Week to Feb 4, 2022: 16 rigs total (Oil 16, Gas 0, Miscellaneous 0) Week to Feb 11, 2022: 16 rigs total (Oil 16, Gas 0, Miscellaneous 0) Week to Feb 18, 2022: 12 rigs total (Oil 12, Gas 0, Miscellaneous 0) Week to Feb 25, 2022: 12 rigs total (Oil 12, Gas 0, Miscellaneous 0) Week to Mar 4, 2022: 12 rigs total (Oil 12, Gas 0, Miscellaneous 0) Week to Mar 11, 2022: 11 rigs total (Oil 11, Gas 0, Miscellaneous 0) Week to Mar 18, 2022: 12 rigs total (Oil 12, Gas 0, Miscellaneous 0) Week to Mar 25, 2022: 14 rigs total (Oil 14, Gas 0, Miscellaneous 0) Week to Apr 1, 2022: 14 rigs total (Oil 14, Gas 0, Miscellaneous 0) Week to Apr 8, 2022: 12 rigs total (Oil 12, Gas 0, Miscellaneous 0) Week to Apr 14, 2022: 12 rigs total (Oil 12, Gas 0, Miscellaneous 0) Week to Apr 22, 2022: 12 rigs total (Oil 12, Gas 0, Miscellaneous 0) Week to Apr 29, 2022: 13 rigs total (Oil 13, Gas 0, Miscellaneous 0) Week to May 6, 2022: 16 rigs total (Oil 16, Gas 0, Miscellaneous 0) Week to May 13, 2022: 17 rigs total (Oil 17, Gas 0, Miscellaneous 0) Week to May 20, 2022: 17 rigs total (Oil 17, Gas 0, Miscellaneous 0) Week to May 27, 2022: 15 rigs total (Oil 15, Gas 0, Miscellaneous 0) Week to Jun 3, 2022: 15 rigs total (Oil 15, Gas 0, Miscellaneous 0) Week to Jun 10, 2022: 14 rigs total (Oil 14, Gas 0, Miscellaneous 0) Week to Jun 17, 2022: 15 rigs total (Oil 15, Gas 0, Miscellaneous 0) Week to Jun 24, 2022: 15 rigs total (Oil 15, Gas 0, Miscellaneous 0) Week to Jul 1, 2022: 16 rigs total (Oil 16, Gas 0, Miscellaneous 0) Week to Jul 8, 2022: 16 rigs total (Oil 16, Gas 0, Miscellaneous 0) Week to Jul 15, 2022: 13 rigs total (Oil 13, Gas 0, Miscellaneous 0) Week to Jul 22, 2022: 14 rigs total (Oil 14, Gas 0, Miscellaneous 0) Week to Jul 29, 2022: 15 rigs total (Oil 15, Gas 0, Miscellaneous 0) Week to Aug 5, 2022: 14 rigs total (Oil 14, Gas 0, Miscellaneous 0) Week to Aug 12, 2022: 16 rigs total (Oil 16, Gas 0, Miscellaneous 0) Week to Aug 19, 2022: 16 rigs total (Oil 16, Gas 0, Miscellaneous 0) Week to Aug 26, 2022: 16 rigs total (Oil 16, Gas 0, Miscellaneous 0) Week to Sep 2, 2022: 14 rigs total (Oil 14, Gas 0, Miscellaneous 0) Week to Sep 9, 2022: 13 rigs total (Oil 13, Gas 0, Miscellaneous 0) Week to Sep 16, 2022: 14 rigs total (Oil 14, Gas 0, Miscellaneous 0) Week to Sep 23, 2022: 15 rigs total (Oil 15, Gas 0, Miscellaneous 0) Week to Sep 30, 2022: 15 rigs total (Oil 15, Gas 0, Miscellaneous 0) Week to Oct 7, 2022: 12 rigs total (Oil 12, Gas 0, Miscellaneous 0) Week to Oct 14, 2022: 13 rigs total (Oil 13, Gas 0, Miscellaneous 0) Week to Oct 21, 2022: 14 rigs total (Oil 14, Gas 0, Miscellaneous 0) Week to Oct 28, 2022: 13 rigs total (Oil 13, Gas 0, Miscellaneous 0) Week to Nov 4, 2022: 13 rigs total (Oil 13, Gas 0, Miscellaneous 0) Week to Nov 10, 2022: 16 rigs total (Oil 16, Gas 0, Miscellaneous 0) Week to Nov 18, 2022: 16 rigs total (Oil 16, Gas 0, Miscellaneous 0) Week to Nov 23, 2022: 16 rigs total (Oil 16, Gas 0, Miscellaneous 0) Week to Dec 2, 2022: 17 rigs total (Oil 17, Gas 0, Miscellaneous 0) Week to Dec 9, 2022: 18 rigs total (Oil 18, Gas 0, Miscellaneous 0) Week to Dec 16, 2022: 15 rigs total (Oil 15, Gas 0, Miscellaneous 0) Week to Dec 22, 2022: 15 rigs total (Oil 15, Gas 0, Miscellaneous 0) Week to Dec 30, 2022: 15 rigs total (Oil 15, Gas 0, Miscellaneous 0) Week to Jan 6, 2023: 16 rigs total (Oil 16, Gas 0, Miscellaneous 0) Week to Jan 13, 2023: 19 rigs total (Oil 19, Gas 0, Miscellaneous 0) Week to Jan 20, 2023: 16 rigs total (Oil 16, Gas 0, Miscellaneous 0) Week to Jan 27, 2023: 13 rigs total (Oil 13, Gas 0, Miscellaneous 0) Week to Feb 3, 2023: 12 rigs total (Oil 12, Gas 0, Miscellaneous 0) Week to Feb 10, 2023: 18 rigs total (Oil 18, Gas 0, Miscellaneous 0) Week to Feb 17, 2023: 17 rigs total (Oil 17, Gas 0, Miscellaneous 0) Week to Feb 24, 2023: 17 rigs total (Oil 17, Gas 0, Miscellaneous 0) Week to Mar 3, 2023: 16 rigs total (Oil 16, Gas 0, Miscellaneous 0) Week to Mar 10, 2023: 14 rigs total (Oil 14, Gas 0, Miscellaneous 0) Week to Mar 17, 2023: 16 rigs total (Oil 16, Gas 0, Miscellaneous 0) Week to Mar 24, 2023: 17 rigs total (Oil 17, Gas 0, Miscellaneous 0) Week to Mar 31, 2023: 17 rigs total (Oil 17, Gas 0, Miscellaneous 0) Week to Apr 6, 2023: 16 rigs total (Oil 16, Gas 0, Miscellaneous 0) Week to Apr 14, 2023: 18 rigs total (Oil 18, Gas 0, Miscellaneous 0) Week to Apr 21, 2023: 18 rigs total (Oil 18, Gas 0, Miscellaneous 0) Week to Apr 28, 2023: 19 rigs total (Oil 18, Gas 1, Miscellaneous 0) Week to May 5, 2023: 20 rigs total (Oil 19, Gas 1, Miscellaneous 0) Week to May 12, 2023: 22 rigs total (Oil 21, Gas 1, Miscellaneous 0) Week to May 19, 2023: 21 rigs total (Oil 20, Gas 1, Miscellaneous 0) Week to May 26, 2023: 20 rigs total (Oil 20, Gas 0, Miscellaneous 0) Week to Jun 2, 2023: 20 rigs total (Oil 20, Gas 0, Miscellaneous 0) Week to Jun 9, 2023: 20 rigs total (Oil 20, Gas 0, Miscellaneous 0) Week to Jun 16, 2023: 19 rigs total (Oil 19, Gas 0, Miscellaneous 0) Week to Jun 23, 2023: 18 rigs total (Oil 17, Gas 0, Miscellaneous 1) Week to Jun 30, 2023: 18 rigs total (Oil 18, Gas 0, Miscellaneous 0) Week to Jul 7, 2023: 19 rigs total (Oil 19, Gas 0, Miscellaneous 0) Week to Jul 14, 2023: 18 rigs total (Oil 18, Gas 0, Miscellaneous 0) Week to Jul 21, 2023: 18 rigs total (Oil 17, Gas 0, Miscellaneous 1) Week to Jul 28, 2023: 19 rigs total (Oil 19, Gas 0, Miscellaneous 0) Week to Aug 4, 2023: 18 rigs total (Oil 18, Gas 0, Miscellaneous 0) Week to Aug 11, 2023: 17 rigs total (Oil 17, Gas 0, Miscellaneous 0) Week to Aug 18, 2023: 16 rigs total (Oil 16, Gas 0, Miscellaneous 0) Week to Aug 25, 2023: 15 rigs total (Oil 15, Gas 0, Miscellaneous 0) Week to Sep 1, 2023: 16 rigs total (Oil 16, Gas 0, Miscellaneous 0) Week to Sep 8, 2023: 17 rigs total (Oil 17, Gas 0, Miscellaneous 0) Week to Sep 15, 2023: 17 rigs total (Oil 17, Gas 0, Miscellaneous 0) Week to Sep 22, 2023: 17 rigs total (Oil 17, Gas 0, Miscellaneous 0) Week to Sep 29, 2023: 18 rigs total (Oil 18, Gas 0, Miscellaneous 0) Week to Oct 6, 2023: 18 rigs total (Oil 18, Gas 0, Miscellaneous 0) Week to Oct 13, 2023: 20 rigs total (Oil 20, Gas 0, Miscellaneous 0) Week to Oct 20, 2023: 22 rigs total (Oil 22, Gas 0, Miscellaneous 0) Week to Oct 27, 2023: 22 rigs total (Oil 22, Gas 0, Miscellaneous 0) Week to Nov 3, 2023: 19 rigs total (Oil 19, Gas 0, Miscellaneous 0) Week to Nov 10, 2023: 17 rigs total (Oil 17, Gas 0, Miscellaneous 0) Week to Nov 17, 2023: 17 rigs total (Oil 17, Gas 0, Miscellaneous 0) Week to Nov 22, 2023: 19 rigs total (Oil 18, Gas 0, Miscellaneous 1) Week to Dec 1, 2023: 19 rigs total (Oil 18, Gas 0, Miscellaneous 1) Week to Dec 8, 2023: 19 rigs total (Oil 18, Gas 0, Miscellaneous 1) Week to Dec 15, 2023: 17 rigs total (Oil 17, Gas 0, Miscellaneous 0) Week to Dec 21, 2023: 17 rigs total (Oil 17, Gas 0, Miscellaneous 0) Week to Dec 29, 2023: 18 rigs total (Oil 18, Gas 0, Miscellaneous 0) Week to Jan 5, 2024: 18 rigs total (Oil 18, Gas 0, Miscellaneous 0) Week to Jan 12, 2024: 18 rigs total (Oil 18, Gas 0, Miscellaneous 0) Week to Jan 19, 2024: 18 rigs total (Oil 18, Gas 0, Miscellaneous 0) Week to Jan 26, 2024: 17 rigs total (Oil 17, Gas 0, Miscellaneous 0) Week to Feb 2, 2024: 17 rigs total (Oil 17, Gas 0, Miscellaneous 0) Week to Feb 9, 2024: 19 rigs total (Oil 19, Gas 0, Miscellaneous 0) Week to Feb 16, 2024: 17 rigs total (Oil 17, Gas 0, Miscellaneous 0) Week to Feb 23, 2024: 18 rigs total (Oil 18, Gas 0, Miscellaneous 0) Week to Mar 1, 2024: 19 rigs total (Oil 18, Gas 0, Miscellaneous 1) Week to Mar 8, 2024: 19 rigs total (Oil 19, Gas 0, Miscellaneous 0) Week to Mar 15, 2024: 22 rigs total (Oil 22, Gas 0, Miscellaneous 0) Week to Mar 22, 2024: 21 rigs total (Oil 21, Gas 0, Miscellaneous 0) Week to Mar 28, 2024: 18 rigs total (Oil 18, Gas 0, Miscellaneous 0) Week to Apr 5, 2024: 18 rigs total (Oil 18, Gas 0, Miscellaneous 0) Week to Apr 12, 2024: 17 rigs total (Oil 17, Gas 0, Miscellaneous 0) Week to Apr 19, 2024: 18 rigs total (Oil 18, Gas 0, Miscellaneous 0) Week to Apr 26, 2024: 15 rigs total (Oil 15, Gas 0, Miscellaneous 0) Week to May 3, 2024: 17 rigs total (Oil 15, Gas 0, Miscellaneous 2) Week to May 10, 2024: 18 rigs total (Oil 16, Gas 0, Miscellaneous 2) Week to May 17, 2024: 19 rigs total (Oil 17, Gas 0, Miscellaneous 2) Week to May 24, 2024: 20 rigs total (Oil 18, Gas 0, Miscellaneous 2) Week to May 31, 2024: 21 rigs total (Oil 19, Gas 0, Miscellaneous 2) Week to Jun 7, 2024: 20 rigs total (Oil 18, Gas 0, Miscellaneous 2) Week to Jun 14, 2024: 19 rigs total (Oil 17, Gas 0, Miscellaneous 2) Week to Jun 21, 2024: 19 rigs total (Oil 17, Gas 0, Miscellaneous 2) Week to Jun 28, 2024: 19 rigs total (Oil 17, Gas 0, Miscellaneous 2) Week to Jul 5, 2024: 21 rigs total (Oil 19, Gas 0, Miscellaneous 2) Week to Jul 12, 2024: 21 rigs total (Oil 19, Gas 0, Miscellaneous 2) Week to Jul 19, 2024: 20 rigs total (Oil 18, Gas 0, Miscellaneous 2) Week to Jul 26, 2024: 19 rigs total (Oil 17, Gas 0, Miscellaneous 2) Week to Aug 2, 2024: 18 rigs total (Oil 16, Gas 0, Miscellaneous 2) Week to Aug 9, 2024: 17 rigs total (Oil 15, Gas 0, Miscellaneous 2) Week to Aug 16, 2024: 17 rigs total (Oil 15, Gas 0, Miscellaneous 2) Week to Aug 23, 2024: 17 rigs total (Oil 15, Gas 0, Miscellaneous 2) Week to Aug 30, 2024: 17 rigs total (Oil 15, Gas 0, Miscellaneous 2) Week to Sep 6, 2024: 17 rigs total (Oil 15, Gas 0, Miscellaneous 2) Week to Sep 13, 2024: 19 rigs total (Oil 17, Gas 0, Miscellaneous 2) Week to Sep 20, 2024: 18 rigs total (Oil 17, Gas 0, Miscellaneous 1) Week to Sep 27, 2024: 17 rigs total (Oil 16, Gas 0, Miscellaneous 1) Week to Oct 4, 2024: 16 rigs total (Oil 15, Gas 0, Miscellaneous 1) Week to Oct 11, 2024: 16 rigs total (Oil 15, Gas 0, Miscellaneous 1) Week to Oct 18, 2024: 16 rigs total (Oil 15, Gas 0, Miscellaneous 1) Week to Oct 25, 2024: 14 rigs total (Oil 13, Gas 0, Miscellaneous 1) Week to Nov 1, 2024: 14 rigs total (Oil 13, Gas 0, Miscellaneous 1) Week to Nov 8, 2024: 12 rigs total (Oil 11, Gas 0, Miscellaneous 1) Week to Nov 15, 2024: 12 rigs total (Oil 11, Gas 0, Miscellaneous 1) Week to Nov 22, 2024: 12 rigs total (Oil 11, Gas 0, Miscellaneous 1) Week to Nov 27, 2024: 12 rigs total (Oil 11, Gas 0, Miscellaneous 1) Week to Dec 6, 2024: 13 rigs total (Oil 12, Gas 0, Miscellaneous 1) Week to Dec 13, 2024: 12 rigs total (Oil 11, Gas 0, Miscellaneous 1) Week to Dec 20, 2024: 12 rigs total (Oil 11, Gas 0, Miscellaneous 1) Week to Dec 27, 2024: 12 rigs total (Oil 11, Gas 0, Miscellaneous 1) Week to Jan 3, 2025: 12 rigs total (Oil 11, Gas 0, Miscellaneous 1) Week to Jan 10, 2025: 12 rigs total (Oil 11, Gas 0, Miscellaneous 1) Week to Jan 17, 2025: 12 rigs total (Oil 11, Gas 0, Miscellaneous 1) Week to Jan 24, 2025: 12 rigs total (Oil 11, Gas 0, Miscellaneous 1) Week to Jan 31, 2025: 11 rigs total (Oil 10, Gas 0, Miscellaneous 1) Week to Feb 7, 2025: 12 rigs total (Oil 11, Gas 0, Miscellaneous 1) Week to Feb 14, 2025: 12 rigs total (Oil 11, Gas 0, Miscellaneous 1) Week to Feb 21, 2025: 12 rigs total (Oil 11, Gas 0, Miscellaneous 1) Week to Feb 28, 2025: 11 rigs total (Oil 10, Gas 0, Miscellaneous 1) Week to Mar 7, 2025: 12 rigs total (Oil 11, Gas 0, Miscellaneous 1) Week to Mar 14, 2025: 12 rigs total (Oil 11, Gas 0, Miscellaneous 1) Week to Mar 21, 2025: 12 rigs total (Oil 11, Gas 0, Miscellaneous 1) Week to Mar 28, 2025: 12 rigs total (Oil 11, Gas 0, Miscellaneous 1) Week to Apr 4, 2025: 12 rigs total (Oil 11, Gas 0, Miscellaneous 1) Week to Apr 11, 2025: 11 rigs total (Oil 10, Gas 0, Miscellaneous 1) Week to Apr 17, 2025: 11 rigs total (Oil 10, Gas 0, Miscellaneous 1) Week to Apr 25, 2025: 11 rigs total (Oil 10, Gas 0, Miscellaneous 1) Week to May 2, 2025: 12 rigs total (Oil 11, Gas 0, Miscellaneous 1) Week to May 9, 2025: 9 rigs total (Oil 8, Gas 0, Miscellaneous 1) Week to May 16, 2025: 9 rigs total (Oil 8, Gas 0, Miscellaneous 1) Week to May 23, 2025: 9 rigs total (Oil 8, Gas 0, Miscellaneous 1) Week to May 30, 2025: 9 rigs total (Oil 8, Gas 0, Miscellaneous 1) Week to Jun 6, 2025: 9 rigs total (Oil 8, Gas 0, Miscellaneous 1) Week to Jun 13, 2025: 9 rigs total (Oil 8, Gas 0, Miscellaneous 1) Week to Jun 20, 2025: 10 rigs total (Oil 9, Gas 0, Miscellaneous 1) Week to Jun 27, 2025: 10 rigs total (Oil 9, Gas 0, Miscellaneous 1) Week to Jul 3, 2025: 10 rigs total (Oil 9, Gas 0, Miscellaneous 1) Week to Jul 11, 2025: 10 rigs total (Oil 9, Gas 0, Miscellaneous 1) Week to Jul 18, 2025: 10 rigs total (Oil 9, Gas 0, Miscellaneous 1) Week to Jul 25, 2025: 10 rigs total (Oil 9, Gas 0, Miscellaneous 1) Week to Aug 1, 2025: 10 rigs total (Oil 9, Gas 0, Miscellaneous 1) Week to Aug 8, 2025: 10 rigs total (Oil 9, Gas 0, Miscellaneous 1) Week to Aug 15, 2025: 10 rigs total (Oil 9, Gas 0, Miscellaneous 1) Week to Aug 22, 2025: 10 rigs total (Oil 9, Gas 0, Miscellaneous 1) Week to Aug 29, 2025: 10 rigs total (Oil 9, Gas 0, Miscellaneous 1) Week to Sep 5, 2025: 10 rigs total (Oil 9, Gas 0, Miscellaneous 1) Week to Sep 12, 2025: 10 rigs total (Oil 9, Gas 0, Miscellaneous 1) Week to Sep 19, 2025: 10 rigs total (Oil 9, Gas 0, Miscellaneous 1) Week to Sep 26, 2025: 9 rigs total (Oil 8, Gas 0, Miscellaneous 1) Week to Oct 3, 2025: 10 rigs total (Oil 9, Gas 0, Miscellaneous 1) Week to Oct 10, 2025: 10 rigs total (Oil 9, Gas 0, Miscellaneous 1) Week to Oct 17, 2025: 8 rigs total (Oil 7, Gas 0, Miscellaneous 1) Week to Oct 24, 2025: 12 rigs total (Oil 11, Gas 0, Miscellaneous 1) Week to Oct 31, 2025: 11 rigs total (Oil 10, Gas 0, Miscellaneous 1) Week to Nov 6, 2025: 12 rigs total (Oil 12, Gas 0, Miscellaneous 0) Week to Nov 14, 2025: 12 rigs total (Oil 11, Gas 0, Miscellaneous 1) Week to Nov 21, 2025: 12 rigs total (Oil 11, Gas 0, Miscellaneous 1) Week to Nov 26, 2025: 11 rigs total (Oil 10, Gas 0, Miscellaneous 1) Week to Dec 4, 2025: 12 rigs total (Oil 11, Gas 0, Miscellaneous 1) Week to Dec 12, 2025: 10 rigs total (Oil 9, Gas 0, Miscellaneous 1) Week to Dec 19, 2025: 8 rigs total (Oil 7, Gas 0, Miscellaneous 1) Week to Dec 24, 2025: 9 rigs total (Oil 8, Gas 0, Miscellaneous 1) Week to Dec 30, 2025: 9 rigs total (Oil 8, Gas 0, Miscellaneous 1) Week to Jan 9, 2026: 9 rigs total (Oil 8, Gas 0, Miscellaneous 1) Week to Jan 16, 2026: 9 rigs total (Oil 8, Gas 0, Miscellaneous 1) Week to Jan 23, 2026: 8 rigs total (Oil 7, Gas 0, Miscellaneous 1) Week to Jan 30, 2026: 7 rigs total (Oil 6, Gas 0, Miscellaneous 1) Week to Feb 6, 2026: 10 rigs total (Oil 9, Gas 0, Miscellaneous 1) Week to Feb 13, 2026: 11 rigs total (Oil 10, Gas 0, Miscellaneous 1) Week to Feb 20, 2026: 9 rigs total (Oil 8, Gas 0, Miscellaneous 1) Week to Feb 27, 2026: 8 rigs total (Oil 7, Gas 0, Miscellaneous 1) Week to Mar 6, 2026: 9 rigs total (Oil 8, Gas 0, Miscellaneous 1) Week to Mar 13, 2026: 11 rigs total (Oil 10, Gas 0, Miscellaneous 1) Week to Mar 20, 2026: 11 rigs total (Oil 10, Gas 0, Miscellaneous 1) Week to Mar 27, 2026: 10 rigs total (Oil 9, Gas 0, Miscellaneous 1) Week to Apr 2, 2026: 10 rigs total (Oil 9, Gas 0, Miscellaneous 1) Week to Apr 10, 2026: 13 rigs total (Oil 12, Gas 0, Miscellaneous 1) Week to Apr 17, 2026: 11 rigs total (Oil 10, Gas 0, Miscellaneous 1) Week to Apr 24, 2026: 10 rigs total (Oil 9, Gas 0, Miscellaneous 1) Week to May 1, 2026: 10 rigs total (Oil 9, Gas 0, Miscellaneous 1) Week to May 8, 2026: 9 rigs total (Oil 8, Gas 0, Miscellaneous 1) Week to May 15, 2026: 8 rigs total (Oil 8, Gas 0, Miscellaneous 0) Week to May 22, 2026: 10 rigs total (Oil 10, Gas 0, Miscellaneous 0) Week to May 29, 2026: 9 rigs total (Oil 9, Gas 0, Miscellaneous 0) Week to Jun 5, 2026: 8 rigs total (Oil 8, Gas 0, Miscellaneous 0) Week to Jun 12, 2026: 6 rigs total (Oil 6, Gas 0, Miscellaneous 0) Week to Jun 18, 2026: 7 rigs total (Oil 7, Gas 0, Miscellaneous 0) Week to Jun 26, 2026: 8 rigs total (Oil 8, Gas 0, Miscellaneous 0) Week to Jul 2, 2026: 9 rigs total (Oil 9, Gas 0, Miscellaneous 0) Week to Jul 10, 2026: 12 rigs total (Oil 11, Gas 0, Miscellaneous 1) Week to Jul 17, 2026: 11 rigs total (Oil 10, Gas 0, Miscellaneous 1) Week to Jul 24, 2026: 10 rigs total (Oil 9, Gas 0, Miscellaneous 1) Week to Jul 31, 2026: 11 rigs total (Oil 10, Gas 0, Miscellaneous 1) Week to Aug 7, 2026: 12 rigs total (Oil 11, Gas 0, Miscellaneous 1) Week to Aug 14, 2026: 10 rigs total (Oil 9, Gas 0, Miscellaneous 1) Week to Aug 21, 2026: 8 rigs total (Oil 7, Gas 0, Miscellaneous 1) Week to Aug 28, 2026: 7 rigs total (Oil 6, Gas 0, Miscellaneous 1) Week to Sep 4, 2026: 6 rigs total (Oil 5, Gas 0, Miscellaneous 1) Week to Sep 11, 2026: 6 rigs total (Oil 5, Gas 0, Miscellaneous 1)

Interactive chart. Focus it and use the left and right arrow keys to read each week, Page Up and Page Down to move a year, Home and End for the ends of the series. The full figures are also in the table below.

  • In Gulf of Mexico, 6 drilling rigs were active in the week to September 11, 2026 (4 fewer than a year earlier).
  • Since Sep 2016, the weekly count peaked at 26 in Jun 2019.
  • The count covers offshore rigs in federal waters.
Average active rigs per month: full table
Month Oil-directedGas-directedMiscellaneousAll rigs
Sep 2026 (through September 11, 2026)5016
Aug 20267.6018.6
Jul 2026100111
Jun 20267.6007.6
May 20268.800.29
Apr 2026100111
Mar 20269.20110.2
Feb 20268.5019.5
Jan 20267.2018.2
Dec 20258.6019.6
Nov 20251100.811.8
Oct 20259.20110.2
Sep 20258.8019.8
Aug 202590110
Jul 202590110
Jun 20258.6019.6
May 20258019
Apr 202510.20111.2
Mar 2025110112
Feb 202510.80111.8
Jan 202510.80111.8
Dec 202411.20112.2
Nov 2024110112
Oct 2024140115

Source: CommoVision (commovision.com)

What we cover here

Each row names the grain a region’s production is held at. Where a source publishes at a coarser grain, the page says so.

DataGrainSinceBenchmark
Gulf of Mexico production well 1947-11 ~100% of EIA

Benchmark cells compare our series with the EIA’s published estimates.

About the EIA comparison

The two are produced differently: the EIA estimates from a survey of the largest operators and a model built to anticipate late filings, while the series compared here are rebuilt from the source’s own records as they arrive. Recent months can differ without either being wrong; the methodology page explains both methods.

Coverage rows for Gulf of Mexico are regenerated at every build from the same catalog of sources the data is built from.

How our Gulf of Mexico production compares with the EIA

  • Our Gulf of Mexico oil total is 0.2% above the EIA series over July 2023 to June 2026. Those are the last 36 months our own figures have settled.
  • Our Gulf of Mexico natural gas total is 2.4% above the EIA series over July 2023 to June 2026. Those are the last 36 months our own figures have settled.
Why the two differ

The EIA estimates state totals from an operator survey. The series compared here are rebuilt from the source’s own records as they arrive. Recent months differ while filings are still arriving. Every region, beside the EIA series and why the two differ.

What the data shows

  • Gulf of Mexico produced 711.0 MMbbl of oil and 758.7 Bcf of natural gas in 2025.
  • Gulf of Mexico oil production reached its highest level on record in 2025 at 711.0 MMbbl.
  • 1,901 producing wells tracked, 12 months to Jun 2026.

Get early access

Watch supply move as soon as its sources publish, with forecasts on 1.1+ million producing wells. The portal, an API and MCP access for AI tools open on October 1, 2026.

Data use is subject to our Terms of Service.