CommoVision

See the future in real time

Supply area

Vaca Muerta

The Vaca Muerta footprint produced 216.1 MMbbl of oil and 1.31 Tcf of natural gas in 2025. 10,388 producing wells tracked, trailing 12 months per region.

  • Oil production rose 21% in 2025 from 2024.
Production data through July 2026 · well counts as of 2026-07

A supply area is the producing region we roll every well up to, and the level supply is traded at: how each area is drawn.

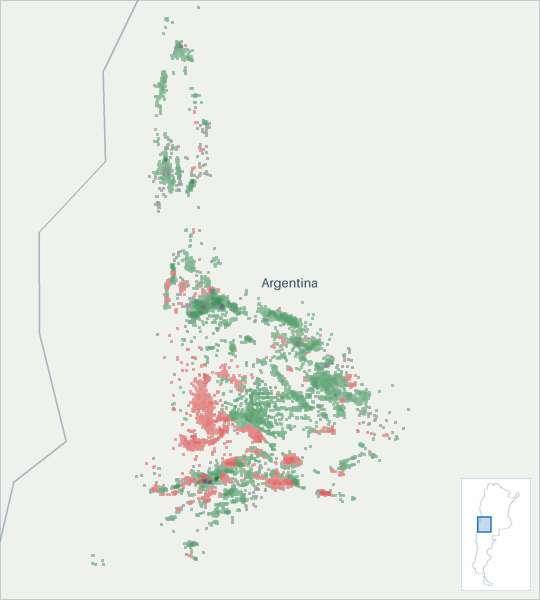
Well map of Vaca Muerta. The full map is further down this page.

Production

Vaca Muerta oil production (Mbbl/d, grouped by when each well first produced)
Vaca Muerta oil production: thousand barrels per day, by first-production vintage as filed so far today 200400600800 Mbbl/d 2017201820192020202120222023202420252026 Aug 2016: 217 Mbbl/d total Sep 2016: 216 Mbbl/d total Oct 2016: 213 Mbbl/d total Nov 2016: 210 Mbbl/d total Dec 2016: 206 Mbbl/d total Jan 2017: 209 Mbbl/d total Feb 2017: 200 Mbbl/d total Mar 2017: 205 Mbbl/d total Apr 2017: 199 Mbbl/d total May 2017: 198 Mbbl/d total Jun 2017: 207 Mbbl/d total Jul 2017: 210 Mbbl/d total Aug 2017: 207 Mbbl/d total Sep 2017: 211 Mbbl/d total Oct 2017: 211 Mbbl/d total Nov 2017: 210 Mbbl/d total Dec 2017: 207 Mbbl/d total Jan 2018: 207 Mbbl/d total Feb 2018: 208 Mbbl/d total Mar 2018: 211 Mbbl/d total Apr 2018: 212 Mbbl/d total May 2018: 210 Mbbl/d total Jun 2018: 211 Mbbl/d total Jul 2018: 210 Mbbl/d total Aug 2018: 219 Mbbl/d total Sep 2018: 221 Mbbl/d total Oct 2018: 223 Mbbl/d total Nov 2018: 224 Mbbl/d total Dec 2018: 225 Mbbl/d total Jan 2019: 203 Mbbl/d total Feb 2019: 228 Mbbl/d total Mar 2019: 224 Mbbl/d total Apr 2019: 232 Mbbl/d total May 2019: 233 Mbbl/d total Jun 2019: 227 Mbbl/d total Jul 2019: 235 Mbbl/d total Aug 2019: 249 Mbbl/d total Sep 2019: 249 Mbbl/d total Oct 2019: 248 Mbbl/d total Nov 2019: 249 Mbbl/d total Dec 2019: 253 Mbbl/d total Jan 2020: 252 Mbbl/d total Feb 2020: 257 Mbbl/d total Mar 2020: 258 Mbbl/d total Apr 2020: 210 Mbbl/d total May 2020: 207 Mbbl/d total Jun 2020: 236 Mbbl/d total Jul 2020: 237 Mbbl/d total Aug 2020: 239 Mbbl/d total Sep 2020: 231 Mbbl/d total Oct 2020: 232 Mbbl/d total Nov 2020: 235 Mbbl/d total Dec 2020: 239 Mbbl/d total Jan 2021: 248 Mbbl/d total Feb 2021: 254 Mbbl/d total Mar 2021: 261 Mbbl/d total Apr 2021: 263 Mbbl/d total May 2021: 264 Mbbl/d total Jun 2021: 268 Mbbl/d total Jul 2021: 280 Mbbl/d total Aug 2021: 275 Mbbl/d total Sep 2021: 288 Mbbl/d total Oct 2021: 305 Mbbl/d total Nov 2021: 314 Mbbl/d total Dec 2021: 320 Mbbl/d total Jan 2022: 331 Mbbl/d total Feb 2022: 328 Mbbl/d total Mar 2022: 333 Mbbl/d total Apr 2022: 339 Mbbl/d total May 2022: 345 Mbbl/d total Jun 2022: 342 Mbbl/d total Jul 2022: 350 Mbbl/d total Aug 2022: 354 Mbbl/d total Sep 2022: 366 Mbbl/d total Oct 2022: 378 Mbbl/d total Nov 2022: 377 Mbbl/d total Dec 2022: 383 Mbbl/d total Jan 2023: 388 Mbbl/d total Feb 2023: 400 Mbbl/d total Mar 2023: 407 Mbbl/d total Apr 2023: 403 Mbbl/d total May 2023: 402 Mbbl/d total Jun 2023: 395 Mbbl/d total Jul 2023: 394 Mbbl/d total Aug 2023: 402 Mbbl/d total Sep 2023: 411 Mbbl/d total Oct 2023: 428 Mbbl/d total Nov 2023: 442 Mbbl/d total Dec 2023: 455 Mbbl/d total Jan 2024: 448 Mbbl/d total Feb 2024: 452 Mbbl/d total Mar 2024: 460 Mbbl/d total Apr 2024: 463 Mbbl/d total May 2024: 466 Mbbl/d total Jun 2024: 473 Mbbl/d total Jul 2024: 485 Mbbl/d total Aug 2024: 504 Mbbl/d total Sep 2024: 487 Mbbl/d total Oct 2024: 520 Mbbl/d total Nov 2024: 535 Mbbl/d total Dec 2024: 543 Mbbl/d total Jan 2025: 538 Mbbl/d total Feb 2025: 537 Mbbl/d total Mar 2025: 540 Mbbl/d total Apr 2025: 535 Mbbl/d total May 2025: 540 Mbbl/d total Jun 2025: 568 Mbbl/d total Jul 2025: 599 Mbbl/d total Aug 2025: 616 Mbbl/d total Sep 2025: 636 Mbbl/d total Oct 2025: 656 Mbbl/d total Nov 2025: 662 Mbbl/d total Dec 2025: 676 Mbbl/d total Jan 2026: 683 Mbbl/d total Feb 2026: 674 Mbbl/d total Mar 2026: 680 Mbbl/d total Apr 2026: 698 Mbbl/d total May 2026: 705 Mbbl/d total Jun 2026: 715 Mbbl/d total Jul 2026: 725 Mbbl/d total Aug 2026: 105 Mbbl/d as filed so far. Filings for this month are still arriving. The chart shows what has been filed.

All from what the source published. All held at well grain.

How the volume breaks down
  • 100% Reported by the official source by well

Every barrel here starts from what the official source published for the months measured. Measured over January 2006 to July 2026.

Vaca Muerta natural gas production (Bcf/d, grouped by when each well first produced)
Vaca Muerta natural gas production: billion cubic feet per day, by first-production vintage as filed so far today 246 Bcf/d 2017201820192020202120222023202420252026 Aug 2016: 2.53 Bcf/d total Sep 2016: 2.52 Bcf/d total Oct 2016: 2.55 Bcf/d total Nov 2016: 2.49 Bcf/d total Dec 2016: 2.5 Bcf/d total Jan 2017: 2.52 Bcf/d total Feb 2017: 2.52 Bcf/d total Mar 2017: 2.5 Bcf/d total Apr 2017: 2.56 Bcf/d total May 2017: 2.55 Bcf/d total Jun 2017: 2.53 Bcf/d total Jul 2017: 2.55 Bcf/d total Aug 2017: 2.56 Bcf/d total Sep 2017: 2.59 Bcf/d total Oct 2017: 2.54 Bcf/d total Nov 2017: 2.43 Bcf/d total Dec 2017: 2.49 Bcf/d total Jan 2018: 2.55 Bcf/d total Feb 2018: 2.64 Bcf/d total Mar 2018: 2.67 Bcf/d total Apr 2018: 2.75 Bcf/d total May 2018: 2.68 Bcf/d total Jun 2018: 2.83 Bcf/d total Jul 2018: 2.81 Bcf/d total Aug 2018: 2.86 Bcf/d total Sep 2018: 2.81 Bcf/d total Oct 2018: 2.84 Bcf/d total Nov 2018: 2.78 Bcf/d total Dec 2018: 2.76 Bcf/d total Jan 2019: 2.71 Bcf/d total Feb 2019: 2.98 Bcf/d total Mar 2019: 2.78 Bcf/d total Apr 2019: 2.85 Bcf/d total May 2019: 2.99 Bcf/d total Jun 2019: 3.09 Bcf/d total Jul 2019: 3.22 Bcf/d total Aug 2019: 3.23 Bcf/d total Sep 2019: 3.04 Bcf/d total Oct 2019: 3.13 Bcf/d total Nov 2019: 2.78 Bcf/d total Dec 2019: 2.79 Bcf/d total Jan 2020: 2.88 Bcf/d total Feb 2020: 2.82 Bcf/d total Mar 2020: 2.76 Bcf/d total Apr 2020: 2.49 Bcf/d total May 2020: 2.66 Bcf/d total Jun 2020: 2.73 Bcf/d total Jul 2020: 2.79 Bcf/d total Aug 2020: 2.78 Bcf/d total Sep 2020: 2.65 Bcf/d total Oct 2020: 2.61 Bcf/d total Nov 2020: 2.44 Bcf/d total Dec 2020: 2.4 Bcf/d total Jan 2021: 2.45 Bcf/d total Feb 2021: 2.42 Bcf/d total Mar 2021: 2.47 Bcf/d total Apr 2021: 2.42 Bcf/d total May 2021: 2.68 Bcf/d total Jun 2021: 2.9 Bcf/d total Jul 2021: 3.02 Bcf/d total Aug 2021: 3.12 Bcf/d total Sep 2021: 3.11 Bcf/d total Oct 2021: 2.97 Bcf/d total Nov 2021: 2.98 Bcf/d total Dec 2021: 3.02 Bcf/d total Jan 2022: 3.08 Bcf/d total Feb 2022: 2.97 Bcf/d total Mar 2022: 3.09 Bcf/d total Apr 2022: 2.99 Bcf/d total May 2022: 3.31 Bcf/d total Jun 2022: 3.41 Bcf/d total Jul 2022: 3.44 Bcf/d total Aug 2022: 3.47 Bcf/d total Sep 2022: 3.29 Bcf/d total Oct 2022: 3.19 Bcf/d total Nov 2022: 2.98 Bcf/d total Dec 2022: 3.06 Bcf/d total Jan 2023: 3.08 Bcf/d total Feb 2023: 3.12 Bcf/d total Mar 2023: 3.09 Bcf/d total Apr 2023: 3.14 Bcf/d total May 2023: 3.31 Bcf/d total Jun 2023: 3.42 Bcf/d total Jul 2023: 3.43 Bcf/d total Aug 2023: 3.65 Bcf/d total Sep 2023: 3.62 Bcf/d total Oct 2023: 3.02 Bcf/d total Nov 2023: 3.1 Bcf/d total Dec 2023: 2.75 Bcf/d total Jan 2024: 3.08 Bcf/d total Feb 2024: 3.35 Bcf/d total Mar 2024: 3.38 Bcf/d total Apr 2024: 3.46 Bcf/d total May 2024: 3.92 Bcf/d total Jun 2024: 3.87 Bcf/d total Jul 2024: 4.04 Bcf/d total Aug 2024: 4.06 Bcf/d total Sep 2024: 3.82 Bcf/d total Oct 2024: 3.28 Bcf/d total Nov 2024: 3.13 Bcf/d total Dec 2024: 3.08 Bcf/d total Jan 2025: 3.43 Bcf/d total Feb 2025: 3.62 Bcf/d total Mar 2025: 3.3 Bcf/d total Apr 2025: 3.39 Bcf/d total May 2025: 3.78 Bcf/d total Jun 2025: 4.15 Bcf/d total Jul 2025: 4.2 Bcf/d total Aug 2025: 4.15 Bcf/d total Sep 2025: 3.53 Bcf/d total Oct 2025: 3.07 Bcf/d total Nov 2025: 3.01 Bcf/d total Dec 2025: 3.35 Bcf/d total Jan 2026: 3.36 Bcf/d total Feb 2026: 3.59 Bcf/d total Mar 2026: 3.71 Bcf/d total Apr 2026: 3.71 Bcf/d total May 2026: 4.21 Bcf/d total Jun 2026: 4.34 Bcf/d total Jul 2026: 4.31 Bcf/d total Aug 2026: 0.68 Bcf/d as filed so far. Filings for this month are still arriving. The chart shows what has been filed.

All from what the source published. All held at well grain.

How the volume breaks down
  • 100% Reported by the official source by well

Every cubic foot here starts from what the official source published for the months measured. Measured over January 2006 to July 2026.

The bands group wells by when they first produced.

About this chart

The stack shows what is holding today's rate up and how much of it is new drilling. The bands draw the filings already in. Wells that had already been drilled when our production record for this area opens are grouped by the year they were drilled rather than the year they first produced: 1% of the volume shown. Their true first production is earlier than our data can see.

Annual table (full history)
YearOil (MMbbl)Gas produced (Bcf)
2025216.11,307
2024178.11,295
2023149.91,178
2022128.61,165
2021101.61,021
202086.4977
201986.01,082
201878.51,003
201775.3923
201678.4917
201580.1868
201479.6820
201381.7800
201283.3843
201187.4888
201092.0918
200995.0952
2008100.71,045
2007100.61,055
200699.01,051

Source: CommoVision (commovision.com)

Monthly table (last 24 months)
MonthOil (Mbbl)Gas produced (MMcf)
2026-0722,467.8133,756
2026-0621,452.5130,258
2026-0521,840.7130,562
2026-0420,945.2111,264
2026-0321,089.3114,911
2026-0218,858.1100,501
2026-0121,166.0104,281
2025-1220,941.6103,832
2025-1119,846.190,381
2025-1020,322.995,058
2025-0919,079.7105,944
2025-0819,091.3128,682
2025-0718,574.8130,196
2025-0617,039.2124,297
2025-0516,754.0117,040
2025-0416,054.1101,551
2025-0316,727.5102,233
2025-0215,025.1101,198
2025-0116,665.3106,401
2024-1216,835.295,448
2024-1116,052.694,014
2024-1016,133.9101,840
2024-0914,599.6114,717
2024-0815,609.2125,753

Source: CommoVision (commovision.com)

Source: CommoVision · Vaca Muerta, data through July 2026.

Well map

A map of 25,993 well locations inside the Vaca Muerta footprint for which CommoVision holds a published surface coordinate, each drawn where it is and colored by its primary product (green for oil, red for natural gas, gray where undetermined; a spot shared by more than one product shows the one with the most wells there), on a ground of land and water over faint country outlines and place names for orientation, with a small inset map locating this frame in Argentina.
  • Oil 15,105
  • Natural gas 5,399
  • Undetermined 5,489
25,993 well locations inside the Vaca Muerta footprint, colored by primary product. 861 more wells we track here sit outside this frame: their source publishes no coordinate, or their location falls beyond its edges.
About this map

Undetermined means not enough signal to settle it. Producing wells are the ones that reported oil or gas in the trailing 12 months per region.

Type curves

Vaca Muerta oil type curves (bbl/d per well, log scale, against months on production; cohorts 2010–2026)
Vaca Muerta oil type curves: average barrels per day per well on a log scale against months on production 2010-2014: 79 wells; starts at 60.8 bbl/d per well, 100 Mbbl cumulative through month 141 (100% of its wells old enough at that month); the dashed curve runs through month 201, on our forecast where a well’s own record ends2015: 67 wells; starts at 74.2 bbl/d per well, 168 Mbbl cumulative through month 128 (100% of its wells old enough at that month); the dashed curve runs through month 188, on our forecast where a well’s own record ends2016: 125 wells; starts at 49.2 bbl/d per well, 234 Mbbl cumulative through month 116 (100% of its wells old enough at that month); the dashed curve runs through month 176, on our forecast where a well’s own record ends2017: 112 wells; starts at 52.2 bbl/d per well, 198 Mbbl cumulative through month 104 (100% of its wells old enough at that month); the dashed curve runs through month 164, on our forecast where a well’s own record ends2018: 206 wells; starts at 70.4 bbl/d per well, 231 Mbbl cumulative through month 92 (100% of its wells old enough at that month); the dashed curve runs through month 152, on our forecast where a well’s own record ends2019: 187 wells; starts at 117 bbl/d per well, 361 Mbbl cumulative through month 80 (100% of its wells old enough at that month); the dashed curve runs through month 140, on our forecast where a well’s own record ends2020: 84 wells; starts at 195 bbl/d per well, 509 Mbbl cumulative through month 68 (100% of its wells old enough at that month); the dashed curve runs through month 128, on our forecast where a well’s own record ends2021: 256 wells; starts at 159 bbl/d per well, 407 Mbbl cumulative through month 56 (100% of its wells old enough at that month); the dashed curve runs through month 116, on our forecast where a well’s own record ends2022: 280 wells; starts at 149 bbl/d per well, 387 Mbbl cumulative through month 44 (100% of its wells old enough at that month); the dashed curve runs through month 104, on our forecast where a well’s own record ends2023: 327 wells; starts at 181 bbl/d per well, 301 Mbbl cumulative through month 32 (100% of its wells old enough at that month); the dashed curve runs through month 92, on our forecast where a well’s own record ends2024: 399 wells; starts at 178 bbl/d per well, 280 Mbbl cumulative through month 20 (100% of its wells old enough at that month); the dashed curve runs through month 80, on our forecast where a well’s own record ends2025: 467 wells; starts at 215 bbl/d per well, 173 Mbbl cumulative through month 8 (100% of its wells old enough at that month); the dashed curve runs through month 68, on our forecast where a well’s own record ends2026: 322 wells; starts at 163 bbl/d per well, 5.0 Mbbl cumulative through month 1 (100% of its wells old enough at that month); the dashed curve runs through month 61, on our forecast where a well’s own record ends51020501002005001,000bbl/d24487296120144168192216Months on production
Vaca Muerta natural gas type curves (Mcf/d per well, log scale, against months on production; cohorts 2010–2026)
Vaca Muerta natural gas type curves: average thousand cubic feet per day per well on a log scale against months on production 2010-2014: 79 wells; starts at 474 Mcf/d per well, 2.1 Bcf cumulative through month 141 (100% of its wells old enough at that month); the dashed curve runs through month 201, on our forecast where a well’s own record ends2015: 67 wells; starts at 196 Mcf/d per well, 1.7 Bcf cumulative through month 128 (100% of its wells old enough at that month); the dashed curve runs through month 188, on our forecast where a well’s own record ends2016: 125 wells; starts at 378 Mcf/d per well, 1.7 Bcf cumulative through month 116 (100% of its wells old enough at that month); the dashed curve runs through month 176, on our forecast where a well’s own record ends2017: 112 wells; starts at 516 Mcf/d per well, 2.5 Bcf cumulative through month 104 (100% of its wells old enough at that month); the dashed curve runs through month 164, on our forecast where a well’s own record ends2018: 206 wells; starts at 1,027 Mcf/d per well, 4.3 Bcf cumulative through month 92 (100% of its wells old enough at that month); the dashed curve runs through month 152, on our forecast where a well’s own record ends2019: 187 wells; starts at 620 Mcf/d per well, 3.0 Bcf cumulative through month 80 (100% of its wells old enough at that month); the dashed curve runs through month 140, on our forecast where a well’s own record ends2020: 84 wells; starts at 465 Mcf/d per well, 1.5 Bcf cumulative through month 68 (100% of its wells old enough at that month); the dashed curve runs through month 128, on our forecast where a well’s own record ends2021: 256 wells; starts at 1,012 Mcf/d per well, 3.0 Bcf cumulative through month 56 (100% of its wells old enough at that month); the dashed curve runs through month 116, on our forecast where a well’s own record ends2022: 280 wells; starts at 918 Mcf/d per well, 2.6 Bcf cumulative through month 44 (100% of its wells old enough at that month); the dashed curve runs through month 104, on our forecast where a well’s own record ends2023: 327 wells; starts at 899 Mcf/d per well, 2.2 Bcf cumulative through month 32 (100% of its wells old enough at that month); the dashed curve runs through month 92, on our forecast where a well’s own record ends2024: 399 wells; starts at 788 Mcf/d per well, 1.2 Bcf cumulative through month 20 (100% of its wells old enough at that month); the dashed curve runs through month 80, on our forecast where a well’s own record ends2025: 467 wells; starts at 563 Mcf/d per well, 0.5 Bcf cumulative through month 8 (100% of its wells old enough at that month); the dashed curve runs through month 68, on our forecast where a well’s own record ends2026: 322 wells; starts at 830 Mcf/d per well, 0.0 Bcf cumulative through month 1 (100% of its wells old enough at that month); the dashed curve runs through month 61, on our forecast where a well’s own record ends501002005001,0002,0005,0007,000Mcf/d24487296120144168192216Months on production

Horizontal wells only. Average production per well, for wells grouped by when they first produced.

How these curves are built

Horizontal wells only: 2,911 of the 8,105 wells in these cohorts. Average daily production per well, for wells grouped by when they first produced. Includes every well of the cohort that is old enough at each month. Wells that are shut in or have stopped producing count as zero, so the average reflects the full cohort, not just survivors. Rates are calendar-day (volume ÷ days in month). The cumulative axis accumulates those same monthly averages at the average month length. Months not yet fully reported are excluded. The 2010-2014 curve draws those years as one group. The chart opens on average daily rate against months on production, the rate on a log scale. The view control switches to rate against cumulative production per well, on the same log rate scale, or to cumulative production per well against months on production, on a linear scale. Every view draws the same cohorts from the same production history. Each cohort is solid through the last month all of its wells sit inside fully reported data. Past it the dashed curve carries the same wells forward, on our forecast where a well’s own record ends, for up to five years. A dashed curve runs as far as at least nine in ten of its wells are accounted for. A well that is old enough but shut in still counts, as zero. The measured months are what these wells reported. In the forward months each well counts its own reported figure for each month it has one, our forecast for each month it has only that, and zero for the rest. The forward average counts every well of the cohort. The drawn forecast runs up to five years past the measured months. Line thickness tracks the size of each cohort. 10 wells are counted here but not shown on the age axis: they started producing in 2008 or earlier, too close to the start of our records for their region to verify their true age.

Cohort summary table
First produced Wells Peak oil (bbl/d per well) Month-12 oil (bbl/d per well) Cum oil in series (Mbbl per well) Peak gas (Mcf/d per well) Month-12 gas (Mcf/d per well) Cum gas in series (Bcf per well) Months in series Wells old enough at last month in series Forecast months drawn
2026 322 163 5.0 830 0.0 1 100% 60
2025 467 990 173 2,762 0.5 8 100% 60
2024 399 866 376 280 3,159 1,728 1.2 20 100% 60
2023 327 732 288 301 3,663 2,129 2.2 32 100% 60
2022 280 775 369 387 4,186 2,699 2.6 44 100% 60
2021 256 750 338 407 4,566 2,644 3.0 56 100% 60
2020 84 765 407 509 1,863 1,370 1.5 68 100% 60
2019 187 521 249 361 3,305 2,625 3.0 80 100% 60
2018 206 313 158 231 5,132 2,945 4.3 92 100% 60
2017 112 270 138 198 2,584 2,134 2.5 104 100% 60
2016 125 266 148 234 1,870 1,132 1.7 116 100% 60
2015 67 256 81 168 1,911 1,244 1.7 128 100% 60
2010-2014 79 128 54.6 100 1,709 1,249 2.1 141 100% 60

Source: CommoVision (commovision.com)

Source: CommoVision · Vaca Muerta type curves, per-well production by first-production cohort.

Top operators in Vaca Muerta, 2025

  1. YPF S.A. 45.8%
  2. Vista Energy 8.6%
  3. Pluspetrol S.A. 8.4%
  4. Tecpetrol S.A. 7.0%
  5. Pan American Energy 6.2%
  6. Pampa Energía S.A. 4.6%
  7. TotalEnergies Austral S.A. 4.3%
  8. Shell 3.8%
  9. Chevron 2.1%
  10. Pluspetrol Cuenca Neuquina S.R.L. 1.7%
  11. 26 other operators 7.4%
Top operators in Vaca Muerta, 2025: full table
OperatorOil (Mbbl/d, 2025)Gas produced (MMcf/d, 2025)Share of output
YPF S.A. 310.11,056.345.8%
Vista Energy 68.944.68.6%
Pluspetrol S.A. 44.0382.88.4%
Tecpetrol S.A. 17.6601.57.0%
Pan American Energy 30.6317.96.2%
Pampa Energía S.A. 9.6434.54.6%
TotalEnergies Austral S.A. 5.2457.34.3%
Shell 30.125.03.8%
Chevron 15.135.72.1%
Pluspetrol Cuenca Neuquina S.R.L. (February to December) 13.137.51.7%
26 other operators 48.9190.27.4%

Mbbl/d = thousand barrels per day · MMcf/d = million cubic feet per day (units).

Source: CommoVision (commovision.com)

Key numbers

724.8 Mbbl/d Jul 2026 oil production +21% vs Jul last year
4.31 Bcf/d Jul 2026 gas production +2.7% vs Jul last year
592.1 Mbbl/d 2025 oil production
3.58 Bcf/d 2025 gas production
3,442 wells Rock-evidenced wells formation evidence
26,854 wells Wells in the total footprint all formations & trajectories
10,388 wells Producing wells tracked trailing 12 months per region
Two ways to count these wells

Well counts are shown on two independent bases: rock-evidenced (a formation assignment backed by formation evidence on the well’s own record: the operator’s filing, its directional survey, or a published stratigraphic pick) alongside the total footprint (every well inside the area’s footprint definition). The two overlap heavily, but neither contains the other: rock evidence follows the formation wherever it was drilled, including outside the footprint. See the methodology for why we don’t infer play membership.

What we cover here

Each row names the grain a region’s production is held at. Where a source publishes at a coarser grain, the page says so.

DataGrainSinceBenchmark
Argentina production well 2006-01

Coverage rows for Vaca Muerta are regenerated at every build from the same catalog of sources the data is built from.

What the data shows

  • The Vaca Muerta footprint produced 216.1 MMbbl of oil and 1.31 Tcf of natural gas in 2025.
  • Oil production in the Vaca Muerta footprint reached its highest level on record in 2025 at 216.1 MMbbl.
  • 3,442 wells carry a rock-evidenced Vaca Muerta formation assignment (a rock lens). The footprint is a separate geographic lens holding 26,854 wells of all formations and trajectories; the two overlap heavily but neither contains the other.
  • 10,388 producing wells tracked, trailing 12 months per region.

Get early access

Watch supply move as soon as its sources publish, with forecasts on 1.1+ million producing wells. The portal, an API and MCP access for AI tools open on October 1, 2026.

Data use is subject to our Terms of Service.