CommoVision

See the future in real time

Argentina

Argentina produced 293.3 MMbbl of oil and 1.82 Tcf of natural gas in 2025. 25,417 producing wells tracked, 12 months to Aug 2026.

  • Sixth-largest oil-producing country in the Americas, 2025.
  • 2.9% of the oil produced in the Americas, 2025.
  • Oil production rose 13% in 2025 from 2024.
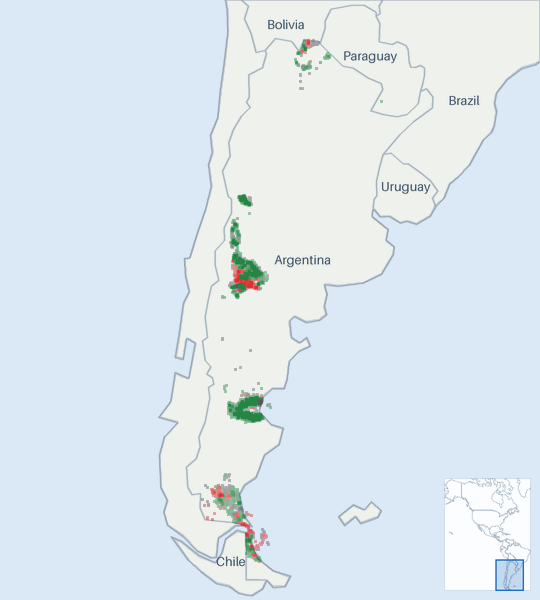
Well map of Argentina. The full map is further down this page.

Production

Argentina oil production (Mbbl/d, grouped by when each well first produced)
  • filling in (est. · unconfirmed) . Hatching marks our estimate of the volume still to be filed. That estimate draws on our own production forecast. This estimate is published unconfirmed. It updates as filings arrive
Argentina oil production: thousand barrels per day, by first-production vintage as filed so far today 2505007501,000 Mbbl/d 2017201820192020202120222023202420252026 Aug 2016: 518 Mbbl/d total Sep 2016: 521 Mbbl/d total Oct 2016: 519 Mbbl/d total Nov 2016: 509 Mbbl/d total Dec 2016: 502 Mbbl/d total Jan 2017: 505 Mbbl/d total Feb 2017: 494 Mbbl/d total Mar 2017: 495 Mbbl/d total Apr 2017: 463 Mbbl/d total May 2017: 478 Mbbl/d total Jun 2017: 470 Mbbl/d total Jul 2017: 482 Mbbl/d total Aug 2017: 487 Mbbl/d total Sep 2017: 493 Mbbl/d total Oct 2017: 499 Mbbl/d total Nov 2017: 498 Mbbl/d total Dec 2017: 495 Mbbl/d total Jan 2018: 490 Mbbl/d total Feb 2018: 491 Mbbl/d total Mar 2018: 496 Mbbl/d total Apr 2018: 495 Mbbl/d total May 2018: 492 Mbbl/d total Jun 2018: 491 Mbbl/d total Jul 2018: 490 Mbbl/d total Aug 2018: 501 Mbbl/d total Sep 2018: 508 Mbbl/d total Oct 2018: 509 Mbbl/d total Nov 2018: 507 Mbbl/d total Dec 2018: 509 Mbbl/d total Jan 2019: 485 Mbbl/d total Feb 2019: 512 Mbbl/d total Mar 2019: 510 Mbbl/d total Apr 2019: 518 Mbbl/d total May 2019: 516 Mbbl/d total Jun 2019: 508 Mbbl/d total Jul 2019: 515 Mbbl/d total Aug 2019: 530 Mbbl/d total Sep 2019: 528 Mbbl/d total Oct 2019: 525 Mbbl/d total Nov 2019: 524 Mbbl/d total Dec 2019: 528 Mbbl/d total Jan 2020: 524 Mbbl/d total Feb 2020: 527 Mbbl/d total Mar 2020: 529 Mbbl/d total Apr 2020: 470 Mbbl/d total May 2020: 457 Mbbl/d total Jun 2020: 483 Mbbl/d total Jul 2020: 479 Mbbl/d total Aug 2020: 482 Mbbl/d total Sep 2020: 480 Mbbl/d total Oct 2020: 483 Mbbl/d total Nov 2020: 484 Mbbl/d total Dec 2020: 489 Mbbl/d total Jan 2021: 496 Mbbl/d total Feb 2021: 502 Mbbl/d total Mar 2021: 506 Mbbl/d total Apr 2021: 512 Mbbl/d total May 2021: 513 Mbbl/d total Jun 2021: 512 Mbbl/d total Jul 2021: 522 Mbbl/d total Aug 2021: 519 Mbbl/d total Sep 2021: 534 Mbbl/d total Oct 2021: 544 Mbbl/d total Nov 2021: 558 Mbbl/d total Dec 2021: 560 Mbbl/d total Jan 2022: 570 Mbbl/d total Feb 2022: 569 Mbbl/d total Mar 2022: 572 Mbbl/d total Apr 2022: 578 Mbbl/d total May 2022: 586 Mbbl/d total Jun 2022: 583 Mbbl/d total Jul 2022: 588 Mbbl/d total Aug 2022: 593 Mbbl/d total Sep 2022: 603 Mbbl/d total Oct 2022: 619 Mbbl/d total Nov 2022: 618 Mbbl/d total Dec 2022: 622 Mbbl/d total Jan 2023: 627 Mbbl/d total Feb 2023: 638 Mbbl/d total Mar 2023: 642 Mbbl/d total Apr 2023: 638 Mbbl/d total May 2023: 637 Mbbl/d total Jun 2023: 630 Mbbl/d total Jul 2023: 626 Mbbl/d total Aug 2023: 631 Mbbl/d total Sep 2023: 646 Mbbl/d total Oct 2023: 662 Mbbl/d total Nov 2023: 675 Mbbl/d total Dec 2023: 687 Mbbl/d total Jan 2024: 680 Mbbl/d total Feb 2024: 681 Mbbl/d total Mar 2024: 689 Mbbl/d total Apr 2024: 691 Mbbl/d total May 2024: 693 Mbbl/d total Jun 2024: 670 Mbbl/d total Jul 2024: 685 Mbbl/d total Aug 2024: 719 Mbbl/d total Sep 2024: 708 Mbbl/d total Oct 2024: 744 Mbbl/d total Nov 2024: 759 Mbbl/d total Dec 2024: 766 Mbbl/d total Jan 2025: 757 Mbbl/d total Feb 2025: 755 Mbbl/d total Mar 2025: 758 Mbbl/d total Apr 2025: 751 Mbbl/d total May 2025: 756 Mbbl/d total Jun 2025: 782 Mbbl/d total Jul 2025: 811 Mbbl/d total Aug 2025: 826 Mbbl/d total Sep 2025: 843 Mbbl/d total Oct 2025: 860 Mbbl/d total Nov 2025: 859 Mbbl/d total Dec 2025: 879 Mbbl/d total Jan 2026: 885 Mbbl/d total Feb 2026: 876 Mbbl/d total Mar 2026: 880 Mbbl/d total Apr 2026: 895 Mbbl/d total May 2026: 904 Mbbl/d total Jun 2026: 913 Mbbl/d total Jul 2026: ≈933 Mbbl/d total (98% arrived, remainder estimated) Aug 2026: 939 Mbbl/d as filed so far. Filings for this month are still arriving. The chart shows what has been filed. Sep 2026: 678 Mbbl/d as filed so far. Filings for this month are still arriving. The chart shows what has been filed.

Still arriving: Oct 2026 <1% filed.

All from what the source published. All held at well grain.

How the volume breaks down
  • 100% Reported by the official source by well

Every barrel through June 2026 starts from what the official source published for those months. Measured over January 2006 to June 2026.

Argentina natural gas production (Bcf/d, grouped by when each well first produced)
  • filling in (est. · missed) . Hatching marks our estimate of the volume still to be filed. That estimate draws on our own production forecast. A check on the forecast behind this estimate measured a miss. It updates as filings arrive
Argentina natural gas production: billion cubic feet per day, by first-production vintage as filed so far today 246 Bcf/d 2017201820192020202120222023202420252026 Aug 2016: 4.41 Bcf/d total Sep 2016: 4.38 Bcf/d total Oct 2016: 4.4 Bcf/d total Nov 2016: 4.28 Bcf/d total Dec 2016: 4.29 Bcf/d total Jan 2017: 4.35 Bcf/d total Feb 2017: 4.13 Bcf/d total Mar 2017: 4.32 Bcf/d total Apr 2017: 4.35 Bcf/d total May 2017: 4.31 Bcf/d total Jun 2017: 4.32 Bcf/d total Jul 2017: 4.36 Bcf/d total Aug 2017: 4.37 Bcf/d total Sep 2017: 4.39 Bcf/d total Oct 2017: 4.38 Bcf/d total Nov 2017: 4.19 Bcf/d total Dec 2017: 4.32 Bcf/d total Jan 2018: 4.38 Bcf/d total Feb 2018: 4.41 Bcf/d total Mar 2018: 4.45 Bcf/d total Apr 2018: 4.56 Bcf/d total May 2018: 4.49 Bcf/d total Jun 2018: 4.67 Bcf/d total Jul 2018: 4.66 Bcf/d total Aug 2018: 4.73 Bcf/d total Sep 2018: 4.65 Bcf/d total Oct 2018: 4.68 Bcf/d total Nov 2018: 4.35 Bcf/d total Dec 2018: 4.55 Bcf/d total Jan 2019: 4.46 Bcf/d total Feb 2019: 4.76 Bcf/d total Mar 2019: 4.57 Bcf/d total Apr 2019: 4.65 Bcf/d total May 2019: 4.84 Bcf/d total Jun 2019: 4.94 Bcf/d total Jul 2019: 5.1 Bcf/d total Aug 2019: 5.1 Bcf/d total Sep 2019: 4.87 Bcf/d total Oct 2019: 4.94 Bcf/d total Nov 2019: 4.49 Bcf/d total Dec 2019: 4.48 Bcf/d total Jan 2020: 4.6 Bcf/d total Feb 2020: 4.51 Bcf/d total Mar 2020: 4.47 Bcf/d total Apr 2020: 4.12 Bcf/d total May 2020: 4.4 Bcf/d total Jun 2020: 4.45 Bcf/d total Jul 2020: 4.48 Bcf/d total Aug 2020: 4.44 Bcf/d total Sep 2020: 4.34 Bcf/d total Oct 2020: 4.3 Bcf/d total Nov 2020: 4.09 Bcf/d total Dec 2020: 4.02 Bcf/d total Jan 2021: 4.1 Bcf/d total Feb 2021: 4.05 Bcf/d total Mar 2021: 4.05 Bcf/d total Apr 2021: 4.04 Bcf/d total May 2021: 4.28 Bcf/d total Jun 2021: 4.49 Bcf/d total Jul 2021: 4.62 Bcf/d total Aug 2021: 4.72 Bcf/d total Sep 2021: 4.69 Bcf/d total Oct 2021: 4.49 Bcf/d total Nov 2021: 4.52 Bcf/d total Dec 2021: 4.55 Bcf/d total Jan 2022: 4.59 Bcf/d total Feb 2022: 4.5 Bcf/d total Mar 2022: 4.43 Bcf/d total Apr 2022: 4.5 Bcf/d total May 2022: 4.81 Bcf/d total Jun 2022: 4.93 Bcf/d total Jul 2022: 4.95 Bcf/d total Aug 2022: 5 Bcf/d total Sep 2022: 4.81 Bcf/d total Oct 2022: 4.69 Bcf/d total Nov 2022: 4.47 Bcf/d total Dec 2022: 4.55 Bcf/d total Jan 2023: 4.55 Bcf/d total Feb 2023: 4.59 Bcf/d total Mar 2023: 4.55 Bcf/d total Apr 2023: 4.55 Bcf/d total May 2023: 4.77 Bcf/d total Jun 2023: 4.88 Bcf/d total Jul 2023: 4.88 Bcf/d total Aug 2023: 5.1 Bcf/d total Sep 2023: 5.06 Bcf/d total Oct 2023: 4.45 Bcf/d total Nov 2023: 4.46 Bcf/d total Dec 2023: 4.03 Bcf/d total Jan 2024: 4.37 Bcf/d total Feb 2024: 4.74 Bcf/d total Mar 2024: 4.76 Bcf/d total Apr 2024: 4.81 Bcf/d total May 2024: 5.3 Bcf/d total Jun 2024: 5.21 Bcf/d total Jul 2024: 5.36 Bcf/d total Aug 2024: 5.41 Bcf/d total Sep 2024: 5.18 Bcf/d total Oct 2024: 4.7 Bcf/d total Nov 2024: 4.49 Bcf/d total Dec 2024: 4.4 Bcf/d total Jan 2025: 4.89 Bcf/d total Feb 2025: 5.11 Bcf/d total Mar 2025: 4.73 Bcf/d total Apr 2025: 4.83 Bcf/d total May 2025: 5.22 Bcf/d total Jun 2025: 5.63 Bcf/d total Jul 2025: 5.68 Bcf/d total Aug 2025: 5.58 Bcf/d total Sep 2025: 4.9 Bcf/d total Oct 2025: 4.38 Bcf/d total Nov 2025: 4.32 Bcf/d total Dec 2025: 4.65 Bcf/d total Jan 2026: 4.65 Bcf/d total Feb 2026: 4.95 Bcf/d total Mar 2026: 5.01 Bcf/d total Apr 2026: 4.97 Bcf/d total May 2026: 5.53 Bcf/d total Jun 2026: 5.63 Bcf/d total Jul 2026: ≈5.72 Bcf/d total (98% arrived, remainder estimated) Aug 2026: 5.48 Bcf/d as filed so far. Filings for this month are still arriving. The chart shows what has been filed. Sep 2026: 2.39 Bcf/d as filed so far. Filings for this month are still arriving. The chart shows what has been filed.

Still arriving: Oct 2026 <1% filed.

All from what the source published. All held at well grain.

How the volume breaks down
  • 100% Reported by the official source by well

Every cubic foot through June 2026 starts from what the official source published for those months. Measured over January 2006 to June 2026.

The bands group wells by when they first produced.

About this chart

The stack shows what is holding today's rate up and how much of it is new drilling. In the reported months the bands draw the filings already in. The months still filling in are marked.

Annual table (full history)
YearOil (MMbbl)Gas produced (Bcf)
2025293.31,822
2024258.81,791
2023235.31,699
2022216.11,710
2021191.01,600
2020179.51,593
2019188.61,740
2018181.91,660
2017178.21,576
2016189.81,589
2015196.71,511
2014196.91,465
2013199.71,473
2012203.61,558
2011204.71,608
2010217.51,664
2009222.51,710
2008225.81,788
2007227.41,788
2006234.61,832

Source: CommoVision (commovision.com)

Monthly table (last 24 months)
MonthOil (Mbbl)Gas produced (MMcf)
2026-0829,122.1169,750
2026-0728,460.3173,111
2026-0627,394.0168,766
2026-0528,023.4171,475
2026-0426,863.4148,988
2026-0327,266.2155,273
2026-0224,524.5138,563
2026-0127,426.0144,152
2025-1227,246.8144,216
2025-1125,779.9129,480
2025-1026,671.7135,723
2025-0925,300.3146,888
2025-0825,596.1173,080
2025-0725,142.2175,995
2025-0623,445.8168,823
2025-0523,425.7161,674
2025-0422,534.0144,848
2025-0323,497.3146,483
2025-0221,136.5143,183
2025-0123,474.0151,649
2024-1223,746.1136,279
2024-1122,781.3134,737
2024-1023,055.3145,782
2024-0921,239.9155,398

Source: CommoVision (commovision.com)

Source: CommoVision · Argentina, data through July 2026.

Well map

A map of 77,724 well locations in Argentina for which CommoVision holds a published surface coordinate, each drawn where it is and colored by its primary product (green for oil, red for natural gas, gray where undetermined; a spot shared by more than one product shows the one with the most wells there), on a ground of land and water over faint country outlines and place names for orientation, with a small inset map locating this frame in the Americas.
  • Oil 55,206
  • Natural gas 9,159
  • Undetermined 13,359
77,724 well locations in Argentina, colored by primary product.
About this map

Undetermined means not enough signal to settle it. Producing wells are the ones that reported oil or gas in the 12 months to Aug 2026.

932.9 Mbbl/d (est.) Jul 2026 oil production Jul 2026 is still filling in. The figure is the filings already in plus an estimate of the part not yet filed. The change compares this estimate with the same month last year. +15% vs Jul last year
5.71 Bcf/d (est.) Jul 2026 gas production Jul 2026 is still filling in. The figure is the filings already in plus an estimate of the part not yet filed. The change compares this estimate with the same month last year. +0.7% vs Jul last year
803.4 Mbbl/d 2025 oil production
4.99 Bcf/d 2025 gas production
25,417 wells Producing wells tracked 12 months to Aug 2026

Type curves

Argentina oil type curves (bbl/d per well, log scale, against months on production; cohorts 2010–2026)
Argentina oil type curves: average barrels per day per well on a log scale against months on production 2010-2014: 6,808 wells in curve; starts at 42.5 bbl/d per well, 80.8 Mbbl cumulative through month 141 (100% of its wells old enough at that month); the dashed curve runs through month 201, on our forecast where a well’s own record ends2015: 1,574 wells in curve; starts at 36 bbl/d per well, 72.4 Mbbl cumulative through month 129 (100% of its wells old enough at that month); the dashed curve runs through month 189, on our forecast where a well’s own record ends2016: 1,138 wells in curve; starts at 28.6 bbl/d per well, 82.1 Mbbl cumulative through month 117 (100% of its wells old enough at that month); the dashed curve runs through month 177, on our forecast where a well’s own record ends2017: 995 wells in curve; starts at 38.9 bbl/d per well, 81.8 Mbbl cumulative through month 105 (100% of its wells old enough at that month); the dashed curve runs through month 165, on our forecast where a well’s own record ends2018: 969 wells in curve; starts at 50.8 bbl/d per well, 102 Mbbl cumulative through month 93 (100% of its wells old enough at that month); the dashed curve runs through month 153, on our forecast where a well’s own record ends2019: 887 wells in curve; starts at 60.2 bbl/d per well, 130 Mbbl cumulative through month 81 (100% of its wells old enough at that month); the dashed curve runs through month 141, on our forecast where a well’s own record ends2020: 384 wells in curve; starts at 77.3 bbl/d per well, 163 Mbbl cumulative through month 69 (100% of its wells old enough at that month); the dashed curve runs through month 129, on our forecast where a well’s own record ends2021: 679 wells in curve; starts at 85 bbl/d per well, 188 Mbbl cumulative through month 57 (100% of its wells old enough at that month); the dashed curve runs through month 117, on our forecast where a well’s own record ends2022: 810 wells in curve; starts at 79.7 bbl/d per well, 165 Mbbl cumulative through month 45 (100% of its wells old enough at that month); the dashed curve runs through month 105, on our forecast where a well’s own record ends2023: 852 wells in curve; starts at 94.8 bbl/d per well, 139 Mbbl cumulative through month 33 (100% of its wells old enough at that month); the dashed curve runs through month 93, on our forecast where a well’s own record ends2024: 801 wells in curve; starts at 111 bbl/d per well, 161 Mbbl cumulative through month 21 (100% of its wells old enough at that month); the dashed curve runs through month 81, on our forecast where a well’s own record ends2025: 707 wells in curve; starts at 157 bbl/d per well, 132 Mbbl cumulative through month 9 (100% of its wells old enough at that month); the dashed curve runs through month 69, on our forecast where a well’s own record ends2026: 506 wells in curve; starts at 140 bbl/d per well, 4.2 Mbbl cumulative through month 1 (100% of its wells old enough at that month); the dashed curve runs through month 61, on our forecast where a well’s own record ends51020501002005001,000bbl/d24487296120144168192216Months on production
Argentina natural gas type curves (Mcf/d per well, log scale, against months on production; cohorts 2010–2026)
Argentina natural gas type curves: average thousand cubic feet per day per well on a log scale against months on production 2010-2014: 6,808 wells in curve; starts at 187 Mcf/d per well, 0.5 Bcf cumulative through month 141 (100% of its wells old enough at that month); the dashed curve runs through month 201, on our forecast where a well’s own record ends2015: 1,574 wells in curve; starts at 314 Mcf/d per well, 1.0 Bcf cumulative through month 129 (100% of its wells old enough at that month); the dashed curve runs through month 189, on our forecast where a well’s own record ends2016: 1,138 wells in curve; starts at 331 Mcf/d per well, 1.2 Bcf cumulative through month 117 (100% of its wells old enough at that month); the dashed curve runs through month 177, on our forecast where a well’s own record ends2017: 995 wells in curve; starts at 388 Mcf/d per well, 0.8 Bcf cumulative through month 105 (100% of its wells old enough at that month); the dashed curve runs through month 165, on our forecast where a well’s own record ends2018: 969 wells in curve; starts at 529 Mcf/d per well, 1.5 Bcf cumulative through month 93 (100% of its wells old enough at that month); the dashed curve runs through month 153, on our forecast where a well’s own record ends2019: 887 wells in curve; starts at 317 Mcf/d per well, 0.9 Bcf cumulative through month 81 (100% of its wells old enough at that month); the dashed curve runs through month 141, on our forecast where a well’s own record ends2020: 384 wells in curve; starts at 185 Mcf/d per well, 0.5 Bcf cumulative through month 69 (100% of its wells old enough at that month); the dashed curve runs through month 129, on our forecast where a well’s own record ends2021: 679 wells in curve; starts at 719 Mcf/d per well, 1.6 Bcf cumulative through month 57 (100% of its wells old enough at that month); the dashed curve runs through month 117, on our forecast where a well’s own record ends2022: 810 wells in curve; starts at 517 Mcf/d per well, 1.2 Bcf cumulative through month 45 (100% of its wells old enough at that month); the dashed curve runs through month 105, on our forecast where a well’s own record ends2023: 852 wells in curve; starts at 516 Mcf/d per well, 1.0 Bcf cumulative through month 33 (100% of its wells old enough at that month); the dashed curve runs through month 93, on our forecast where a well’s own record ends2024: 801 wells in curve; starts at 732 Mcf/d per well, 0.9 Bcf cumulative through month 21 (100% of its wells old enough at that month); the dashed curve runs through month 81, on our forecast where a well’s own record ends2025: 707 wells in curve; starts at 417 Mcf/d per well, 0.4 Bcf cumulative through month 9 (100% of its wells old enough at that month); the dashed curve runs through month 69, on our forecast where a well’s own record ends2026: 506 wells in curve; starts at 611 Mcf/d per well, 0.0 Bcf cumulative through month 1 (100% of its wells old enough at that month); the dashed curve runs through month 61, on our forecast where a well’s own record ends20501002005001,0002,0004,000Mcf/d24487296120144168192216Months on production

Average production per well, for wells grouped by when they first produced.

How these curves are built

Average daily production per well, for wells grouped by when they first produced. Includes every well of the cohort that is old enough at each month. Wells that are shut in or have stopped producing count as zero, so the average reflects the full cohort, not just survivors. Rates are calendar-day (volume ÷ days in month). The cumulative axis accumulates those same monthly averages at the average month length. Months not yet fully reported are excluded. The 2010-2014 curve draws those years as one group. The chart opens on average daily rate against months on production, the rate on a log scale. The view control switches to rate against cumulative production per well, on the same log rate scale, or to cumulative production per well against months on production, on a linear scale. Every view draws the same cohorts from the same production history. Each cohort is solid through the last month all the wells in its curve sit inside fully reported data. Past it the dashed curve carries the same wells forward, on our forecast where a well’s own record ends, for up to five years. A dashed curve runs as far as at least nine in ten of its wells are accounted for. A well that is old enough but shut in still counts, as zero. The measured months are what these wells reported. In the forward months each well counts its own reported figure for each month it has one, our forecast for each month it has only that, and zero for the rest. The forward average counts every well in the curve. The drawn forecast runs up to five years past the measured months. Line thickness tracks the size of each cohort. 25,954 wells are counted here but not shown on the age axis: they started producing in 2008 or earlier, too close to the start of our records for their region to verify their true age.

Cohort summary table
First produced Wells in curve Peak oil (bbl/d per well) Month-12 oil (bbl/d per well) Cum oil in series (Mbbl per well) Peak gas (Mcf/d per well) Month-12 gas (Mcf/d per well) Cum gas in series (Bcf per well) Months in series Wells old enough at last month in series Forecast months drawn
2026 506 140 — 4.2 611 — 0.0 1 100% 60
2025 707 688 — 132 1,897 — 0.4 9 100% 60
2024 801 471 213 161 2,227 1,401 0.9 21 100% 60
2023 852 317 134 139 1,669 961 1.0 33 100% 60
2022 810 308 153 165 1,894 1,204 1.2 45 100% 60
2021 679 330 152 188 2,296 1,342 1.6 57 100% 60
2020 384 217 123 163 587 419 0.5 69 100% 60
2019 887 162 86 130 1,007 765 0.9 81 100% 60
2018 969 123 66.2 102 1,662 977 1.5 93 100% 60
2017 995 84.1 48.2 81.8 847 582 0.8 105 100% 60
2016 1,138 76.2 46.1 82.1 944 730 1.2 117 100% 60
2015 1,574 79.4 37.2 72.4 657 486 1.0 129 100% 60
2010-2014 6,808 80.6 41 80.8 343 242 0.5 141 100% 60

Source: CommoVision (commovision.com)

Source: CommoVision · Argentina type curves, per-well production by first-production cohort.

Top operators in Argentina, 2025

  1. YPF S.A. 39.1%
  2. Pan American Energy 12.7%
  3. TotalEnergies Austral S.A. 7.9%
  4. Vista Energy Argentina S.A.U. 6.3%
  5. Pluspetrol S.A. 6.1%
  6. Tecpetrol S.A. 6.0%
  7. Pampa Energía S.A. 3.4%
  8. Shell Argentina S.A. 2.8%
  9. Compañía General de Combustibles S.A. 2.8%
  10. Chevron 1.5%
  11. 43 other operators 11.3%
  12. Without a named operator 0.2%
Top operators in Argentina, 2025: full table
OperatorOil (Mbbl/d, 2025)Gas produced (MMcf/d, 2025)Share of output
YPF S.A. 368.61,134.739.1%
Pan American Energy 106.8563.712.7%
TotalEnergies Austral S.A. 10.01,193.57.9%
Vista Energy Argentina S.A.U. 68.944.66.3%
Pluspetrol S.A. 44.0382.86.1%
Tecpetrol S.A. 23.1668.66.0%
Pampa Energía S.A. 9.6434.53.4%
Shell Argentina S.A. 30.125.02.8%
Compañía General de Combustibles S.A. 18.7189.52.8%
Chevron 15.235.71.5%
43 other operators 106.9315.711.3%
Without a named operator 1.63.40.2%

Mbbl/d = thousand barrels per day · MMcf/d = million cubic feet per day (units).

Source: CommoVision (commovision.com)

Active drilling rigs

52 rigs active on average in Oct 2026
+15 rigs vs a year earlier
75 rigs peak month, Sep 2018 (since Oct 2016)
Active drilling rigs by rig type (rigs, monthly average)Source: Baker Hughes
Oil Gas Miscellaneous
Active drilling rigs by rig type: rigs, monthly average 20 40 60 80 rigs 2017201820192020202120222023202420252026 Oct 2016: 69 rigs on average (Oil 61, Gas 8, Miscellaneous 0) Nov 2016: 70 rigs on average (Oil 62, Gas 8, Miscellaneous 0) Dec 2016: 59 rigs on average (Oil 52, Gas 7, Miscellaneous 0) Jan 2017: 52 rigs on average (Oil 43, Gas 9, Miscellaneous 0) Feb 2017: 54 rigs on average (Oil 46, Gas 8, Miscellaneous 0) Mar 2017: 58 rigs on average (Oil 50, Gas 8, Miscellaneous 0) Apr 2017: 49 rigs on average (Oil 40, Gas 9, Miscellaneous 0) May 2017: 53 rigs on average (Oil 45, Gas 8, Miscellaneous 0) Jun 2017: 60 rigs on average (Oil 52, Gas 8, Miscellaneous 0) Jul 2017: 65 rigs on average (Oil 56, Gas 9, Miscellaneous 0) Aug 2017: 67 rigs on average (Oil 56, Gas 10, Miscellaneous 1) Sep 2017: 67 rigs on average (Oil 56, Gas 11, Miscellaneous 0) Oct 2017: 70 rigs on average (Oil 58, Gas 12, Miscellaneous 0) Nov 2017: 73 rigs on average (Oil 61, Gas 12, Miscellaneous 0) Dec 2017: 71 rigs on average (Oil 60, Gas 11, Miscellaneous 0) Jan 2018: 68 rigs on average (Oil 58, Gas 10, Miscellaneous 0) Feb 2018: 69 rigs on average (Oil 58, Gas 11, Miscellaneous 0) Mar 2018: 68 rigs on average (Oil 58, Gas 10, Miscellaneous 0) Apr 2018: 69 rigs on average (Oil 59, Gas 10, Miscellaneous 0) May 2018: 67 rigs on average (Oil 58, Gas 9, Miscellaneous 0) Jun 2018: 72 rigs on average (Oil 62, Gas 10, Miscellaneous 0) Jul 2018: 71 rigs on average (Oil 62, Gas 9, Miscellaneous 0) Aug 2018: 74 rigs on average (Oil 65, Gas 9, Miscellaneous 0) Sep 2018: 75 rigs on average (Oil 64, Gas 11, Miscellaneous 0) Oct 2018: 73 rigs on average (Oil 62, Gas 11, Miscellaneous 0) Nov 2018: 72 rigs on average (Oil 61, Gas 11, Miscellaneous 0) Dec 2018: 74 rigs on average (Oil 61, Gas 13, Miscellaneous 0) Jan 2019: 73 rigs on average (Oil 60, Gas 13, Miscellaneous 0) Feb 2019: 66 rigs on average (Oil 55, Gas 11, Miscellaneous 0) Mar 2019: 65 rigs on average (Oil 54, Gas 11, Miscellaneous 0) Apr 2019: 67 rigs on average (Oil 55, Gas 12, Miscellaneous 0) May 2019: 67 rigs on average (Oil 54, Gas 13, Miscellaneous 0) Jun 2019: 68 rigs on average (Oil 55, Gas 13, Miscellaneous 0) Jul 2019: 72 rigs on average (Oil 59, Gas 13, Miscellaneous 0) Aug 2019: 71 rigs on average (Oil 59, Gas 12, Miscellaneous 0) Sep 2019: 55 rigs on average (Oil 44, Gas 11, Miscellaneous 0) Oct 2019: 55 rigs on average (Oil 44, Gas 11, Miscellaneous 0) Nov 2019: 55 rigs on average (Oil 47, Gas 8, Miscellaneous 0) Dec 2019: 50 rigs on average (Oil 44, Gas 6, Miscellaneous 0) Jan 2020: 47 rigs on average (Oil 42, Gas 5, Miscellaneous 0) Feb 2020: 49 rigs on average (Oil 43, Gas 6, Miscellaneous 0) Mar 2020: 38 rigs on average (Oil 34, Gas 4, Miscellaneous 0) Apr 2020: 0 rigs on average (Oil 0, Gas 0, Miscellaneous 0) May 2020: 2 rigs on average (Oil 1, Gas 1, Miscellaneous 0) Jun 2020: 6 rigs on average (Oil 5, Gas 1, Miscellaneous 0) Jul 2020: 11 rigs on average (Oil 10, Gas 1, Miscellaneous 0) Aug 2020: 13 rigs on average (Oil 12, Gas 1, Miscellaneous 0) Sep 2020: 16 rigs on average (Oil 15, Gas 1, Miscellaneous 0) Oct 2020: 21 rigs on average (Oil 19, Gas 2, Miscellaneous 0) Nov 2020: 26 rigs on average (Oil 21, Gas 5, Miscellaneous 0) Dec 2020: 29 rigs on average (Oil 23, Gas 6, Miscellaneous 0) Jan 2021: 34 rigs on average (Oil 27, Gas 7, Miscellaneous 0) Feb 2021: 38 rigs on average (Oil 30, Gas 8, Miscellaneous 0) Mar 2021: 39 rigs on average (Oil 30, Gas 9, Miscellaneous 0) Apr 2021: 33 rigs on average (Oil 27, Gas 6, Miscellaneous 0) May 2021: 45 rigs on average (Oil 37, Gas 8, Miscellaneous 0) Jun 2021: 45 rigs on average (Oil 38, Gas 7, Miscellaneous 0) Jul 2021: 46 rigs on average (Oil 38, Gas 8, Miscellaneous 0) Aug 2021: 45 rigs on average (Oil 37, Gas 8, Miscellaneous 0) Sep 2021: 45 rigs on average (Oil 37, Gas 8, Miscellaneous 0) Oct 2021: 45 rigs on average (Oil 37, Gas 8, Miscellaneous 0) Nov 2021: 47 rigs on average (Oil 39, Gas 8, Miscellaneous 0) Dec 2021: 51 rigs on average (Oil 43, Gas 8, Miscellaneous 0) Jan 2022: 48 rigs on average (Oil 40, Gas 8, Miscellaneous 0) Feb 2022: 51 rigs on average (Oil 43, Gas 8, Miscellaneous 0) Mar 2022: 50 rigs on average (Oil 43, Gas 7, Miscellaneous 0) Apr 2022: 54 rigs on average (Oil 46, Gas 8, Miscellaneous 0) May 2022: 50 rigs on average (Oil 41, Gas 9, Miscellaneous 0) Jun 2022: 48 rigs on average (Oil 40, Gas 8, Miscellaneous 0) Jul 2022: 51 rigs on average (Oil 42, Gas 9, Miscellaneous 0) Aug 2022: 53 rigs on average (Oil 43, Gas 10, Miscellaneous 0) Sep 2022: 56 rigs on average (Oil 46, Gas 10, Miscellaneous 0) Oct 2022: 59 rigs on average (Oil 49, Gas 10, Miscellaneous 0) Nov 2022: 62 rigs on average (Oil 52, Gas 10, Miscellaneous 0) Dec 2022: 60 rigs on average (Oil 50, Gas 10, Miscellaneous 0) Jan 2023: 58 rigs on average (Oil 48, Gas 10, Miscellaneous 0) Feb 2023: 60 rigs on average (Oil 50, Gas 10, Miscellaneous 0) Mar 2023: 60 rigs on average (Oil 50, Gas 10, Miscellaneous 0) Apr 2023: 58 rigs on average (Oil 47, Gas 11, Miscellaneous 0) May 2023: 57 rigs on average (Oil 46, Gas 11, Miscellaneous 0) Jun 2023: 58 rigs on average (Oil 48, Gas 10, Miscellaneous 0) Jul 2023: 58 rigs on average (Oil 47, Gas 11, Miscellaneous 0) Aug 2023: 56 rigs on average (Oil 45, Gas 11, Miscellaneous 0) Sep 2023: 57 rigs on average (Oil 44, Gas 13, Miscellaneous 0) Oct 2023: 58 rigs on average (Oil 45, Gas 13, Miscellaneous 0) Nov 2023: 58 rigs on average (Oil 46, Gas 12, Miscellaneous 0) Dec 2023: 57 rigs on average (Oil 44, Gas 13, Miscellaneous 0) Jan 2024: 57 rigs on average (Oil 43, Gas 14, Miscellaneous 0) Feb 2024: 53 rigs on average (Oil 40, Gas 13, Miscellaneous 0) Mar 2024: 50 rigs on average (Oil 37, Gas 13, Miscellaneous 0) Apr 2024: 51 rigs on average (Oil 39, Gas 12, Miscellaneous 0) May 2024: 52 rigs on average (Oil 40, Gas 12, Miscellaneous 0) Jun 2024: 50 rigs on average (Oil 38, Gas 12, Miscellaneous 0) Jul 2024: 45 rigs on average (Oil 33, Gas 12, Miscellaneous 0) Aug 2024: 48 rigs on average (Oil 36, Gas 12, Miscellaneous 0) Sep 2024: 48 rigs on average (Oil 37, Gas 11, Miscellaneous 0) Oct 2024: 47 rigs on average (Oil 35, Gas 12, Miscellaneous 0) Nov 2024: 47 rigs on average (Oil 35, Gas 12, Miscellaneous 0) Dec 2024: 45 rigs on average (Oil 32, Gas 13, Miscellaneous 0) Jan 2025: 49 rigs on average (Oil 36, Gas 13, Miscellaneous 0) Feb 2025: 50 rigs on average (Oil 37, Gas 13, Miscellaneous 0) Mar 2025: 49 rigs on average (Oil 37, Gas 12, Miscellaneous 0) Apr 2025: 44 rigs on average (Oil 32, Gas 12, Miscellaneous 0) May 2025: 42 rigs on average (Oil 30, Gas 12, Miscellaneous 0) Jun 2025: 42 rigs on average (Oil 30, Gas 12, Miscellaneous 0) Jul 2025: 38 rigs on average (Oil 27, Gas 11, Miscellaneous 0) Aug 2025: 36 rigs on average (Oil 25, Gas 11, Miscellaneous 0) Sep 2025: 35 rigs on average (Oil 24, Gas 11, Miscellaneous 0) Oct 2025: 37 rigs on average (Oil 25, Gas 12, Miscellaneous 0) Nov 2025: 37 rigs on average (Oil 25, Gas 12, Miscellaneous 0) Dec 2025: 36 rigs on average (Oil 25, Gas 11, Miscellaneous 0) Jan 2026: 39 rigs on average (Oil 28, Gas 11, Miscellaneous 0) Feb 2026: 38 rigs on average (Oil 28, Gas 10, Miscellaneous 0) Mar 2026: 42 rigs on average (Oil 31, Gas 11, Miscellaneous 0) Apr 2026: 44 rigs on average (Oil 32, Gas 12, Miscellaneous 0) May 2026: 44 rigs on average (Oil 32, Gas 12, Miscellaneous 0) Jun 2026: 44 rigs on average (Oil 32, Gas 12, Miscellaneous 0) Jul 2026: 47 rigs on average (Oil 34, Gas 13, Miscellaneous 0) Aug 2026: 50 rigs on average (Oil 36, Gas 14, Miscellaneous 0) Sep 2026: 52 rigs on average (Oil 38, Gas 14, Miscellaneous 0) Oct 2026: 52 rigs on average (Oil 38, Gas 14, Miscellaneous 0)

Interactive chart. Focus it and use the left and right arrow keys to read each month, Page Up and Page Down to move a year, Home and End for the ends of the series. The full figures are also in the table below.

  • In Argentina, an average of 52 drilling rigs were active in Oct 2026 (15 more than a year earlier).
  • Since Oct 2016, the monthly average peaked at 75 in Sep 2018.
Average active rigs per month: full table
Month Oil-directedGas-directedMiscellaneousAll rigs
Oct 20263814052
Sep 20263814052
Aug 20263614050
Jul 20263413047
Jun 20263212044
May 20263212044
Apr 20263212044
Mar 20263111042
Feb 20262810038
Jan 20262811039
Dec 20252511036
Nov 20252512037
Oct 20252512037
Sep 20252411035
Aug 20252511036
Jul 20252711038
Jun 20253012042
May 20253012042
Apr 20253212044
Mar 20253712049
Feb 20253713050
Jan 20253613049
Dec 20243213045
Nov 20243512047

Source: CommoVision (commovision.com)

What each region has actually reported

Argentina: every reporting region we publish, largest first. What it has reported and how far it is complete. Rates are for each region's newest complete month, so they are comparable across regions even though the months differ.

RegionOil (Mbbl/d)Gas produced (MMcf/d)Complete throughNewest month reported
Argentina 939.45,475.82026-082026-09

What we cover here

Each row names the grain a region’s production is held at. Where a source publishes at a coarser grain, the page says so.

DataGrainSinceBenchmark
Argentina production well 2006-01 —

Coverage rows for Argentina are regenerated at every build from the same catalog of sources the data is built from.

What the data shows

  • Argentina produced 293.3 MMbbl of oil and 1.82 Tcf of natural gas in 2025.
  • Argentina oil production reached its highest level on record in 2025 at 293.3 MMbbl.
  • 25,417 producing wells tracked, 12 months to Aug 2026.

Start a free trial

Watch supply move as soon as its sources publish, with forecasts on 1.1+ million producing wells. A real API and MCP access for AI tools are live, and the Portal is open.

What the trial includes

Data use is subject to our Terms of Service.