CommoVision

See the future in real time

Brazil

Brazil produced 1.38 Bbbl of oil and 2.31 Tcf of natural gas in 2025. 7,603 producing wells tracked, 12 months to Jun 2026.

  • Third-largest oil-producing country in the Americas, 2025.
  • 13.4% of the oil produced in the Americas, 2025.
  • Oil production rose 12% in 2025 from 2024.
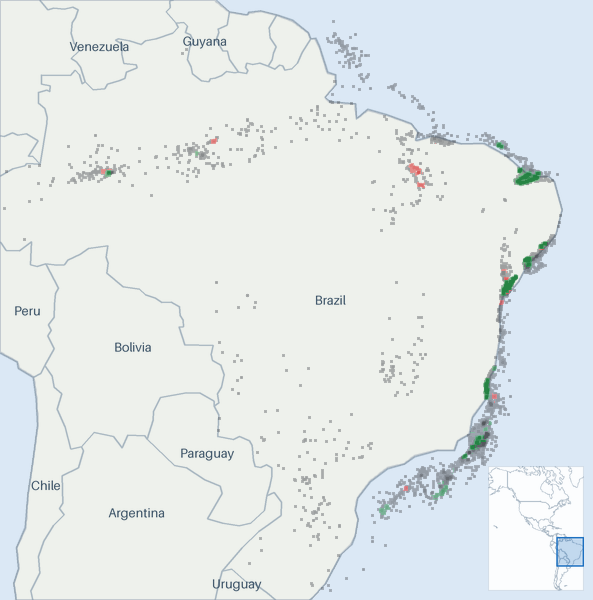
Well map of Brazil. The full map is further down this page.

Production

Brazil oil production (MMbbl/d, grouped by when each well first produced)
  • filling in (est. · missed) . Hatching marks our estimate of the volume still to be filed. That estimate draws on our own production forecast. A check on the forecast behind this estimate measured a miss. It updates as filings arrive
  • estimated . Hatching marks our estimate. In the most recent months that is volume still to be filed. Past the divider it is our estimate of each whole month, built on any filings already in. Beyond the last filings it is our forecast.
Brazil oil production: million barrels per day, by first-production vintage filed in full 246 MMbbl/d 2017201820192020202120222023202420252026 Oct 2016: 2.62 MMbbl/d total Nov 2016: 2.61 MMbbl/d total Dec 2016: 2.73 MMbbl/d total Jan 2017: 2.69 MMbbl/d total Feb 2017: 2.68 MMbbl/d total Mar 2017: 2.55 MMbbl/d total Apr 2017: 2.54 MMbbl/d total May 2017: 2.65 MMbbl/d total Jun 2017: 2.67 MMbbl/d total Jul 2017: 2.62 MMbbl/d total Aug 2017: 2.58 MMbbl/d total Sep 2017: 2.65 MMbbl/d total Oct 2017: 2.63 MMbbl/d total Nov 2017: 2.59 MMbbl/d total Dec 2017: 2.61 MMbbl/d total Jan 2018: 2.62 MMbbl/d total Feb 2018: 2.62 MMbbl/d total Mar 2018: 2.56 MMbbl/d total Apr 2018: 2.6 MMbbl/d total May 2018: 2.61 MMbbl/d total Jun 2018: 2.59 MMbbl/d total Jul 2018: 2.58 MMbbl/d total Aug 2018: 2.52 MMbbl/d total Sep 2018: 2.49 MMbbl/d total Oct 2018: 2.62 MMbbl/d total Nov 2018: 2.57 MMbbl/d total Dec 2018: 2.69 MMbbl/d total Jan 2019: 2.63 MMbbl/d total Feb 2019: 2.49 MMbbl/d total Mar 2019: 2.56 MMbbl/d total Apr 2019: 2.6 MMbbl/d total May 2019: 2.73 MMbbl/d total Jun 2019: 2.56 MMbbl/d total Jul 2019: 2.78 MMbbl/d total Aug 2019: 2.99 MMbbl/d total Sep 2019: 2.93 MMbbl/d total Oct 2019: 2.97 MMbbl/d total Nov 2019: 3.09 MMbbl/d total Dec 2019: 3.11 MMbbl/d total Jan 2020: 3.17 MMbbl/d total Feb 2020: 2.97 MMbbl/d total Mar 2020: 2.98 MMbbl/d total Apr 2020: 2.96 MMbbl/d total May 2020: 2.77 MMbbl/d total Jun 2020: 3.01 MMbbl/d total Jul 2020: 3.08 MMbbl/d total Aug 2020: 3.09 MMbbl/d total Sep 2020: 2.91 MMbbl/d total Oct 2020: 2.87 MMbbl/d total Nov 2020: 2.76 MMbbl/d total Dec 2020: 2.73 MMbbl/d total Jan 2021: 2.87 MMbbl/d total Feb 2021: 2.82 MMbbl/d total Mar 2021: 2.85 MMbbl/d total Apr 2021: 2.97 MMbbl/d total May 2021: 2.93 MMbbl/d total Jun 2021: 2.9 MMbbl/d total Jul 2021: 3.04 MMbbl/d total Aug 2021: 3 MMbbl/d total Sep 2021: 3 MMbbl/d total Oct 2021: 2.78 MMbbl/d total Nov 2021: 2.85 MMbbl/d total Dec 2021: 2.84 MMbbl/d total Jan 2022: 3.03 MMbbl/d total Feb 2022: 2.92 MMbbl/d total Mar 2022: 2.98 MMbbl/d total Apr 2022: 3 MMbbl/d total May 2022: 2.88 MMbbl/d total Jun 2022: 2.83 MMbbl/d total Jul 2022: 2.96 MMbbl/d total Aug 2022: 3.08 MMbbl/d total Sep 2022: 3.14 MMbbl/d total Oct 2022: 3.24 MMbbl/d total Nov 2022: 3.09 MMbbl/d total Dec 2022: 3.07 MMbbl/d total Jan 2023: 2.64 MMbbl/d total Feb 2023: 2.63 MMbbl/d total Mar 2023: 2.44 MMbbl/d total Apr 2023: 2.51 MMbbl/d total May 2023: 2.55 MMbbl/d total Jun 2023: 2.73 MMbbl/d total Jul 2023: 2.92 MMbbl/d total Aug 2023: 2.82 MMbbl/d total Sep 2023: 3.05 MMbbl/d total Oct 2023: 2.86 MMbbl/d total Nov 2023: 2.99 MMbbl/d total Dec 2023: 2.93 MMbbl/d total Jan 2024: 3.52 MMbbl/d total Feb 2024: 3.45 MMbbl/d total Mar 2024: 3.36 MMbbl/d total Apr 2024: 3.19 MMbbl/d total May 2024: 3.32 MMbbl/d total Jun 2024: 3.41 MMbbl/d total Jul 2024: 3.23 MMbbl/d total Aug 2024: 3.34 MMbbl/d total Sep 2024: 3.47 MMbbl/d total Oct 2024: 3.27 MMbbl/d total Nov 2024: 3.31 MMbbl/d total Dec 2024: 3.42 MMbbl/d total Jan 2025: 3.45 MMbbl/d total Feb 2025: 3.48 MMbbl/d total Mar 2025: 3.62 MMbbl/d total Apr 2025: 3.63 MMbbl/d total May 2025: 3.68 MMbbl/d total Jun 2025: 3.76 MMbbl/d total Jul 2025: 3.96 MMbbl/d total Aug 2025: 3.89 MMbbl/d total Sep 2025: 3.91 MMbbl/d total Oct 2025: 4.03 MMbbl/d total Nov 2025: 3.77 MMbbl/d total Dec 2025: 4.01 MMbbl/d total Jan 2026: 3.95 MMbbl/d total Feb 2026: 4.06 MMbbl/d total Mar 2026: 4.23 MMbbl/d total Apr 2026: 4.26 MMbbl/d total May 2026: 4.3 MMbbl/d total Jun 2026: 4.47 MMbbl/d total Jul 2026: ≈4.54 MMbbl/d total (100% arrived, remainder estimated) Aug 2026: ≈4.65 MMbbl/d total (<1% arrived, remainder estimated) Sep 2026: ≈4.66 MMbbl/d total (<1% arrived, remainder estimated)

In this view, hatching marks our estimate, and in the most recent months that is volume still to be filed. Past the divider, the chart continues only the bands it has drawn. Each band continues as our estimate, from any filings already in and then from our forecast, built by summing our per-well forecasts. The method behind each well is recorded with the forecast. The forward months cover existing wells only. How our methods work

All from what the source published. All held at well grain.

How the volume breaks down
  • 100% Reported by the official source by well

Every barrel through June 2026 starts from what the official source published for those months. Measured over January 1945 to June 2026.

Brazil natural gas production (Bcf/d, grouped by when each well first produced)
  • filling in (est. · missed) . Hatching marks our estimate of the volume still to be filed. That estimate draws on our own production forecast. A check on the forecast behind this estimate measured a miss. It updates as filings arrive
  • estimated . Hatching marks our estimate. In the most recent months that is volume still to be filed. Past the divider it is our estimate of each whole month, built on any filings already in. Beyond the last filings it is our forecast.
Brazil natural gas production: billion cubic feet per day, by first-production vintage filed in full 246810 Bcf/d 2017201820192020202120222023202420252026 Oct 2016: 3.83 Bcf/d total Nov 2016: 3.92 Bcf/d total Dec 2016: 3.95 Bcf/d total Jan 2017: 3.88 Bcf/d total Feb 2017: 3.77 Bcf/d total Mar 2017: 3.58 Bcf/d total Apr 2017: 3.62 Bcf/d total May 2017: 3.7 Bcf/d total Jun 2017: 3.93 Bcf/d total Jul 2017: 4.06 Bcf/d total Aug 2017: 3.95 Bcf/d total Sep 2017: 4.03 Bcf/d total Oct 2017: 4.05 Bcf/d total Nov 2017: 4.01 Bcf/d total Dec 2017: 4 Bcf/d total Jan 2018: 3.97 Bcf/d total Feb 2018: 3.88 Bcf/d total Mar 2018: 3.78 Bcf/d total Apr 2018: 3.84 Bcf/d total May 2018: 3.95 Bcf/d total Jun 2018: 4.06 Bcf/d total Jul 2018: 4.1 Bcf/d total Aug 2018: 3.76 Bcf/d total Sep 2018: 3.99 Bcf/d total Oct 2018: 4.13 Bcf/d total Nov 2018: 3.97 Bcf/d total Dec 2018: 4.02 Bcf/d total Jan 2019: 4 Bcf/d total Feb 2019: 3.89 Bcf/d total Mar 2019: 3.94 Bcf/d total Apr 2019: 3.99 Bcf/d total May 2019: 4.17 Bcf/d total Jun 2019: 3.93 Bcf/d total Jul 2019: 4.39 Bcf/d total Aug 2019: 4.71 Bcf/d total Sep 2019: 4.55 Bcf/d total Oct 2019: 4.65 Bcf/d total Nov 2019: 4.82 Bcf/d total Dec 2019: 4.87 Bcf/d total Jan 2020: 4.9 Bcf/d total Feb 2020: 4.55 Bcf/d total Mar 2020: 4.3 Bcf/d total Apr 2020: 4.38 Bcf/d total May 2020: 4.04 Bcf/d total Jun 2020: 4.54 Bcf/d total Jul 2020: 4.6 Bcf/d total Aug 2020: 4.71 Bcf/d total Sep 2020: 4.42 Bcf/d total Oct 2020: 4.59 Bcf/d total Nov 2020: 4.46 Bcf/d total Dec 2020: 4.48 Bcf/d total Jan 2021: 4.82 Bcf/d total Feb 2021: 4.63 Bcf/d total Mar 2021: 4.45 Bcf/d total Apr 2021: 4.64 Bcf/d total May 2021: 4.75 Bcf/d total Jun 2021: 4.79 Bcf/d total Jul 2021: 4.92 Bcf/d total Aug 2021: 4.83 Bcf/d total Sep 2021: 4.71 Bcf/d total Oct 2021: 4.65 Bcf/d total Nov 2021: 4.82 Bcf/d total Dec 2021: 4.67 Bcf/d total Jan 2022: 4.85 Bcf/d total Feb 2022: 4.71 Bcf/d total Mar 2022: 4.75 Bcf/d total Apr 2022: 4.83 Bcf/d total May 2022: 4.65 Bcf/d total Jun 2022: 4.69 Bcf/d total Jul 2022: 4.7 Bcf/d total Aug 2022: 4.85 Bcf/d total Sep 2022: 4.96 Bcf/d total Oct 2022: 5.16 Bcf/d total Nov 2022: 4.86 Bcf/d total Dec 2022: 4.85 Bcf/d total Jan 2023: 4.16 Bcf/d total Feb 2023: 4.33 Bcf/d total Mar 2023: 3.98 Bcf/d total Apr 2023: 4.08 Bcf/d total May 2023: 4.23 Bcf/d total Jun 2023: 4.45 Bcf/d total Jul 2023: 4.57 Bcf/d total Aug 2023: 4.29 Bcf/d total Sep 2023: 4.74 Bcf/d total Oct 2023: 4.45 Bcf/d total Nov 2023: 4.77 Bcf/d total Dec 2023: 4.57 Bcf/d total Jan 2024: 5.44 Bcf/d total Feb 2024: 5.25 Bcf/d total Mar 2024: 5.08 Bcf/d total Apr 2024: 4.83 Bcf/d total May 2024: 5.14 Bcf/d total Jun 2024: 5.3 Bcf/d total Jul 2024: 5.34 Bcf/d total Aug 2024: 5.64 Bcf/d total Sep 2024: 6 Bcf/d total Oct 2024: 5.61 Bcf/d total Nov 2024: 5.57 Bcf/d total Dec 2024: 5.69 Bcf/d total Jan 2025: 5.68 Bcf/d total Feb 2025: 5.6 Bcf/d total Mar 2025: 5.84 Bcf/d total Apr 2025: 5.93 Bcf/d total May 2025: 6.08 Bcf/d total Jun 2025: 6.41 Bcf/d total Jul 2025: 6.74 Bcf/d total Aug 2025: 6.67 Bcf/d total Sep 2025: 6.73 Bcf/d total Oct 2025: 6.88 Bcf/d total Nov 2025: 6.44 Bcf/d total Dec 2025: 6.86 Bcf/d total Jan 2026: 6.82 Bcf/d total Feb 2026: 6.98 Bcf/d total Mar 2026: 7.2 Bcf/d total Apr 2026: 6.43 Bcf/d total May 2026: 7.27 Bcf/d total Jun 2026: 7.67 Bcf/d total Jul 2026: ≈7.57 Bcf/d total (100% arrived, remainder estimated) Aug 2026: ≈7.67 Bcf/d total (<1% arrived, remainder estimated) Sep 2026: ≈7.7 Bcf/d total (<1% arrived, remainder estimated)

In this view, hatching marks our estimate, and in the most recent months that is volume still to be filed. Past the divider, the chart continues only the bands it has drawn. Each band continues as our estimate, from any filings already in and then from our forecast, built by summing our per-well forecasts. The method behind each well is recorded with the forecast. The forward months cover existing wells only. How our methods work

All from what the source published. All held at well grain.

How the volume breaks down
  • 100% Reported by the official source by well

Every cubic foot through June 2026 starts from what the official source published for those months. Measured over January 1945 to June 2026.

The bands group wells by when they first produced.

About this chart

The stack shows what is holding today's rate up and how much of it is new drilling. In the reported months the bands draw the filings already in. The months still filling in are marked.

Annual table (full history)
YearOil (MMbbl)Gas produced (Bcf)
20251,375.22,309
20241,228.51,979
20231,005.61,600
20221,101.71,761
20211,060.41,724
20201,076.01,647
20191,017.51,579
2018944.11,443
2017956.91,417
2016918.71,338
2015889.71,240
2014822.91,126
2013738.7995
2012754.4912
2011768.5850
2010750.0810
2009711.9747
2008663.6763
2007637.7641
2006628.8625
2005597.7319
2004542.283
2003548.5275
2002532.0549
2001472.2494
2000449.4468
1999402.2419
1998356.3381
1997307.7347
1996287.0325
1995253.2284
1994244.3273
1993235.5260
1992231.3247
1991229.9235
1990232.5223
1989219.6218
1988205.2215
1987207.6210
1986210.2201
1985201.2193
1984169.2172
1983121.0142
198295.6108
198178.689
198067.077
197961.568
197859.468
197759.264
197661.762
197563.657
197465.853
197363.142
197261.843
197162.941
197060.844
196963.944
196859.135
196753.831
196642.428
196534.324
196433.318
196335.718
196233.217
196134.618
196029.418
195923.314
195818.79
195710.05
19564.03
19552.02
19541.02
19530.91
19520.7<1
19510.6<1
19500.31
19490.1<1
19480.1<1
19470.1<1
19460.1<1
19450.1<1

Source: CommoVision (commovision.com)

Monthly table (last 24 months)
MonthOil (Mbbl)Gas produced (MMcf)
2026-06134,175.4230,158
2026-05133,270.8225,475
2026-04127,693.9192,776
2026-03131,234.4223,285
2026-02113,638.9195,310
2026-01122,466.0211,350
2025-12124,367.5212,620
2025-11113,089.5193,310
2025-10124,832.6213,117
2025-09117,353.4201,805
2025-08120,688.4206,695
2025-07122,641.8208,868
2025-06112,672.7192,362
2025-05114,046.9188,612
2025-04108,890.2177,879
2025-03112,161.9181,101
2025-0297,588.7156,881
2025-01106,819.6175,881
2024-12105,975.5176,286
2024-1199,296.1167,006
2024-10101,323.8173,914
2024-09104,107.6180,020
2024-08103,551.0174,835
2024-07100,120.0165,611

Source: CommoVision (commovision.com)

Source: CommoVision · Brazil, data through July 2026.

Well map

A map of 31,295 well locations in Brazil for which CommoVision holds a published surface coordinate, each drawn where it is and colored by its primary product (green for oil, red for natural gas, gray where undetermined; a spot shared by more than one product shows the one with the most wells there), on a ground of land and water over faint country outlines and place names for orientation, with a small inset map locating this frame in the Americas.
  • Oil 19,007
  • Natural gas 867
  • Undetermined 11,421
31,295 well locations in Brazil, colored by primary product.
About this map

Undetermined means not enough signal to settle it. Producing wells are the ones that reported oil or gas in the 12 months to Jun 2026.

4.54 MMbbl/d (est.) Jul 2026 oil production Jul 2026 is still filling in. The figure is the filings already in plus an estimate of the part not yet filed. The change compares this estimate with the same month last year. +14.8% vs Jul last year
7.57 Bcf/d (est.) Jul 2026 gas production Jul 2026 is still filling in. The figure is the filings already in plus an estimate of the part not yet filed. The change compares this estimate with the same month last year. +12.3% vs Jul last year
3.77 MMbbl/d 2025 oil production
6.33 Bcf/d 2025 gas production
7,603 wells Producing wells tracked 12 months to Jun 2026
3.93 MMbbl/d Existing wells, Sep 2027 forecast Our forecast for existing wells.
6.47 Bcf/d Existing wells, Sep 2027 forecast Our forecast for existing wells.

Type curves

Brazil oil type curves (bbl/d per well, log scale, against months on production; cohorts 2010–2026)
Brazil oil type curves: average barrels per day per well on a log scale against months on production 2010-2014: 2,267 wells; starts at 606 bbl/d per well, 2,052 Mbbl cumulative through month 139 (100% of its wells old enough at that month); the dashed curve runs through month 199, on our forecast where a well’s own record ends2015: 547 wells; starts at 382 bbl/d per well, 2,168 Mbbl cumulative through month 127 (100% of its wells old enough at that month); the dashed curve runs through month 187, on our forecast where a well’s own record ends2016: 306 wells; starts at 732 bbl/d per well, 3,974 Mbbl cumulative through month 115 (100% of its wells old enough at that month); the dashed curve runs through month 175, on our forecast where a well’s own record ends2017: 153 wells; starts at 1,682 bbl/d per well, 6,333 Mbbl cumulative through month 103 (100% of its wells old enough at that month); the dashed curve runs through month 163, on our forecast where a well’s own record ends2018: 167 wells; starts at 632 bbl/d per well, 1,967 Mbbl cumulative through month 91 (100% of its wells old enough at that month); the dashed curve runs through month 151, on our forecast where a well’s own record ends2019: 110 wells; starts at 2,351 bbl/d per well, 9,106 Mbbl cumulative through month 79 (100% of its wells old enough at that month); the dashed curve runs through month 139, on our forecast where a well’s own record ends2020: 102 wells; starts at 1,401 bbl/d per well, 5,339 Mbbl cumulative through month 67 (100% of its wells old enough at that month); the dashed curve runs through month 127, on our forecast where a well’s own record ends2021: 66 wells; starts at 2,108 bbl/d per well, 5,182 Mbbl cumulative through month 55 (100% of its wells old enough at that month); the dashed curve runs through month 115, on our forecast where a well’s own record ends2022: 117 wells; starts at 1,456 bbl/d per well, 2,922 Mbbl cumulative through month 43 (100% of its wells old enough at that month); the dashed curve runs through month 103, on our forecast where a well’s own record ends2023: 159 wells; starts at 1,193 bbl/d per well, 2,913 Mbbl cumulative through month 31 (100% of its wells old enough at that month); the dashed curve runs through month 91, on our forecast where a well’s own record ends2024: 159 wells; starts at 1,081 bbl/d per well, 1,305 Mbbl cumulative through month 19 (100% of its wells old enough at that month); the dashed curve runs through month 79, on our forecast where a well’s own record ends2025: 194 wells; starts at 1,700 bbl/d per well, 766 Mbbl cumulative through month 7 (100% of its wells old enough at that month); the dashed curve runs through month 67, on our forecast where a well’s own record ends2026: 128 wells; starts at 1,509 bbl/d per well, 45.9 Mbbl cumulative through month 1 (100% of its wells old enough at that month); the dashed curve runs through month 61, on our forecast where a well’s own record ends1002005001,0002,0005,0007,000bbl/d24487296120144168192216Months on production
Brazil natural gas type curves (Mcf/d per well, log scale, against months on production; cohorts 2010–2026)
Brazil natural gas type curves: average thousand cubic feet per day per well on a log scale against months on production 2010-2014: 2,267 wells; starts at 567 Mcf/d per well, 3.0 Bcf cumulative through month 139 (100% of its wells old enough at that month); the dashed curve runs through month 199, on our forecast where a well’s own record ends2015: 547 wells; starts at 413 Mcf/d per well, 3.6 Bcf cumulative through month 127 (100% of its wells old enough at that month); the dashed curve runs through month 187, on our forecast where a well’s own record ends2016: 306 wells; starts at 895 Mcf/d per well, 6.1 Bcf cumulative through month 115 (100% of its wells old enough at that month); the dashed curve runs through month 175, on our forecast where a well’s own record ends2017: 153 wells; starts at 2,221 Mcf/d per well, 10.0 Bcf cumulative through month 103 (100% of its wells old enough at that month); the dashed curve runs through month 163, on our forecast where a well’s own record ends2018: 167 wells; starts at 522 Mcf/d per well, 1.8 Bcf cumulative through month 91 (100% of its wells old enough at that month); the dashed curve runs through month 151, on our forecast where a well’s own record ends2019: 110 wells; starts at 2,646 Mcf/d per well, 12.5 Bcf cumulative through month 79 (100% of its wells old enough at that month); the dashed curve runs through month 139, on our forecast where a well’s own record ends2020: 102 wells; starts at 1,600 Mcf/d per well, 7.6 Bcf cumulative through month 67 (100% of its wells old enough at that month); the dashed curve runs through month 127, on our forecast where a well’s own record ends2021: 66 wells; starts at 3,031 Mcf/d per well, 8.1 Bcf cumulative through month 55 (100% of its wells old enough at that month); the dashed curve runs through month 115, on our forecast where a well’s own record ends2022: 117 wells; starts at 1,225 Mcf/d per well, 4.2 Bcf cumulative through month 43 (100% of its wells old enough at that month); the dashed curve runs through month 103, on our forecast where a well’s own record ends2023: 159 wells; starts at 1,117 Mcf/d per well, 3.4 Bcf cumulative through month 31 (100% of its wells old enough at that month); the dashed curve runs through month 91, on our forecast where a well’s own record ends2024: 159 wells; starts at 1,551 Mcf/d per well, 2.2 Bcf cumulative through month 19 (100% of its wells old enough at that month); the dashed curve runs through month 79, on our forecast where a well’s own record ends2025: 194 wells; starts at 2,267 Mcf/d per well, 1.1 Bcf cumulative through month 7 (100% of its wells old enough at that month); the dashed curve runs through month 67, on our forecast where a well’s own record ends2026: 128 wells; starts at 2,234 Mcf/d per well, 0.1 Bcf cumulative through month 1 (100% of its wells old enough at that month); the dashed curve runs through month 61, on our forecast where a well’s own record ends1502005001,0002,0005,0007,000Mcf/d24487296120144168192216Months on production

Average production per well, for wells grouped by when they first produced.

How these curves are built

Average daily production per well, for wells grouped by when they first produced. Includes every well of the cohort that is old enough at each month. Wells that are shut in or have stopped producing count as zero, so the average reflects the full cohort, not just survivors. Rates are calendar-day (volume ÷ days in month). The cumulative axis accumulates those same monthly averages at the average month length. Months not yet fully reported are excluded. The 2010-2014 curve draws those years as one group. The chart opens on average daily rate against months on production, the rate on a log scale. The view control switches to rate against cumulative production per well, on the same log rate scale, or to cumulative production per well against months on production, on a linear scale. Every view draws the same cohorts from the same production history. Each cohort is solid through the last month all of its wells sit inside fully reported data. Past it the dashed curve carries the same wells forward, on our forecast where a well’s own record ends, for up to five years. A dashed curve runs as far as at least nine in ten of its wells are accounted for. A well that is old enough but shut in still counts, as zero. The measured months are what these wells reported. In the forward months each well counts its own reported figure for each month it has one, our forecast for each month it has only that, and zero for the rest. The forward average counts every well of the cohort. The drawn forecast runs up to five years past the measured months. Line thickness tracks the size of each cohort.

Cohort summary table
First produced Wells Peak oil (bbl/d per well) Month-12 oil (bbl/d per well) Cum oil in series (Mbbl per well) Peak gas (Mcf/d per well) Month-12 gas (Mcf/d per well) Cum gas in series (Bcf per well) Months in series Wells old enough at last month in series Forecast months drawn
2026 128 1,509 45.9 2,234 0.1 1 100% 60
2025 194 4,189 766 6,428 1.1 7 100% 60
2024 159 2,518 2,381 1,305 4,352 4,002 2.2 19 100% 60
2023 159 3,859 3,488 2,913 4,415 4,092 3.4 31 100% 60
2022 117 3,116 2,186 2,922 3,923 2,906 4.2 43 100% 60
2021 66 4,479 3,619 5,182 6,002 5,072 8.1 55 100% 60
2020 102 3,359 3,042 5,339 4,462 3,938 7.6 67 100% 60
2019 110 5,935 4,892 9,106 6,966 5,701 12.5 79 100% 60
2018 167 1,245 966 1,967 887 661 1.8 91 100% 60
2017 153 3,105 2,509 6,333 4,373 3,263 10.0 103 100% 60
2016 306 1,687 1,441 3,974 2,268 1,780 6.1 115 100% 60
2015 547 820 820 2,168 1,221 1,149 3.6 127 100% 60
2010-2014 2,267 1,240 892 2,052 1,249 1,087 3.0 139 100% 60

Source: CommoVision (commovision.com)

Source: CommoVision · Brazil type curves, per-well production by first-production cohort.

Top operators in Brazil, 2025

  1. Petrobras 90.5%
  2. Prio S.A. 2.1%
  3. Equinor 1.6%
  4. Brava Energia S.A. 1.5%
  5. TotalEnergies 1.0%
  6. Shell 0.6%
  7. Trident Energy 0.6%
  8. Karoon Energy 0.5%
  9. PetroRecôncavo S.A. 0.5%
  10. Perenco 0.4%
  11. 30 other operators 0.8%
Top operators in Brazil, 2025: full table
OperatorOil (Mbbl/d, 2025)Gas produced (MMcf/d, 2025)Share of output
Petrobras 3,405.05,789.390.5%
Prio S.A. 85.639.02.1%
Equinor 64.811.61.6%
Brava Energia S.A. 57.366.61.5%
TotalEnergies 39.553.01.0%
Shell 24.911.90.6%
Trident Energy 22.615.10.6%
Karoon Energy 21.08.30.5%
PetroRecôncavo S.A. 16.362.00.5%
Perenco 15.12.60.4%
30 other operators 15.5267.10.8%

Mbbl/d = thousand barrels per day · MMcf/d = million cubic feet per day (units).

Source: CommoVision (commovision.com)

What each region has actually reported

Brazil: every reporting region we publish, largest first. What it has reported and how far it is complete. Rates are for each region's newest complete month, so they are comparable across regions even though the months differ.

RegionOil (Mbbl/d)Gas produced (MMcf/d)Complete throughNewest month reported
Brazil 4,472.57,671.92026-062026-07

What we cover here

Each row names the grain a region’s production is held at. Where a source publishes at a coarser grain, the page says so.

DataGrainSinceBenchmark
Brazil production well 1941-12

Coverage rows for Brazil are regenerated at every build from the same catalog of sources the data is built from.

What the data shows

  • Brazil produced 1.38 Bbbl of oil and 2.31 Tcf of natural gas in 2025.
  • Brazil oil production reached its highest level on record in 2025 at 1.38 Bbbl.
  • 7,603 producing wells tracked, 12 months to Jun 2026.

Get early access

Watch supply move as soon as its sources publish, with forecasts on 1.1+ million producing wells. The portal, an API and MCP access for AI tools open on October 1, 2026.

Data use is subject to our Terms of Service.