
Guyana
Guyana produced 261.1 MMbbl of oil and 378.9 Bcf of natural gas in 2025.
- Eighth-largest oil-producing country in the Americas, 2025.
- 2.5% of the oil produced in the Americas, 2025.
- Oil production rose 16% in 2025 from 2024.
Production
Interactive chart. Focus it and use the left and right arrow keys to read each month, Page Up and Page Down to move a year, Home and End for the ends of the series. The full figures are also in the table below.
Held at facility grain: every facility is named.
All from what the source published. All held at facility grain.
How the volume breaks down
- 100% Reported by the official source as a lease, facility, field or state total. Published without per-well detail.
Every barrel here starts from what the official source published for the months measured. Measured over January 2019 to September 2026.
Interactive chart. Focus it and use the left and right arrow keys to read each period, Page Up and Page Down for bigger steps, Home and End for the ends of the series. The full figures are also in the table on this page.
All from what the source published. All held at national grain.
How the volume breaks down
- 100% Reported by the official source as a lease, facility, field or state total. Published without per-well detail.
Every cubic foot here starts from what the official source published for the months measured. Measured over January 2019 to September 2026.
Held at national grain: the chart draws the total as one series.
About this chart
Splitting it into bands by the year each well started takes volumes at well grain.
Annual table (full history)
best estimate incl. unsplit totals
| Year | Oil (MMbbl) | Gas produced (Bcf) |
|---|---|---|
| 2025 | 261.1 | 379 |
| 2024 | 225.4 | 282 |
| 2023 | 142.8 | 192 |
| 2022 | 101.3 | 142 |
| 2021 | 42.7 | 50 |
| 2020 | 27.2 | 30 |
| 2019 | 0.4 | <1 |
Source: CommoVision (commovision.com)
Monthly table (last 24 months)
| Month | Oil (Mbbl) | Gas produced (MMcf) |
|---|---|---|
| 2026-09 | 27,180.8 | 42,194 |
| 2026-08 | 25,786.5 | 38,971 |
| 2026-07 | 27,454.1 | 42,664 |
| 2026-06 | 26,080.5 | 41,849 |
| 2026-05 | 27,719.8 | 43,418 |
| 2026-04 | 27,081.7 | 41,435 |
| 2026-03 | 28,345.6 | 42,719 |
| 2026-02 | 25,697.9 | 37,660 |
| 2026-01 | 28,375.3 | 41,820 |
| 2025-12 | 27,646.5 | 39,535 |
| 2025-11 | 26,815.0 | 38,554 |
| 2025-10 | 25,950.9 | 37,367 |
| 2025-09 | 23,134.6 | 33,856 |
| 2025-08 | 21,240.9 | 31,070 |
| 2025-07 | 20,578.7 | 30,911 |
| 2025-06 | 19,922.9 | 30,074 |
| 2025-05 | 20,692.0 | 31,036 |
| 2025-04 | 18,336.9 | 25,809 |
| 2025-03 | 19,432.5 | 28,346 |
| 2025-02 | 18,148.4 | 26,281 |
| 2025-01 | 19,211.9 | 26,074 |
| 2024-12 | 20,337.7 | 26,658 |
| 2024-11 | 19,543.6 | 25,273 |
| 2024-10 | 20,068.2 | 25,928 |
Source: CommoVision (commovision.com)
Source: CommoVision · Guyana, data through September 2026.
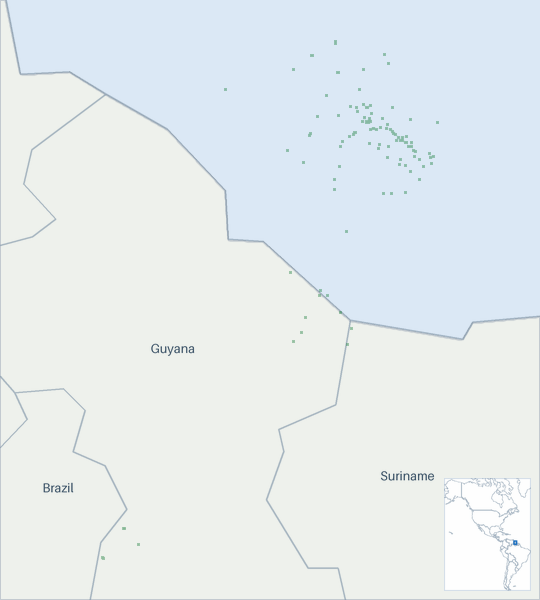
Well map
- Oil 109
About this map
Undetermined means not enough signal to settle it.
Active drilling rigs
Interactive chart. Focus it and use the left and right arrow keys to read each month, Page Up and Page Down to move a year, Home and End for the ends of the series. The full figures are also in the table below.
- In Guyana, an average of 5 drilling rigs were active in Oct 2026 (unchanged from a year earlier).
- Since Oct 2016, the monthly average peaked at 6 in Jan 2022.
Average active rigs per month: full table
| Month | Oil-directed | Gas-directed | Miscellaneous | All rigs |
|---|---|---|---|---|
| Oct 2026 | 5 | 0 | 0 | 5 |
| Sep 2026 | 4 | 0 | 0 | 4 |
| Aug 2026 | 5 | 0 | 0 | 5 |
| Jul 2026 | 4 | 0 | 0 | 4 |
| Jun 2026 | 4 | 0 | 0 | 4 |
| May 2026 | 5 | 0 | 0 | 5 |
| Apr 2026 | 5 | 0 | 0 | 5 |
| Mar 2026 | 5 | 0 | 0 | 5 |
| Feb 2026 | 5 | 0 | 0 | 5 |
| Jan 2026 | 5 | 0 | 0 | 5 |
| Dec 2025 | 4 | 0 | 0 | 4 |
| Nov 2025 | 4 | 0 | 0 | 4 |
| Oct 2025 | 5 | 0 | 0 | 5 |
| Sep 2025 | 5 | 0 | 0 | 5 |
| Aug 2025 | 5 | 0 | 0 | 5 |
| Jul 2025 | 5 | 0 | 0 | 5 |
| Jun 2025 | 4 | 0 | 0 | 4 |
| May 2025 | 4 | 0 | 0 | 4 |
| Apr 2025 | 4 | 0 | 0 | 4 |
| Mar 2025 | 4 | 0 | 0 | 4 |
| Feb 2025 | 4 | 0 | 0 | 4 |
| Jan 2025 | 4 | 0 | 0 | 4 |
| Dec 2024 | 4 | 0 | 0 | 4 |
| Nov 2024 | 4 | 0 | 0 | 4 |
Source: CommoVision (commovision.com)
What each region has actually reported
Guyana: every reporting region we publish, largest first. What it has reported and how far it is complete. Rates are for each region's newest complete month, so they are comparable across regions even though the months differ.
| Region | Oil (Mbbl/d) | Gas produced (MMcf/d) | Complete through | Newest month reported |
|---|---|---|---|---|
| Guyana | 906.0 | 1,406.5 | 2026-09 | 2026-09 |
What we cover here
Each row names the grain a region’s production is held at. Where a source publishes at a coarser grain, the page says so.
| Data | Grain | Since | Benchmark |
|---|---|---|---|
| Guyana production | country + facility | 2019-12 | — |
Coverage rows for Guyana are regenerated at every build from the same catalog of sources the data is built from.
What the data shows
- Guyana produced 261.1 MMbbl of oil and 378.9 Bcf of natural gas in 2025.
- Guyana oil production reached its highest level on record in 2025 at 261.1 MMbbl.
- Guyana production is published per floating production vessel and as a national total. The offshore Stabroek development produces through a small number of floating production vessels.
Start a free trial
Watch supply move as soon as its sources publish, with forecasts on 1.1+ million producing wells. A real API and MCP access for AI tools are live, and the Portal is open.
Data use is subject to our Terms of Service.