
South America
South America produced 2.75 Bbbl of oil and 4.97 Tcf of natural gas in 2025. 33,032 producing wells tracked, trailing 12 months per region.
- Oil production rose 9% in 2025 from 2024.
Production
All from what the source published. 37.6% held at well grain.
How the volume breaks down
- 37.6% Reported by the official source by well
- 62.4% Reported by the official source as a lease, facility, field or state total. Published without per-well detail.
- under 0.01% A series adjusted so a total meets a published figure: a well's own cumulative from the official source, or a state's yearly total from a second official source.
Every barrel here starts from what the official source published for the months measured. Measured over January 1945 to May 2026.
The gray “without per-well detail” band is volume the source reports above the well: fields, facilities, or leases the source publishes as one total. It is included so the stack still sums to the whole entity.
All from what the source published. 85.8% held at well grain.
How the volume breaks down
- 85.8% Reported by the official source by well
- 14.2% Reported by the official source as a lease, facility, field or state total. Published without per-well detail.
- under 0.01% A series adjusted so a total meets a published figure: a well's own cumulative from the official source, or a state's yearly total from a second official source.
Every cubic foot here starts from what the official source published for the months measured. Measured over January 1945 to May 2026.
The gray “without per-well detail” band is volume the source reports above the well: fields, facilities, or leases the source publishes as one total. It is included so the stack still sums to the whole entity.
Gas figures for 5 countries stopped arriving, the latest of them after December 2024. The charts hold every month of their gas back until the feed is repaired. Their oil keeps arriving and stays in view.
The bands group wells by when they first produced.
About this chart
The stack shows what is holding today's rate up and how much of it is new drilling. The bands draw the filings already in.
Annual table (full history)
best estimate incl. unsplit totals
| Year | Oil (MMbbl) | Gas produced (Bcf) |
|---|---|---|
| 2025 | 2,745.6 | 4,969 |
| 2024 | 2,513.6 | 4,575 |
| 2023 | 2,150.9 | 4,055 |
| 2022 | 2,165.0 | 4,224 |
| 2021 | 1,983.8 | 4,079 |
| 2020 | 1,969.3 | 4,013 |
| 2019 | 2,083.4 | 4,090 |
| 2018 | 2,212.4 | 3,947 |
| 2017 | 2,408.4 | 3,836 |
| 2016 | 2,496.9 | 3,833 |
| 2015 | 2,608.9 | 3,611 |
| 2014 | 2,550.7 | 3,517 |
| 2013 | 2,460.1 | 3,512 |
| 2012 | 2,104.4 | 2,470 |
| 2011 | 2,113.7 | 2,458 |
| 2010 | 2,071.0 | 2,474 |
| 2009 | 1,899.7 | 2,457 |
| 2008 | 1,857.2 | 2,550 |
| 2007 | 1,943.7 | 2,429 |
| 2006 | 1,930.1 | 2,457 |
| 2005 | 1,684.0 | 319 |
| 2004 | 1,531.0 | 83 |
| 2003 | 1,441.6 | 275 |
| 2002 | 1,473.5 | 549 |
| 2001 | 1,550.8 | 494 |
| 2000 | 1,561.8 | 468 |
| 1999 | 1,474.5 | 419 |
| 1998 | 1,556.3 | 381 |
| 1997 | 1,529.4 | 347 |
| 1996 | 1,425.0 | 325 |
| 1995 | 1,319.4 | 284 |
| 1994 | 1,198.9 | 273 |
| 1993 | 1,136.3 | 260 |
| 1992 | 1,141.9 | 247 |
| 1991 | 1,154.2 | 235 |
| 1990 | 1,075.0 | 223 |
| 1989 | 976.4 | 218 |
| 1988 | 969.9 | 215 |
| 1987 | 924.5 | 210 |
| 1986 | 946.3 | 201 |
| 1985 | 902.9 | 193 |
| 1984 | 886.6 | 172 |
| 1983 | 778.4 | 142 |
| 1982 | 787.2 | 108 |
| 1981 | 845.8 | 89 |
| 1980 | 860.6 | 77 |
| 1979 | 921.3 | 68 |
| 1978 | 849.6 | 68 |
| 1977 | 876.1 | 64 |
| 1976 | 901.4 | 62 |
| 1975 | 919.8 | 57 |
| 1974 | 1,152.0 | 53 |
| 1973 | 1,291.7 | 42 |
| 1972 | 61.8 | 43 |
| 1971 | 62.9 | 41 |
| 1970 | 60.8 | 44 |
| 1969 | 63.9 | 44 |
| 1968 | 59.1 | 35 |
| 1967 | 53.8 | 31 |
| 1966 | 42.4 | 28 |
| 1965 | 34.3 | 24 |
| 1964 | 33.3 | 18 |
| 1963 | 35.7 | 18 |
| 1962 | 33.2 | 17 |
| 1961 | 34.6 | 18 |
| 1960 | 29.4 | 18 |
| 1959 | 23.3 | 14 |
| 1958 | 18.7 | 9 |
| 1957 | 10.0 | 5 |
| 1956 | 4.0 | 3 |
| 1955 | 2.0 | 2 |
| 1954 | 1.0 | 2 |
| 1953 | 0.9 | 1 |
| 1952 | 0.7 | <1 |
| 1951 | 0.6 | <1 |
| 1950 | 0.3 | 1 |
| 1949 | 0.1 | <1 |
| 1948 | 0.1 | <1 |
| 1947 | 0.1 | <1 |
| 1946 | 0.1 | <1 |
| 1945 | 0.1 | <1 |
Source: CommoVision (commovision.com)
Monthly table (last 24 months)
| Month | Oil (Mbbl) | Gas produced (MMcf) |
|---|---|---|
| 2026-05 | 263,937.2 | 475,378 |
| 2026-04 | 252,001.4 | 413,381 |
| 2026-03 | 259,061.3 | 456,952 |
| 2026-02 | 226,718.9 | 404,071 |
| 2026-01 | 243,759.5 | 434,240 |
| 2025-12 | 248,593.2 | 433,336 |
| 2025-11 | 234,197.0 | 398,590 |
| 2025-10 | 248,389.9 | 425,531 |
| 2025-09 | 234,683.6 | 419,829 |
| 2025-08 | 238,475.3 | 448,594 |
| 2025-07 | 228,960.1 | 452,834 |
| 2025-06 | 224,072.3 | 429,610 |
| 2025-05 | 228,277.6 | 421,513 |
| 2025-04 | 216,647.1 | 387,109 |
| 2025-03 | 224,227.9 | 395,398 |
| 2025-02 | 199,678.3 | 362,584 |
| 2025-01 | 219,382.2 | 394,335 |
| 2024-12 | 218,159.8 | 382,171 |
| 2024-11 | 206,480.9 | 368,231 |
| 2024-10 | 213,260.3 | 388,962 |
| 2024-09 | 210,798.1 | 402,464 |
| 2024-08 | 213,613.5 | 410,973 |
| 2024-07 | 202,679.2 | 390,652 |
| 2024-06 | 206,730.3 | 381,753 |
Source: CommoVision (commovision.com)
Source: CommoVision · South America, data through May 2026.
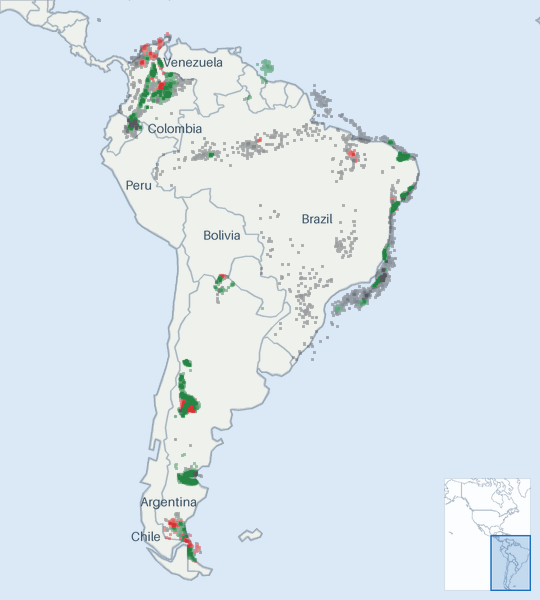
Well map
- Oil 93,994
- Natural gas 10,980
- Undetermined 34,267
About this map
Undetermined means not enough signal to settle it. Producing wells are the ones that reported oil or gas in the trailing 12 months per region.
Top operators in South America, 2025 best estimate incl. unsplit totals
Top operators in South America, 2025: full table
| Operator | Oil (Mbbl/d, 2025) | Gas produced (MMcf/d, 2025) | Share of output |
|---|---|---|---|
| Petrobras | 3,405.0 | 5,789.6 | 45.0% |
| ExxonMobil | 715.4 | 0.0 | 8.5% |
| Ecopetrol S.A. | 466.9 | 892.4 | 6.2% |
| YPF S.A. | 368.7 | 1,134.7 | 5.3% |
| EP Petroecuador | 349.1 | 0.0 | 4.1% |
| Pan American Energy | 106.8 | 563.7 | 1.7% |
| TotalEnergies Austral S.A. | 10.0 | 1,193.5 | 1.1% |
| Prio S.A. | 85.6 | 39.0 | 1.0% |
| Tecpetrol S.A. | 31.7 | 668.7 | 0.9% |
| Vista Energy | 68.9 | 44.6 | 0.9% |
| 142 other operators | 865.6 | 2,250.1 | 12.0% |
| Without a named operator | 1,048.5 | 1,038.1 | 13.3% |
Mbbl/d = thousand barrels per day · MMcf/d = million cubic feet per day (units).
Source: CommoVision (commovision.com)
Countries by 2025 production best estimate incl. unsplit totals
| Country | Oil (MMbbl) | Gas produced (Bcf) | Share of 2025 output |
|---|---|---|---|
| Brazil | 1375.2 | 2309.1 | 49.7% |
| Argentina | 293.3 | 1822 | 13.5% |
| Venezuela | 355 | — | 11.5% |
| Colombia | 272.5 | 459.2 | 9.9% |
| Guyana | 261.1 | 378.9 | 9.3% |
| Ecuador | 160.9 | — | 5.2% |
| Peru | 16.1 | — | 0.5% |
| Bolivia | 6.4 | — | 0.2% |
| Suriname | 4.4 | — | 0.1% |
| Chile | 0.7 | — | 0.0% |
Share of output counts oil and gas together, gas at its market-value weight.
— means no figure is published for that period.
What each region has actually reported
South America: every reporting region we publish, largest first. What it has reported and how far it is complete. Rates are for each region's newest complete month, so they are comparable across regions even though the months differ.
| Region | Oil (Mbbl/d) | Gas produced (MMcf/d) | Complete through | Newest month reported |
|---|---|---|---|---|
| Brazil | 4,472.5 | 7,671.9 | 2026-06 | 2026-07 |
| Argentina | 915.6 | 5,581.7 | 2026-07 | 2026-08 |
| Venezuela | 1,160.0 | — | 2026-05 | 2026-05 |
| Guyana | 885.6 | 1,376.3 | 2026-07 | 2026-07 |
| Colombia | 727.9 | 1,096.0 | 2026-07 | 2026-07 |
| Ecuador | 459.9 | — | 2026-06 | 2026-08 |
| Peru | 36.5 | — | 2026-05 | 2026-05 |
| Bolivia | 18.5 | — | 2026-05 | 2026-05 |
| Suriname | 11.9 | — | 2026-05 | 2026-05 |
| Chile | 1.9 | — | 2026-05 | 2026-05 |
What we cover here
Each row names the grain a region’s production is held at. Where a source publishes at a coarser grain, the page says so.
| Data | Grain | Since | Benchmark |
|---|---|---|---|
| Brazil production | well | 1941-12 | — |
| Argentina production | well | 2006-01 | — |
| Venezuela production | national total | 1973-01 | — |
| Colombia production | field | 2013-01 | — |
| Guyana production | country + facility | 2019-12 | — |
| Ecuador production | block + field + operator | 2010-01 | — |
| Peru production | national total | 1980-01 | — |
| Bolivia production | national total | 1980-01 | — |
| Suriname production | national total | 1980-01 | — |
| Chile production | national total | 1980-01 | — |
Coverage rows for South America are regenerated at every build from the same catalog of sources the data is built from.
What the data shows
- South America produced 2.75 Bbbl of oil and 4.97 Tcf of natural gas in 2025.
- South America oil production reached its highest level on record in 2025 at 2.75 Bbbl.
- 33,032 producing wells tracked, trailing 12 months per region.
- Brazil was the largest oil producer in South America in 2025 at 1.38 Bbbl, 50% of the continent's oil.
- Brazil was the largest natural gas producer in South America in 2025 at 2.31 Tcf, 46% of the continent's natural gas.
Get early access
Watch supply move as soon as its sources publish, with forecasts on 1.1+ million producing wells. The portal, an API and MCP access for AI tools open on October 1, 2026.
Data use is subject to our Terms of Service.