CommoVision

See the future in real time

Custer County, Oklahoma

Custer County, Oklahoma produced 3.6 MMbbl of oil and 110.6 Bcf of natural gas in 2025. 1,095 producing wells tracked, 12 months to Jun 2026.

  • Eighth-largest gas-producing county in Oklahoma, 2025.
  • 4.2% of the natural gas produced in Oklahoma, 2025.
  • Natural gas production rose 8% in 2025 from 2024.
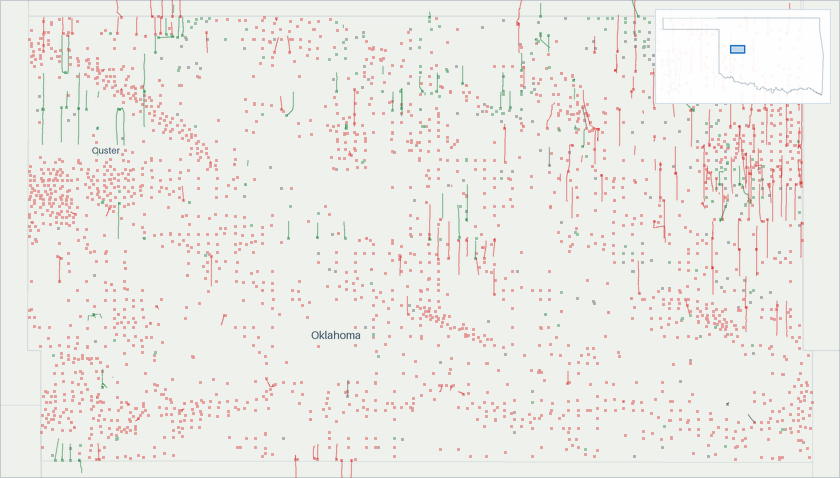
Well map of Custer County, Oklahoma. The full map is further down this page.

Production

Custer County, Oklahoma natural gas production (MMcf/d, grouped by when each well first produced)
  • filling in (est. · missed) . Hatching marks our estimate of the volume still to be filed. That estimate draws on our own production forecast. A check on the forecast behind this estimate measured a miss. It updates as filings arrive
Custer County, Oklahoma natural gas production: million cubic feet per day, by first-production vintage filed in full today 200400600800 MMcf/d 2017201820192020202120222023202420252026 Aug 2016: 120 MMcf/d total Sep 2016: 113 MMcf/d total Oct 2016: 105 MMcf/d total Nov 2016: 111 MMcf/d total Dec 2016: 123 MMcf/d total Jan 2017: 148 MMcf/d total Feb 2017: 172 MMcf/d total Mar 2017: 178 MMcf/d total Apr 2017: 173 MMcf/d total May 2017: 170 MMcf/d total Jun 2017: 186 MMcf/d total Jul 2017: 191 MMcf/d total Aug 2017: 198 MMcf/d total Sep 2017: 180 MMcf/d total Oct 2017: 192 MMcf/d total Nov 2017: 228 MMcf/d total Dec 2017: 256 MMcf/d total Jan 2018: 252 MMcf/d total Feb 2018: 276 MMcf/d total Mar 2018: 249 MMcf/d total Apr 2018: 260 MMcf/d total May 2018: 221 MMcf/d total Jun 2018: 263 MMcf/d total Jul 2018: 332 MMcf/d total Aug 2018: 325 MMcf/d total Sep 2018: 320 MMcf/d total Oct 2018: 311 MMcf/d total Nov 2018: 353 MMcf/d total Dec 2018: 364 MMcf/d total Jan 2019: 364 MMcf/d total Feb 2019: 357 MMcf/d total Mar 2019: 348 MMcf/d total Apr 2019: 316 MMcf/d total May 2019: 357 MMcf/d total Jun 2019: 359 MMcf/d total Jul 2019: 362 MMcf/d total Aug 2019: 353 MMcf/d total Sep 2019: 342 MMcf/d total Oct 2019: 337 MMcf/d total Nov 2019: 340 MMcf/d total Dec 2019: 355 MMcf/d total Jan 2020: 337 MMcf/d total Feb 2020: 321 MMcf/d total Mar 2020: 325 MMcf/d total Apr 2020: 307 MMcf/d total May 2020: 296 MMcf/d total Jun 2020: 282 MMcf/d total Jul 2020: 212 MMcf/d total Aug 2020: 206 MMcf/d total Sep 2020: 293 MMcf/d total Oct 2020: 251 MMcf/d total Nov 2020: 289 MMcf/d total Dec 2020: 280 MMcf/d total Jan 2021: 278 MMcf/d total Feb 2021: 223 MMcf/d total Mar 2021: 269 MMcf/d total Apr 2021: 258 MMcf/d total May 2021: 251 MMcf/d total Jun 2021: 221 MMcf/d total Jul 2021: 259 MMcf/d total Aug 2021: 276 MMcf/d total Sep 2021: 265 MMcf/d total Oct 2021: 254 MMcf/d total Nov 2021: 250 MMcf/d total Dec 2021: 253 MMcf/d total Jan 2022: 230 MMcf/d total Feb 2022: 221 MMcf/d total Mar 2022: 224 MMcf/d total Apr 2022: 243 MMcf/d total May 2022: 243 MMcf/d total Jun 2022: 315 MMcf/d total Jul 2022: 343 MMcf/d total Aug 2022: 310 MMcf/d total Sep 2022: 290 MMcf/d total Oct 2022: 279 MMcf/d total Nov 2022: 260 MMcf/d total Dec 2022: 236 MMcf/d total Jan 2023: 264 MMcf/d total Feb 2023: 288 MMcf/d total Mar 2023: 286 MMcf/d total Apr 2023: 329 MMcf/d total May 2023: 349 MMcf/d total Jun 2023: 348 MMcf/d total Jul 2023: 348 MMcf/d total Aug 2023: 355 MMcf/d total Sep 2023: 343 MMcf/d total Oct 2023: 347 MMcf/d total Nov 2023: 343 MMcf/d total Dec 2023: 340 MMcf/d total Jan 2024: 323 MMcf/d total Feb 2024: 316 MMcf/d total Mar 2024: 271 MMcf/d total Apr 2024: 272 MMcf/d total May 2024: 299 MMcf/d total Jun 2024: 284 MMcf/d total Jul 2024: 282 MMcf/d total Aug 2024: 270 MMcf/d total Sep 2024: 261 MMcf/d total Oct 2024: 256 MMcf/d total Nov 2024: 253 MMcf/d total Dec 2024: 273 MMcf/d total Jan 2025: 273 MMcf/d total Feb 2025: 267 MMcf/d total Mar 2025: 270 MMcf/d total Apr 2025: 263 MMcf/d total May 2025: 258 MMcf/d total Jun 2025: 257 MMcf/d total Jul 2025: 257 MMcf/d total Aug 2025: 258 MMcf/d total Sep 2025: 263 MMcf/d total Oct 2025: 301 MMcf/d total Nov 2025: 381 MMcf/d total Dec 2025: 583 MMcf/d total Jan 2026: 618 MMcf/d total Feb 2026: 555 MMcf/d total Mar 2026: 555 MMcf/d total Apr 2026: 515 MMcf/d total May 2026: 474 MMcf/d total Jun 2026: 464 MMcf/d total Jul 2026: ≈463 MMcf/d total (5% arrived, remainder estimated)

Still arriving: Aug 2026 <1% filed.

All from what the source published. All held at well grain.

How the volume breaks down
  • 53.9% Reported by the official source by well
  • 46.1% Reported by the official source as a lease total, split across the lease's wells. The regional total shown is the reported number, to rounding.

Every cubic foot through June 2026 starts from what the official source published for those months. Measured over January 1990 to June 2026.

Custer County, Oklahoma oil production (Mbbl/d, grouped by when each well first produced)
  • filling in (est. · missed) . Hatching marks our estimate of the volume still to be filed. That estimate draws on our own production forecast. A check on the forecast behind this estimate measured a miss. It updates as filings arrive
Custer County, Oklahoma oil production: thousand barrels per day, by first-production vintage filed in full 5101520 Mbbl/d 2017201820192020202120222023202420252026 Oct 2016: 2.61 Mbbl/d total Nov 2016: 2.29 Mbbl/d total Dec 2016: 2.83 Mbbl/d total Jan 2017: 2.63 Mbbl/d total Feb 2017: 2.82 Mbbl/d total Mar 2017: 2.72 Mbbl/d total Apr 2017: 2.5 Mbbl/d total May 2017: 2.6 Mbbl/d total Jun 2017: 3.44 Mbbl/d total Jul 2017: 3.18 Mbbl/d total Aug 2017: 3.03 Mbbl/d total Sep 2017: 3.35 Mbbl/d total Oct 2017: 3.14 Mbbl/d total Nov 2017: 3.21 Mbbl/d total Dec 2017: 3.5 Mbbl/d total Jan 2018: 2.86 Mbbl/d total Feb 2018: 2.69 Mbbl/d total Mar 2018: 2.85 Mbbl/d total Apr 2018: 2.48 Mbbl/d total May 2018: 3 Mbbl/d total Jun 2018: 3.2 Mbbl/d total Jul 2018: 3.27 Mbbl/d total Aug 2018: 3.19 Mbbl/d total Sep 2018: 3.6 Mbbl/d total Oct 2018: 3.94 Mbbl/d total Nov 2018: 3.66 Mbbl/d total Dec 2018: 3.48 Mbbl/d total Jan 2019: 3.01 Mbbl/d total Feb 2019: 2.85 Mbbl/d total Mar 2019: 3.22 Mbbl/d total Apr 2019: 2.68 Mbbl/d total May 2019: 2.83 Mbbl/d total Jun 2019: 2.98 Mbbl/d total Jul 2019: 5.38 Mbbl/d total Aug 2019: 8.3 Mbbl/d total Sep 2019: 7.16 Mbbl/d total Oct 2019: 6.64 Mbbl/d total Nov 2019: 6.57 Mbbl/d total Dec 2019: 6.25 Mbbl/d total Jan 2020: 5.27 Mbbl/d total Feb 2020: 4.8 Mbbl/d total Mar 2020: 3.76 Mbbl/d total Apr 2020: 3.16 Mbbl/d total May 2020: 2.32 Mbbl/d total Jun 2020: 2.84 Mbbl/d total Jul 2020: 3.16 Mbbl/d total Aug 2020: 2.87 Mbbl/d total Sep 2020: 3.84 Mbbl/d total Oct 2020: 3.32 Mbbl/d total Nov 2020: 3.4 Mbbl/d total Dec 2020: 3.23 Mbbl/d total Jan 2021: 2.95 Mbbl/d total Feb 2021: 2.91 Mbbl/d total Mar 2021: 4.06 Mbbl/d total Apr 2021: 3.7 Mbbl/d total May 2021: 3.19 Mbbl/d total Jun 2021: 3.03 Mbbl/d total Jul 2021: 2.78 Mbbl/d total Aug 2021: 2.81 Mbbl/d total Sep 2021: 3.05 Mbbl/d total Oct 2021: 4.09 Mbbl/d total Nov 2021: 3.99 Mbbl/d total Dec 2021: 3.57 Mbbl/d total Jan 2022: 3.1 Mbbl/d total Feb 2022: 2.85 Mbbl/d total Mar 2022: 3.18 Mbbl/d total Apr 2022: 3.65 Mbbl/d total May 2022: 3.45 Mbbl/d total Jun 2022: 3.02 Mbbl/d total Jul 2022: 4.08 Mbbl/d total Aug 2022: 3.72 Mbbl/d total Sep 2022: 2.59 Mbbl/d total Oct 2022: 3.08 Mbbl/d total Nov 2022: 2.86 Mbbl/d total Dec 2022: 2.51 Mbbl/d total Jan 2023: 2.65 Mbbl/d total Feb 2023: 2.56 Mbbl/d total Mar 2023: 2.77 Mbbl/d total Apr 2023: 2.46 Mbbl/d total May 2023: 2.68 Mbbl/d total Jun 2023: 2.59 Mbbl/d total Jul 2023: 3.01 Mbbl/d total Aug 2023: 3.08 Mbbl/d total Sep 2023: 3.06 Mbbl/d total Oct 2023: 2.79 Mbbl/d total Nov 2023: 3.43 Mbbl/d total Dec 2023: 3.73 Mbbl/d total Jan 2024: 4.15 Mbbl/d total Feb 2024: 4.13 Mbbl/d total Mar 2024: 3.69 Mbbl/d total Apr 2024: 3.97 Mbbl/d total May 2024: 4.41 Mbbl/d total Jun 2024: 5.7 Mbbl/d total Jul 2024: 5.5 Mbbl/d total Aug 2024: 6.35 Mbbl/d total Sep 2024: 5.5 Mbbl/d total Oct 2024: 5.21 Mbbl/d total Nov 2024: 4.52 Mbbl/d total Dec 2024: 6.07 Mbbl/d total Jan 2025: 6.97 Mbbl/d total Feb 2025: 8.09 Mbbl/d total Mar 2025: 7.72 Mbbl/d total Apr 2025: 7.87 Mbbl/d total May 2025: 8.04 Mbbl/d total Jun 2025: 7.92 Mbbl/d total Jul 2025: 8.2 Mbbl/d total Aug 2025: 10.1 Mbbl/d total Sep 2025: 14.1 Mbbl/d total Oct 2025: 12.3 Mbbl/d total Nov 2025: 12.3 Mbbl/d total Dec 2025: 14.7 Mbbl/d total Jan 2026: 16.9 Mbbl/d total Feb 2026: 15.6 Mbbl/d total Mar 2026: 14.2 Mbbl/d total Apr 2026: 12.7 Mbbl/d total May 2026: 12.5 Mbbl/d total Jun 2026: 15 Mbbl/d total Jul 2026: ≈15.1 Mbbl/d total (5% arrived, remainder estimated) Aug 2026: ≈14.7 Mbbl/d total (<1% arrived, remainder estimated) Sep 2026: ≈14.5 Mbbl/d total (<1% arrived, remainder estimated)

All from what the source published. All held at well grain.

How the volume breaks down
  • 56.2% Reported by the official source by well
  • 43.8% Reported by the official source as a lease total, split across the lease's wells. The regional total shown is the reported number, to rounding.

Every barrel through June 2026 starts from what the official source published for those months. Measured over January 1990 to June 2026.

The bands group wells by when they first produced.

About this chart

The stack shows what is holding today's rate up and how much of it is new drilling. In the reported months the bands draw the filings already in. The months still filling in are marked.

Annual table (full history)

best estimate incl. allocated

YearOil (MMbbl)Gas produced (Bcf)
20253.6111
20241.8102
20231.1120
20221.297
20211.293
20201.3104
20191.8127
20181.2107
20171.169
20160.940
20150.929
20141.030
20130.737
20120.637
20110.742
20100.647
20090.649
20080.756
20070.657
20060.662
20050.563
20040.666
20030.667
20020.665
20010.468
20000.571
19990.271
19980.271
19970.175
19960.175
19950.179
19940.194
19930.2104
19920.289
19910.196
19900.152

Source: CommoVision (commovision.com)

Monthly table (last 24 months)
MonthOil (Mbbl)Gas produced (MMcf)
2026-06449.913,932
2026-05386.014,696
2026-04380.015,442
2026-03438.917,202
2026-02437.815,549
2026-01524.619,145
2025-12456.118,062
2025-11367.611,442
2025-10382.29,339
2025-09424.27,904
2025-08311.87,998
2025-07254.27,964
2025-06237.67,717
2025-05249.37,987
2025-04236.07,893
2025-03239.48,363
2025-02226.67,479
2025-01216.18,457
2024-12188.18,466
2024-11135.77,579
2024-10161.57,927
2024-09164.97,823
2024-08196.88,361
2024-07170.48,752

Source: CommoVision (commovision.com)

Source: CommoVision · Custer County, Oklahoma, data through July 2026.

Well map

A map of 2,715 well locations in Custer County, Oklahoma for which CommoVision holds a published surface coordinate, each drawn where it is and colored by its primary product (green for oil, red for natural gas, gray where undetermined; a spot shared by more than one product shows the one with the most wells there), on a ground of land and water over faint county outlines and place names for orientation, with the drilled wellbore path traced for 288 wells, with a small inset map locating this frame in Oklahoma.
  • Oil 234
  • Natural gas 2,261
  • Undetermined 220
2,715 well locations in Custer County, Oklahoma, colored by primary product. The drilled path is traced for 288 wells from the directional surveys we hold.
About this map

Undetermined means not enough signal to settle it. Producing wells are the ones that reported oil or gas in the 12 months to Jun 2026.

15 Mbbl/d Jun 2026 oil production +89.3% vs Jun last year best estimate incl. allocated
464.4 MMcf/d Jun 2026 gas production +80.5% vs Jun last year best estimate incl. allocated
9.9 Mbbl/d 2025 oil production best estimate incl. allocated
303 MMcf/d 2025 gas production best estimate incl. allocated
1,095 wells Producing wells tracked 12 months to Jun 2026

Type curves

Custer County, Oklahoma natural gas type curves (Mcf/d per well, log scale, against months on production; cohorts 2010–2025)
Custer County, Oklahoma natural gas type curves: average thousand cubic feet per day per well on a log scale against months on production 2010-2014: 65 wells; starts at 463 Mcf/d per well, 0.5 Bcf cumulative through month 139 (100% of its wells old enough at that month); the dashed curve runs through month 199, on our forecast where a well’s own record ends2015: 13 wells; starts at 278 Mcf/d per well, 1.6 Bcf cumulative through month 127 (100% of its wells old enough at that month); the dashed curve runs through month 187, on our forecast where a well’s own record ends2016: 12 wells; starts at 1,122 Mcf/d per well, 4.6 Bcf cumulative through month 115 (100% of its wells old enough at that month); the dashed curve runs through month 175, on our forecast where a well’s own record ends2017: 22 wells; starts at 1,440 Mcf/d per well, 6.1 Bcf cumulative through month 103 (100% of its wells old enough at that month); the dashed curve runs through month 163, on our forecast where a well’s own record ends2018: 34 wells; starts at 3,758 Mcf/d per well, 5.9 Bcf cumulative through month 91 (100% of its wells old enough at that month); the dashed curve runs through month 151, on our forecast where a well’s own record ends2019: 27 wells; starts at 2,604 Mcf/d per well, 4.3 Bcf cumulative through month 80 (100% of its wells old enough at that month); the dashed curve runs through month 140, on our forecast where a well’s own record ends2020: 8 wells; starts at 1,425 Mcf/d per well, 5.2 Bcf cumulative through month 69 (100% of its wells old enough at that month); the dashed curve runs through month 129, on our forecast where a well’s own record ends2021: 7 wells; starts at 2,891 Mcf/d per well, 5.7 Bcf cumulative through month 55 (100% of its wells old enough at that month); the dashed curve runs through month 115, on our forecast where a well’s own record ends2022: 7 wells; starts at 1,636 Mcf/d per well, 4.5 Bcf cumulative through month 47 (100% of its wells old enough at that month); the dashed curve runs through month 107, on our forecast where a well’s own record ends2023: 13 wells; starts at 3,915 Mcf/d per well, 4.7 Bcf cumulative through month 31 (100% of its wells old enough at that month); the dashed curve runs through month 91, on our forecast where a well’s own record ends2024: 11 wells; starts at 2,397 Mcf/d per well, 1.4 Bcf cumulative through month 19 (100% of its wells old enough at that month); the dashed curve runs through month 79, on our forecast where a well’s own record ends2025: 48 wells; starts at 4,013 Mcf/d per well, 1.4 Bcf cumulative through month 7 (100% of its wells old enough at that month); the dashed curve runs through month 67, on our forecast where a well’s own record ends201001,00010,000Mcf/d24487296120144168192216Months on production
Custer County, Oklahoma oil type curves (bbl/d per well, log scale, against months on production; cohorts 2010–2025)
Custer County, Oklahoma oil type curves: average barrels per day per well on a log scale against months on production 2010-2014: 65 wells; starts at 60.3 bbl/d per well, 41.3 Mbbl cumulative through month 139 (100% of its wells old enough at that month); the dashed curve runs through month 199, on our forecast where a well’s own record ends2015: 13 wells; starts at 78.4 bbl/d per well, 117 Mbbl cumulative through month 127 (100% of its wells old enough at that month); the dashed curve runs through month 187, on our forecast where a well’s own record ends2016: 12 wells; starts at 5.6 bbl/d per well, 22.1 Mbbl cumulative through month 115 (100% of its wells old enough at that month); the dashed curve runs through month 175, on our forecast where a well’s own record ends2017: 22 wells; starts at 14.7 bbl/d per well, 37.3 Mbbl cumulative through month 103 (100% of its wells old enough at that month); the dashed curve runs through month 163, on our forecast where a well’s own record ends2018: 34 wells; starts at 18.9 bbl/d per well, 28.1 Mbbl cumulative through month 91 (100% of its wells old enough at that month); the dashed curve runs through month 151, on our forecast where a well’s own record ends2019: 27 wells; starts at 107 bbl/d per well, 98.9 Mbbl cumulative through month 80 (100% of its wells old enough at that month); the dashed curve runs through month 140, on our forecast where a well’s own record ends2020: 8 wells; starts at 21.4 bbl/d per well, 22.9 Mbbl cumulative through month 69 (100% of its wells old enough at that month); the dashed curve runs through month 129, on our forecast where a well’s own record ends2021: 7 wells; starts at 74.4 bbl/d per well, 95.9 Mbbl cumulative through month 55 (100% of its wells old enough at that month); the dashed curve runs through month 115, on our forecast where a well’s own record ends2022: 7 wells; starts at 24.8 bbl/d per well, 61.4 Mbbl cumulative through month 47 (100% of its wells old enough at that month); the dashed curve runs through month 107, on our forecast where a well’s own record ends2023: 13 wells; starts at 63 bbl/d per well, 82.6 Mbbl cumulative through month 31 (100% of its wells old enough at that month); the dashed curve runs through month 91, on our forecast where a well’s own record ends2024: 11 wells; starts at 232 bbl/d per well, 126 Mbbl cumulative through month 19 (100% of its wells old enough at that month); the dashed curve runs through month 79, on our forecast where a well’s own record ends2025: 48 wells; starts at 205 bbl/d per well, 55.6 Mbbl cumulative through month 7 (100% of its wells old enough at that month); the dashed curve runs through month 67, on our forecast where a well’s own record ends0.2110100700bbl/d24487296120144168192216Months on production

best estimate incl. allocated

Horizontal wells only. Average production per well, for wells grouped by when they first produced.

How these curves are built

Horizontal wells only: 267 of the 296 wells in these cohorts. Average daily production per well, for wells grouped by when they first produced. Includes every well of the cohort that is old enough at each month. Wells that are shut in or have stopped producing count as zero, so the average reflects the full cohort, not just survivors. Rates are calendar-day (volume ÷ days in month). The cumulative axis accumulates those same monthly averages at the average month length. Months not yet fully reported are excluded. The 2010-2014 curve draws those years as one group. The chart opens on average daily rate against months on production, the rate on a log scale. The view control switches to rate against cumulative production per well, on the same log rate scale, or to cumulative production per well against months on production, on a linear scale. Every view draws the same cohorts from the same production history. Each cohort is solid through the last month all of its wells sit inside fully reported data. Past it the dashed curve carries the same wells forward, on our forecast where a well’s own record ends, for up to five years. A dashed curve runs as far as at least nine in ten of its wells are accounted for. A well that is old enough but shut in still counts, as zero. The measured months are what these wells reported. In the forward months each well counts its own reported figure for each month it has one, our forecast for each month it has only that, and zero for the rest. The forward average counts every well of the cohort. The drawn forecast runs up to five years past the measured months. Line thickness tracks the size of each cohort. 2 wells are counted here but not shown on the age axis: they started producing in 1992 or earlier, too close to the start of our records for their region to verify their true age.

Cohort summary table
First produced Wells Peak oil (bbl/d per well) Month-12 oil (bbl/d per well) Cum oil in series (Mbbl per well) Peak gas (Mcf/d per well) Month-12 gas (Mcf/d per well) Cum gas in series (Bcf per well) Months in series Wells old enough at last month in series Forecast months drawn
2025 48 439 55.6 8,312 1.4 7 100% 60
2024 11 526 185 126 4,458 2,141 1.4 19 100% 60
2023 13 218 77.8 82.6 8,927 5,563 4.7 31 100% 60
2022 7 187 56 61.4 6,030 6,030 4.5 47 100% 60
2021 7 258 73.5 95.9 8,849 5,082 5.7 55 100% 60
2020 8 47.2 18.4 22.9 6,447 3,753 5.2 69 100% 60
2019 27 189 55.9 98.9 5,196 3,092 4.3 80 100% 60
2018 34 72 20.2 28.1 7,642 4,233 5.9 91 100% 60
2017 22 77.3 24.3 37.3 7,649 4,048 6.1 103 100% 60
2016 12 71.2 16 22.1 6,912 3,051 4.6 115 100% 60
2015 13 117 60.1 117 1,843 990 1.6 127 100% 60
2010-2014 65 104 26.1 41.3 774 275 0.5 139 100% 60

Source: CommoVision (commovision.com)

Source: CommoVision · Custer County, Oklahoma type curves, per-well production by first-production cohort.

Top operators in Custer County, Oklahoma, 2025 best estimate incl. allocated

  1. Mewbourne Oil Company 32.9%
  2. Continental Resources 23.3%
  3. Validus Energy 6.4%
  4. Nadel and Gussman, LLC 5.0%
  5. Mach Natural Resources LP 4.3%
  6. Diversified Energy Company 3.3%
  7. Devon Energy 2.9%
  8. Crawley Petroleum Corporation 2.8%
  9. Unit Corporation 2.5%
  10. Mid-Con Energy Operating 2.2%
  11. 82 other operators 14.4%
Top operators in Custer County, Oklahoma, 2025: full table
OperatorOil (Mbbl/d, 2025)Gas produced (MMcf/d, 2025)Share of output
Mewbourne Oil Company 6.452.232.9%
Continental Resources 0.1103.423.3%
Validus Energy 0.029.06.4%
Nadel and Gussman, LLC 0.712.05.0%
Mach Natural Resources LP 0.018.74.3%
Diversified Energy Company 0.113.23.3%
Devon Energy 0.63.42.9%
Crawley Petroleum Corporation 0.111.62.8%
Unit Corporation 0.37.22.5%
Mid-Con Energy Operating (March to December) 0.011.32.2%
82 other operators 1.542.914.4%

Mbbl/d = thousand barrels per day · MMcf/d = million cubic feet per day (units).

Source: CommoVision (commovision.com)

Active drilling rigs

7 rigs active in the week to September 11, 2026
+2 rigs vs the same week a year earlier
10 rigs peak week, May 2025 (since Sep 2016)
Active drilling rigs by rig type (rigs, weekly count)Source: Baker Hughes rig count
Oil Gas
Active drilling rigs by rig type: rigs, weekly count 2.5 5 7.5 10 12.5 rigs 2017201820192020202120222023202420252026 Week to Sep 16, 2016: 3 rigs total (Oil 3, Gas 0) Week to Sep 23, 2016: 3 rigs total (Oil 3, Gas 0) Week to Sep 30, 2016: 3 rigs total (Oil 3, Gas 0) Week to Oct 7, 2016: 3 rigs total (Oil 3, Gas 0) Week to Oct 14, 2016: 3 rigs total (Oil 3, Gas 0) Week to Oct 21, 2016: 3 rigs total (Oil 3, Gas 0) Week to Oct 28, 2016: 3 rigs total (Oil 3, Gas 0) Week to Nov 4, 2016: 2 rigs total (Oil 2, Gas 0) Week to Nov 11, 2016: 2 rigs total (Oil 2, Gas 0) Week to Nov 18, 2016: 2 rigs total (Oil 2, Gas 0) Week to Nov 23, 2016: 2 rigs total (Oil 2, Gas 0) Week to Dec 2, 2016: 2 rigs total (Oil 2, Gas 0) Week to Dec 9, 2016: 4 rigs total (Oil 4, Gas 0) Week to Dec 16, 2016: 4 rigs total (Oil 4, Gas 0) Week to Dec 23, 2016: 4 rigs total (Oil 4, Gas 0) Week to Dec 30, 2016: 4 rigs total (Oil 4, Gas 0) Week to Jan 6, 2017: 4 rigs total (Oil 4, Gas 0) Week to Jan 13, 2017: 3 rigs total (Oil 3, Gas 0) Week to Jan 20, 2017: 2 rigs total (Oil 2, Gas 0) Week to Jan 27, 2017: 3 rigs total (Oil 3, Gas 0) Week to Feb 3, 2017: 3 rigs total (Oil 3, Gas 0) Week to Feb 10, 2017: 3 rigs total (Oil 3, Gas 0) Week to Feb 17, 2017: 5 rigs total (Oil 5, Gas 0) Week to Feb 24, 2017: 5 rigs total (Oil 5, Gas 0) Week to Mar 3, 2017: 5 rigs total (Oil 5, Gas 0) Week to Mar 10, 2017: 4 rigs total (Oil 4, Gas 0) Week to Mar 17, 2017: 4 rigs total (Oil 4, Gas 0) Week to Mar 24, 2017: 4 rigs total (Oil 4, Gas 0) Week to Mar 31, 2017: 4 rigs total (Oil 4, Gas 0) Week to Apr 7, 2017: 0 rigs total (Oil 0, Gas 0) Week to Apr 13, 2017: 0 rigs total (Oil 0, Gas 0) Week to Apr 21, 2017: 1 rig total (Oil 1, Gas 0) Week to Apr 28, 2017: 1 rig total (Oil 1, Gas 0) Week to May 5, 2017: 1 rig total (Oil 1, Gas 0) Week to May 12, 2017: 1 rig total (Oil 1, Gas 0) Week to May 19, 2017: 1 rig total (Oil 1, Gas 0) Week to May 26, 2017: 1 rig total (Oil 1, Gas 0) Week to Jun 2, 2017: 1 rig total (Oil 1, Gas 0) Week to Jun 9, 2017: 1 rig total (Oil 1, Gas 0) Week to Jun 16, 2017: 1 rig total (Oil 1, Gas 0) Week to Jun 23, 2017: 2 rigs total (Oil 2, Gas 0) Week to Jun 30, 2017: 2 rigs total (Oil 2, Gas 0) Week to Jul 7, 2017: 5 rigs total (Oil 5, Gas 0) Week to Jul 14, 2017: 5 rigs total (Oil 5, Gas 0) Week to Jul 21, 2017: 5 rigs total (Oil 5, Gas 0) Week to Jul 28, 2017: 5 rigs total (Oil 5, Gas 0) Week to Aug 4, 2017: 5 rigs total (Oil 5, Gas 0) Week to Aug 11, 2017: 4 rigs total (Oil 4, Gas 0) Week to Aug 18, 2017: 4 rigs total (Oil 4, Gas 0) Week to Aug 25, 2017: 6 rigs total (Oil 6, Gas 0) Week to Sep 1, 2017: 7 rigs total (Oil 7, Gas 0) Week to Sep 8, 2017: 7 rigs total (Oil 7, Gas 0) Week to Sep 15, 2017: 7 rigs total (Oil 7, Gas 0) Week to Sep 22, 2017: 6 rigs total (Oil 6, Gas 0) Week to Sep 29, 2017: 6 rigs total (Oil 6, Gas 0) Week to Oct 6, 2017: 6 rigs total (Oil 6, Gas 0) Week to Oct 13, 2017: 5 rigs total (Oil 5, Gas 0) Week to Oct 20, 2017: 5 rigs total (Oil 5, Gas 0) Week to Oct 27, 2017: 4 rigs total (Oil 4, Gas 0) Week to Nov 3, 2017: 4 rigs total (Oil 4, Gas 0) Week to Nov 10, 2017: 4 rigs total (Oil 4, Gas 0) Week to Nov 17, 2017: 4 rigs total (Oil 4, Gas 0) Week to Nov 22, 2017: 4 rigs total (Oil 4, Gas 0) Week to Dec 1, 2017: 4 rigs total (Oil 4, Gas 0) Week to Dec 8, 2017: 4 rigs total (Oil 4, Gas 0) Week to Dec 15, 2017: 5 rigs total (Oil 5, Gas 0) Week to Dec 22, 2017: 5 rigs total (Oil 5, Gas 0) Week to Dec 29, 2017: 5 rigs total (Oil 5, Gas 0) Week to Jan 5, 2018: 5 rigs total (Oil 5, Gas 0) Week to Jan 12, 2018: 5 rigs total (Oil 5, Gas 0) Week to Jan 19, 2018: 4 rigs total (Oil 4, Gas 0) Week to Jan 26, 2018: 3 rigs total (Oil 3, Gas 0) Week to Feb 2, 2018: 3 rigs total (Oil 3, Gas 0) Week to Feb 9, 2018: 3 rigs total (Oil 3, Gas 0) Week to Feb 16, 2018: 3 rigs total (Oil 3, Gas 0) Week to Feb 23, 2018: 3 rigs total (Oil 3, Gas 0) Week to Mar 2, 2018: 3 rigs total (Oil 3, Gas 0) Week to Mar 9, 2018: 3 rigs total (Oil 3, Gas 0) Week to Mar 16, 2018: 4 rigs total (Oil 4, Gas 0) Week to Mar 23, 2018: 3 rigs total (Oil 3, Gas 0) Week to Mar 29, 2018: 3 rigs total (Oil 3, Gas 0) Week to Apr 6, 2018: 3 rigs total (Oil 3, Gas 0) Week to Apr 13, 2018: 3 rigs total (Oil 3, Gas 0) Week to Apr 20, 2018: 2 rigs total (Oil 2, Gas 0) Week to Apr 27, 2018: 3 rigs total (Oil 3, Gas 0) Week to May 4, 2018: 3 rigs total (Oil 3, Gas 0) Week to May 11, 2018: 4 rigs total (Oil 4, Gas 0) Week to May 18, 2018: 5 rigs total (Oil 5, Gas 0) Week to May 25, 2018: 5 rigs total (Oil 5, Gas 0) Week to Jun 1, 2018: 5 rigs total (Oil 5, Gas 0) Week to Jun 8, 2018: 6 rigs total (Oil 6, Gas 0) Week to Jun 15, 2018: 7 rigs total (Oil 7, Gas 0) Week to Jun 22, 2018: 6 rigs total (Oil 6, Gas 0) Week to Jun 29, 2018: 6 rigs total (Oil 6, Gas 0) Week to Jul 6, 2018: 6 rigs total (Oil 6, Gas 0) Week to Jul 13, 2018: 5 rigs total (Oil 5, Gas 0) Week to Jul 20, 2018: 3 rigs total (Oil 3, Gas 0) Week to Jul 27, 2018: 4 rigs total (Oil 4, Gas 0) Week to Aug 3, 2018: 5 rigs total (Oil 5, Gas 0) Week to Aug 10, 2018: 5 rigs total (Oil 5, Gas 0) Week to Aug 17, 2018: 6 rigs total (Oil 5, Gas 1) Week to Aug 24, 2018: 6 rigs total (Oil 5, Gas 1) Week to Aug 31, 2018: 5 rigs total (Oil 4, Gas 1) Week to Sep 7, 2018: 5 rigs total (Oil 4, Gas 1) Week to Sep 14, 2018: 5 rigs total (Oil 4, Gas 1) Week to Sep 21, 2018: 6 rigs total (Oil 5, Gas 1) Week to Sep 28, 2018: 6 rigs total (Oil 6, Gas 0) Week to Oct 5, 2018: 6 rigs total (Oil 6, Gas 0) Week to Oct 12, 2018: 6 rigs total (Oil 6, Gas 0) Week to Oct 19, 2018: 6 rigs total (Oil 6, Gas 0) Week to Oct 26, 2018: 6 rigs total (Oil 6, Gas 0) Week to Nov 2, 2018: 7 rigs total (Oil 7, Gas 0) Week to Nov 9, 2018: 7 rigs total (Oil 7, Gas 0) Week to Nov 16, 2018: 7 rigs total (Oil 7, Gas 0) Week to Nov 21, 2018: 6 rigs total (Oil 6, Gas 0) Week to Nov 30, 2018: 6 rigs total (Oil 6, Gas 0) Week to Dec 7, 2018: 6 rigs total (Oil 6, Gas 0) Week to Dec 14, 2018: 6 rigs total (Oil 6, Gas 0) Week to Dec 21, 2018: 5 rigs total (Oil 5, Gas 0) Week to Dec 28, 2018: 5 rigs total (Oil 5, Gas 0) Week to Jan 4, 2019: 5 rigs total (Oil 5, Gas 0) Week to Jan 11, 2019: 5 rigs total (Oil 5, Gas 0) Week to Jan 18, 2019: 3 rigs total (Oil 3, Gas 0) Week to Jan 25, 2019: 3 rigs total (Oil 3, Gas 0) Week to Feb 1, 2019: 2 rigs total (Oil 2, Gas 0) Week to Feb 8, 2019: 2 rigs total (Oil 2, Gas 0) Week to Feb 15, 2019: 2 rigs total (Oil 2, Gas 0) Week to Feb 22, 2019: 3 rigs total (Oil 3, Gas 0) Week to Mar 1, 2019: 3 rigs total (Oil 3, Gas 0) Week to Mar 8, 2019: 3 rigs total (Oil 3, Gas 0) Week to Mar 15, 2019: 3 rigs total (Oil 3, Gas 0) Week to Mar 22, 2019: 3 rigs total (Oil 3, Gas 0) Week to Mar 29, 2019: 3 rigs total (Oil 3, Gas 0) Week to Apr 5, 2019: 3 rigs total (Oil 3, Gas 0) Week to Apr 12, 2019: 3 rigs total (Oil 3, Gas 0) Week to Apr 18, 2019: 3 rigs total (Oil 3, Gas 0) Week to Apr 26, 2019: 4 rigs total (Oil 4, Gas 0) Week to May 3, 2019: 4 rigs total (Oil 4, Gas 0) Week to May 10, 2019: 4 rigs total (Oil 4, Gas 0) Week to May 17, 2019: 4 rigs total (Oil 4, Gas 0) Week to May 24, 2019: 4 rigs total (Oil 4, Gas 0) Week to May 31, 2019: 4 rigs total (Oil 4, Gas 0) Week to Jun 7, 2019: 4 rigs total (Oil 4, Gas 0) Week to Jun 14, 2019: 4 rigs total (Oil 4, Gas 0) Week to Jun 21, 2019: 3 rigs total (Oil 3, Gas 0) Week to Jun 28, 2019: 3 rigs total (Oil 3, Gas 0) Week to Jul 3, 2019: 3 rigs total (Oil 3, Gas 0) Week to Jul 12, 2019: 3 rigs total (Oil 3, Gas 0) Week to Jul 19, 2019: 3 rigs total (Oil 3, Gas 0) Week to Jul 26, 2019: 3 rigs total (Oil 3, Gas 0) Week to Aug 2, 2019: 1 rig total (Oil 1, Gas 0) Week to Aug 9, 2019: 3 rigs total (Oil 2, Gas 1) Week to Aug 16, 2019: 3 rigs total (Oil 2, Gas 1) Week to Aug 23, 2019: 3 rigs total (Oil 2, Gas 1) Week to Aug 30, 2019: 2 rigs total (Oil 1, Gas 1) Week to Sep 6, 2019: 2 rigs total (Oil 1, Gas 1) Week to Sep 13, 2019: 3 rigs total (Oil 2, Gas 1) Week to Sep 20, 2019: 3 rigs total (Oil 2, Gas 1) Week to Sep 27, 2019: 2 rigs total (Oil 2, Gas 0) Week to Oct 4, 2019: 2 rigs total (Oil 2, Gas 0) Week to Oct 11, 2019: 2 rigs total (Oil 2, Gas 0) Week to Oct 18, 2019: 2 rigs total (Oil 2, Gas 0) Week to Oct 25, 2019: 1 rig total (Oil 1, Gas 0) Week to Nov 1, 2019: 0 rigs total (Oil 0, Gas 0) Week to Nov 8, 2019: 0 rigs total (Oil 0, Gas 0) Week to Nov 15, 2019: 0 rigs total (Oil 0, Gas 0) Week to Nov 22, 2019: 0 rigs total (Oil 0, Gas 0) Week to Nov 27, 2019: 0 rigs total (Oil 0, Gas 0) Week to Dec 6, 2019: 0 rigs total (Oil 0, Gas 0) Week to Dec 13, 2019: 0 rigs total (Oil 0, Gas 0) Week to Dec 20, 2019: 0 rigs total (Oil 0, Gas 0) Week to Dec 27, 2019: 0 rigs total (Oil 0, Gas 0) Week to Jan 3, 2020: 0 rigs total (Oil 0, Gas 0) Week to Jan 10, 2020: 0 rigs total (Oil 0, Gas 0) Week to Jan 17, 2020: 0 rigs total (Oil 0, Gas 0) Week to Jan 24, 2020: 0 rigs total (Oil 0, Gas 0) Week to Jan 31, 2020: 1 rig total (Oil 1, Gas 0) Week to Feb 7, 2020: 1 rig total (Oil 1, Gas 0) Week to Feb 14, 2020: 1 rig total (Oil 1, Gas 0) Week to Feb 21, 2020: 1 rig total (Oil 1, Gas 0) Week to Feb 28, 2020: 0 rigs total (Oil 0, Gas 0) Week to Mar 6, 2020: 0 rigs total (Oil 0, Gas 0) Week to Mar 13, 2020: 0 rigs total (Oil 0, Gas 0) Week to Mar 20, 2020: 1 rig total (Oil 1, Gas 0) Week to Mar 27, 2020: 1 rig total (Oil 1, Gas 0) Week to Apr 3, 2020: 1 rig total (Oil 1, Gas 0) Week to Apr 9, 2020: 1 rig total (Oil 1, Gas 0) Week to Apr 17, 2020: 1 rig total (Oil 1, Gas 0) Week to Apr 24, 2020: 1 rig total (Oil 1, Gas 0) Week to May 1, 2020: 1 rig total (Oil 1, Gas 0) Week to May 8, 2020: 1 rig total (Oil 1, Gas 0) Week to May 15, 2020: 1 rig total (Oil 0, Gas 1) Week to May 22, 2020: 1 rig total (Oil 0, Gas 1) Week to May 29, 2020: 1 rig total (Oil 0, Gas 1) Week to Jun 5, 2020: 0 rigs total (Oil 0, Gas 0) Week to Jun 12, 2020: 0 rigs total (Oil 0, Gas 0) Week to Jun 19, 2020: 0 rigs total (Oil 0, Gas 0) Week to Jun 26, 2020: 0 rigs total (Oil 0, Gas 0) Week to Jul 2, 2020: 0 rigs total (Oil 0, Gas 0) Week to Jul 10, 2020: 0 rigs total (Oil 0, Gas 0) Week to Jul 17, 2020: 0 rigs total (Oil 0, Gas 0) Week to Jul 24, 2020: 1 rig total (Oil 1, Gas 0) Week to Jul 31, 2020: 1 rig total (Oil 1, Gas 0) Week to Aug 7, 2020: 1 rig total (Oil 1, Gas 0) Week to Aug 14, 2020: 1 rig total (Oil 1, Gas 0) Week to Aug 21, 2020: 1 rig total (Oil 1, Gas 0) Week to Aug 28, 2020: 1 rig total (Oil 1, Gas 0) Week to Sep 4, 2020: 1 rig total (Oil 1, Gas 0) Week to Sep 11, 2020: 1 rig total (Oil 1, Gas 0) Week to Sep 18, 2020: 1 rig total (Oil 1, Gas 0) Week to Sep 25, 2020: 1 rig total (Oil 1, Gas 0) Week to Oct 2, 2020: 1 rig total (Oil 1, Gas 0) Week to Oct 9, 2020: 1 rig total (Oil 1, Gas 0) Week to Oct 16, 2020: 0 rigs total (Oil 0, Gas 0) Week to Oct 23, 2020: 0 rigs total (Oil 0, Gas 0) Week to Oct 30, 2020: 0 rigs total (Oil 0, Gas 0) Week to Nov 6, 2020: 0 rigs total (Oil 0, Gas 0) Week to Nov 13, 2020: 0 rigs total (Oil 0, Gas 0) Week to Nov 20, 2020: 0 rigs total (Oil 0, Gas 0) Week to Nov 25, 2020: 0 rigs total (Oil 0, Gas 0) Week to Dec 4, 2020: 0 rigs total (Oil 0, Gas 0) Week to Dec 11, 2020: 1 rig total (Oil 1, Gas 0) Week to Dec 18, 2020: 1 rig total (Oil 1, Gas 0) Week to Dec 23, 2020: 1 rig total (Oil 1, Gas 0) Week to Dec 31, 2020: 1 rig total (Oil 1, Gas 0) Week to Jan 8, 2021: 0 rigs total (Oil 0, Gas 0) Week to Jan 15, 2021: 0 rigs total (Oil 0, Gas 0) Week to Jan 22, 2021: 0 rigs total (Oil 0, Gas 0) Week to Jan 29, 2021: 0 rigs total (Oil 0, Gas 0) Week to Feb 5, 2021: 0 rigs total (Oil 0, Gas 0) Week to Feb 12, 2021: 0 rigs total (Oil 0, Gas 0) Week to Feb 19, 2021: 0 rigs total (Oil 0, Gas 0) Week to Feb 26, 2021: 0 rigs total (Oil 0, Gas 0) Week to Mar 5, 2021: 0 rigs total (Oil 0, Gas 0) Week to Mar 12, 2021: 0 rigs total (Oil 0, Gas 0) Week to Mar 19, 2021: 0 rigs total (Oil 0, Gas 0) Week to Mar 26, 2021: 0 rigs total (Oil 0, Gas 0) Week to Apr 1, 2021: 1 rig total (Oil 1, Gas 0) Week to Apr 9, 2021: 1 rig total (Oil 1, Gas 0) Week to Apr 16, 2021: 2 rigs total (Oil 2, Gas 0) Week to Apr 23, 2021: 2 rigs total (Oil 2, Gas 0) Week to Apr 30, 2021: 2 rigs total (Oil 2, Gas 0) Week to May 7, 2021: 2 rigs total (Oil 2, Gas 0) Week to May 14, 2021: 2 rigs total (Oil 2, Gas 0) Week to May 21, 2021: 2 rigs total (Oil 2, Gas 0) Week to May 28, 2021: 2 rigs total (Oil 2, Gas 0) Week to Jun 4, 2021: 0 rigs total (Oil 0, Gas 0) Week to Jun 11, 2021: 0 rigs total (Oil 0, Gas 0) Week to Jun 18, 2021: 0 rigs total (Oil 0, Gas 0) Week to Jun 25, 2021: 0 rigs total (Oil 0, Gas 0) Week to Jul 2, 2021: 0 rigs total (Oil 0, Gas 0) Week to Jul 9, 2021: 0 rigs total (Oil 0, Gas 0) Week to Jul 16, 2021: 0 rigs total (Oil 0, Gas 0) Week to Jul 23, 2021: 0 rigs total (Oil 0, Gas 0) Week to Jul 30, 2021: 0 rigs total (Oil 0, Gas 0) Week to Aug 6, 2021: 1 rig total (Oil 1, Gas 0) Week to Aug 13, 2021: 1 rig total (Oil 1, Gas 0) Week to Aug 20, 2021: 1 rig total (Oil 1, Gas 0) Week to Aug 27, 2021: 2 rigs total (Oil 2, Gas 0) Week to Sep 3, 2021: 2 rigs total (Oil 2, Gas 0) Week to Sep 10, 2021: 2 rigs total (Oil 2, Gas 0) Week to Sep 17, 2021: 2 rigs total (Oil 2, Gas 0) Week to Sep 24, 2021: 1 rig total (Oil 1, Gas 0) Week to Oct 1, 2021: 1 rig total (Oil 1, Gas 0) Week to Oct 8, 2021: 1 rig total (Oil 1, Gas 0) Week to Oct 15, 2021: 1 rig total (Oil 1, Gas 0) Week to Oct 22, 2021: 1 rig total (Oil 1, Gas 0) Week to Oct 29, 2021: 1 rig total (Oil 1, Gas 0) Week to Nov 5, 2021: 1 rig total (Oil 1, Gas 0) Week to Nov 12, 2021: 1 rig total (Oil 1, Gas 0) Week to Nov 19, 2021: 1 rig total (Oil 1, Gas 0) Week to Nov 24, 2021: 1 rig total (Oil 1, Gas 0) Week to Dec 3, 2021: 1 rig total (Oil 1, Gas 0) Week to Dec 10, 2021: 2 rigs total (Oil 2, Gas 0) Week to Dec 17, 2021: 2 rigs total (Oil 2, Gas 0) Week to Dec 23, 2021: 2 rigs total (Oil 2, Gas 0) Week to Dec 31, 2021: 2 rigs total (Oil 2, Gas 0) Week to Jan 7, 2022: 2 rigs total (Oil 2, Gas 0) Week to Jan 14, 2022: 2 rigs total (Oil 2, Gas 0) Week to Jan 21, 2022: 2 rigs total (Oil 2, Gas 0) Week to Jan 28, 2022: 3 rigs total (Oil 3, Gas 0) Week to Feb 4, 2022: 4 rigs total (Oil 4, Gas 0) Week to Feb 11, 2022: 4 rigs total (Oil 4, Gas 0) Week to Feb 18, 2022: 4 rigs total (Oil 4, Gas 0) Week to Feb 25, 2022: 2 rigs total (Oil 2, Gas 0) Week to Mar 4, 2022: 1 rig total (Oil 1, Gas 0) Week to Mar 11, 2022: 1 rig total (Oil 1, Gas 0) Week to Mar 18, 2022: 1 rig total (Oil 1, Gas 0) Week to Mar 25, 2022: 2 rigs total (Oil 2, Gas 0) Week to Apr 1, 2022: 2 rigs total (Oil 2, Gas 0) Week to Apr 8, 2022: 2 rigs total (Oil 2, Gas 0) Week to Apr 14, 2022: 2 rigs total (Oil 2, Gas 0) Week to Apr 22, 2022: 2 rigs total (Oil 2, Gas 0) Week to Apr 29, 2022: 2 rigs total (Oil 2, Gas 0) Week to May 6, 2022: 2 rigs total (Oil 2, Gas 0) Week to May 13, 2022: 2 rigs total (Oil 2, Gas 0) Week to May 20, 2022: 2 rigs total (Oil 2, Gas 0) Week to May 27, 2022: 1 rig total (Oil 1, Gas 0) Week to Jun 3, 2022: 1 rig total (Oil 1, Gas 0) Week to Jun 10, 2022: 1 rig total (Oil 1, Gas 0) Week to Jun 17, 2022: 0 rigs total (Oil 0, Gas 0) Week to Jun 24, 2022: 1 rig total (Oil 1, Gas 0) Week to Jul 1, 2022: 1 rig total (Oil 1, Gas 0) Week to Jul 8, 2022: 1 rig total (Oil 1, Gas 0) Week to Jul 15, 2022: 2 rigs total (Oil 2, Gas 0) Week to Jul 22, 2022: 2 rigs total (Oil 2, Gas 0) Week to Jul 29, 2022: 2 rigs total (Oil 2, Gas 0) Week to Aug 5, 2022: 2 rigs total (Oil 2, Gas 0) Week to Aug 12, 2022: 2 rigs total (Oil 2, Gas 0) Week to Aug 19, 2022: 2 rigs total (Oil 2, Gas 0) Week to Aug 26, 2022: 3 rigs total (Oil 3, Gas 0) Week to Sep 2, 2022: 3 rigs total (Oil 3, Gas 0) Week to Sep 9, 2022: 3 rigs total (Oil 3, Gas 0) Week to Sep 16, 2022: 3 rigs total (Oil 3, Gas 0) Week to Sep 23, 2022: 3 rigs total (Oil 3, Gas 0) Week to Sep 30, 2022: 3 rigs total (Oil 3, Gas 0) Week to Oct 7, 2022: 3 rigs total (Oil 3, Gas 0) Week to Oct 14, 2022: 3 rigs total (Oil 3, Gas 0) Week to Oct 21, 2022: 3 rigs total (Oil 3, Gas 0) Week to Oct 28, 2022: 3 rigs total (Oil 3, Gas 0) Week to Nov 4, 2022: 3 rigs total (Oil 3, Gas 0) Week to Nov 10, 2022: 3 rigs total (Oil 3, Gas 0) Week to Nov 18, 2022: 1 rig total (Oil 1, Gas 0) Week to Nov 23, 2022: 1 rig total (Oil 1, Gas 0) Week to Dec 2, 2022: 1 rig total (Oil 1, Gas 0) Week to Dec 9, 2022: 2 rigs total (Oil 2, Gas 0) Week to Dec 16, 2022: 2 rigs total (Oil 2, Gas 0) Week to Dec 22, 2022: 3 rigs total (Oil 3, Gas 0) Week to Dec 30, 2022: 3 rigs total (Oil 3, Gas 0) Week to Jan 6, 2023: 3 rigs total (Oil 3, Gas 0) Week to Jan 13, 2023: 4 rigs total (Oil 4, Gas 0) Week to Jan 20, 2023: 4 rigs total (Oil 4, Gas 0) Week to Jan 27, 2023: 4 rigs total (Oil 4, Gas 0) Week to Feb 3, 2023: 3 rigs total (Oil 3, Gas 0) Week to Feb 10, 2023: 3 rigs total (Oil 3, Gas 0) Week to Feb 17, 2023: 3 rigs total (Oil 3, Gas 0) Week to Feb 24, 2023: 2 rigs total (Oil 2, Gas 0) Week to Mar 3, 2023: 2 rigs total (Oil 2, Gas 0) Week to Mar 10, 2023: 2 rigs total (Oil 2, Gas 0) Week to Mar 17, 2023: 2 rigs total (Oil 2, Gas 0) Week to Mar 24, 2023: 2 rigs total (Oil 2, Gas 0) Week to Mar 31, 2023: 3 rigs total (Oil 3, Gas 0) Week to Apr 6, 2023: 3 rigs total (Oil 3, Gas 0) Week to Apr 14, 2023: 2 rigs total (Oil 2, Gas 0) Week to Apr 21, 2023: 2 rigs total (Oil 2, Gas 0) Week to Apr 28, 2023: 1 rig total (Oil 1, Gas 0) Week to May 5, 2023: 1 rig total (Oil 1, Gas 0) Week to May 12, 2023: 1 rig total (Oil 1, Gas 0) Week to May 19, 2023: 1 rig total (Oil 1, Gas 0) Week to May 26, 2023: 1 rig total (Oil 1, Gas 0) Week to Jun 2, 2023: 1 rig total (Oil 1, Gas 0) Week to Jun 9, 2023: 1 rig total (Oil 1, Gas 0) Week to Jun 16, 2023: 1 rig total (Oil 1, Gas 0) Week to Jun 23, 2023: 1 rig total (Oil 1, Gas 0) Week to Jun 30, 2023: 1 rig total (Oil 1, Gas 0) Week to Jul 7, 2023: 1 rig total (Oil 1, Gas 0) Week to Jul 14, 2023: 1 rig total (Oil 1, Gas 0) Week to Jul 21, 2023: 0 rigs total (Oil 0, Gas 0) Week to Jul 28, 2023: 0 rigs total (Oil 0, Gas 0) Week to Aug 4, 2023: 0 rigs total (Oil 0, Gas 0) Week to Aug 11, 2023: 0 rigs total (Oil 0, Gas 0) Week to Aug 18, 2023: 1 rig total (Oil 1, Gas 0) Week to Aug 25, 2023: 1 rig total (Oil 1, Gas 0) Week to Sep 1, 2023: 1 rig total (Oil 1, Gas 0) Week to Sep 8, 2023: 1 rig total (Oil 1, Gas 0) Week to Sep 15, 2023: 2 rigs total (Oil 2, Gas 0) Week to Sep 22, 2023: 3 rigs total (Oil 3, Gas 0) Week to Sep 29, 2023: 2 rigs total (Oil 2, Gas 0) Week to Oct 6, 2023: 3 rigs total (Oil 3, Gas 0) Week to Oct 13, 2023: 3 rigs total (Oil 3, Gas 0) Week to Oct 20, 2023: 3 rigs total (Oil 3, Gas 0) Week to Oct 27, 2023: 3 rigs total (Oil 3, Gas 0) Week to Nov 3, 2023: 3 rigs total (Oil 3, Gas 0) Week to Nov 10, 2023: 3 rigs total (Oil 3, Gas 0) Week to Nov 17, 2023: 3 rigs total (Oil 3, Gas 0) Week to Nov 22, 2023: 3 rigs total (Oil 3, Gas 0) Week to Dec 1, 2023: 2 rigs total (Oil 2, Gas 0) Week to Dec 8, 2023: 2 rigs total (Oil 2, Gas 0) Week to Dec 15, 2023: 0 rigs total (Oil 0, Gas 0) Week to Dec 21, 2023: 0 rigs total (Oil 0, Gas 0) Week to Dec 29, 2023: 0 rigs total (Oil 0, Gas 0) Week to Jan 5, 2024: 0 rigs total (Oil 0, Gas 0) Week to Jan 12, 2024: 0 rigs total (Oil 0, Gas 0) Week to Jan 19, 2024: 0 rigs total (Oil 0, Gas 0) Week to Jan 26, 2024: 0 rigs total (Oil 0, Gas 0) Week to Feb 2, 2024: 0 rigs total (Oil 0, Gas 0) Week to Feb 9, 2024: 1 rig total (Oil 1, Gas 0) Week to Feb 16, 2024: 1 rig total (Oil 1, Gas 0) Week to Feb 23, 2024: 2 rigs total (Oil 2, Gas 0) Week to Mar 1, 2024: 2 rigs total (Oil 2, Gas 0) Week to Mar 8, 2024: 2 rigs total (Oil 2, Gas 0) Week to Mar 15, 2024: 2 rigs total (Oil 2, Gas 0) Week to Mar 22, 2024: 2 rigs total (Oil 2, Gas 0) Week to Mar 28, 2024: 3 rigs total (Oil 3, Gas 0) Week to Apr 5, 2024: 3 rigs total (Oil 3, Gas 0) Week to Apr 12, 2024: 3 rigs total (Oil 3, Gas 0) Week to Apr 19, 2024: 4 rigs total (Oil 4, Gas 0) Week to Apr 26, 2024: 3 rigs total (Oil 3, Gas 0) Week to May 3, 2024: 3 rigs total (Oil 3, Gas 0) Week to May 10, 2024: 3 rigs total (Oil 3, Gas 0) Week to May 17, 2024: 2 rigs total (Oil 2, Gas 0) Week to May 24, 2024: 2 rigs total (Oil 2, Gas 0) Week to May 31, 2024: 2 rigs total (Oil 2, Gas 0) Week to Jun 7, 2024: 2 rigs total (Oil 2, Gas 0) Week to Jun 14, 2024: 2 rigs total (Oil 2, Gas 0) Week to Jun 21, 2024: 2 rigs total (Oil 2, Gas 0) Week to Jun 28, 2024: 1 rig total (Oil 1, Gas 0) Week to Jul 5, 2024: 1 rig total (Oil 1, Gas 0) Week to Jul 12, 2024: 2 rigs total (Oil 2, Gas 0) Week to Jul 19, 2024: 2 rigs total (Oil 2, Gas 0) Week to Jul 26, 2024: 2 rigs total (Oil 2, Gas 0) Week to Aug 2, 2024: 2 rigs total (Oil 2, Gas 0) Week to Aug 9, 2024: 2 rigs total (Oil 2, Gas 0) Week to Aug 16, 2024: 2 rigs total (Oil 2, Gas 0) Week to Aug 23, 2024: 1 rig total (Oil 1, Gas 0) Week to Aug 30, 2024: 1 rig total (Oil 1, Gas 0) Week to Sep 6, 2024: 1 rig total (Oil 1, Gas 0) Week to Sep 13, 2024: 0 rigs total (Oil 0, Gas 0) Week to Sep 20, 2024: 0 rigs total (Oil 0, Gas 0) Week to Sep 27, 2024: 1 rig total (Oil 1, Gas 0) Week to Oct 4, 2024: 1 rig total (Oil 1, Gas 0) Week to Oct 11, 2024: 1 rig total (Oil 1, Gas 0) Week to Oct 18, 2024: 1 rig total (Oil 1, Gas 0) Week to Oct 25, 2024: 2 rigs total (Oil 2, Gas 0) Week to Nov 1, 2024: 2 rigs total (Oil 2, Gas 0) Week to Nov 8, 2024: 1 rig total (Oil 1, Gas 0) Week to Nov 15, 2024: 1 rig total (Oil 1, Gas 0) Week to Nov 22, 2024: 2 rigs total (Oil 2, Gas 0) Week to Nov 27, 2024: 2 rigs total (Oil 2, Gas 0) Week to Dec 6, 2024: 2 rigs total (Oil 2, Gas 0) Week to Dec 13, 2024: 3 rigs total (Oil 3, Gas 0) Week to Dec 20, 2024: 4 rigs total (Oil 4, Gas 0) Week to Dec 27, 2024: 4 rigs total (Oil 4, Gas 0) Week to Jan 3, 2025: 4 rigs total (Oil 4, Gas 0) Week to Jan 10, 2025: 4 rigs total (Oil 4, Gas 0) Week to Jan 17, 2025: 3 rigs total (Oil 3, Gas 0) Week to Jan 24, 2025: 3 rigs total (Oil 3, Gas 0) Week to Jan 31, 2025: 2 rigs total (Oil 2, Gas 0) Week to Feb 7, 2025: 2 rigs total (Oil 2, Gas 0) Week to Feb 14, 2025: 3 rigs total (Oil 3, Gas 0) Week to Feb 21, 2025: 4 rigs total (Oil 4, Gas 0) Week to Feb 28, 2025: 4 rigs total (Oil 4, Gas 0) Week to Mar 7, 2025: 4 rigs total (Oil 4, Gas 0) Week to Mar 14, 2025: 4 rigs total (Oil 4, Gas 0) Week to Mar 21, 2025: 3 rigs total (Oil 3, Gas 0) Week to Mar 28, 2025: 4 rigs total (Oil 4, Gas 0) Week to Apr 4, 2025: 5 rigs total (Oil 5, Gas 0) Week to Apr 11, 2025: 5 rigs total (Oil 5, Gas 0) Week to Apr 17, 2025: 5 rigs total (Oil 5, Gas 0) Week to Apr 25, 2025: 7 rigs total (Oil 7, Gas 0) Week to May 2, 2025: 7 rigs total (Oil 7, Gas 0) Week to May 9, 2025: 10 rigs total (Oil 10, Gas 0) Week to May 16, 2025: 10 rigs total (Oil 10, Gas 0) Week to May 23, 2025: 10 rigs total (Oil 10, Gas 0) Week to May 30, 2025: 10 rigs total (Oil 10, Gas 0) Week to Jun 6, 2025: 9 rigs total (Oil 9, Gas 0) Week to Jun 13, 2025: 9 rigs total (Oil 9, Gas 0) Week to Jun 20, 2025: 5 rigs total (Oil 5, Gas 0) Week to Jun 27, 2025: 4 rigs total (Oil 4, Gas 0) Week to Jul 3, 2025: 4 rigs total (Oil 4, Gas 0) Week to Jul 11, 2025: 3 rigs total (Oil 3, Gas 0) Week to Jul 18, 2025: 3 rigs total (Oil 3, Gas 0) Week to Jul 25, 2025: 3 rigs total (Oil 3, Gas 0) Week to Aug 1, 2025: 4 rigs total (Oil 4, Gas 0) Week to Aug 8, 2025: 5 rigs total (Oil 5, Gas 0) Week to Aug 15, 2025: 5 rigs total (Oil 5, Gas 0) Week to Aug 22, 2025: 5 rigs total (Oil 5, Gas 0) Week to Aug 29, 2025: 5 rigs total (Oil 5, Gas 0) Week to Sep 5, 2025: 5 rigs total (Oil 5, Gas 0) Week to Sep 12, 2025: 5 rigs total (Oil 5, Gas 0) Week to Sep 19, 2025: 5 rigs total (Oil 5, Gas 0) Week to Sep 26, 2025: 5 rigs total (Oil 5, Gas 0) Week to Oct 3, 2025: 5 rigs total (Oil 5, Gas 0) Week to Oct 10, 2025: 3 rigs total (Oil 3, Gas 0) Week to Oct 17, 2025: 4 rigs total (Oil 4, Gas 0) Week to Oct 24, 2025: 4 rigs total (Oil 4, Gas 0) Week to Oct 31, 2025: 4 rigs total (Oil 4, Gas 0) Week to Nov 6, 2025: 3 rigs total (Oil 3, Gas 0) Week to Nov 14, 2025: 3 rigs total (Oil 3, Gas 0) Week to Nov 21, 2025: 4 rigs total (Oil 4, Gas 0) Week to Nov 26, 2025: 3 rigs total (Oil 3, Gas 0) Week to Dec 4, 2025: 3 rigs total (Oil 3, Gas 0) Week to Dec 12, 2025: 3 rigs total (Oil 3, Gas 0) Week to Dec 19, 2025: 3 rigs total (Oil 3, Gas 0) Week to Dec 24, 2025: 3 rigs total (Oil 3, Gas 0) Week to Dec 30, 2025: 3 rigs total (Oil 3, Gas 0) Week to Jan 9, 2026: 4 rigs total (Oil 4, Gas 0) Week to Jan 16, 2026: 3 rigs total (Oil 3, Gas 0) Week to Jan 23, 2026: 3 rigs total (Oil 3, Gas 0) Week to Jan 30, 2026: 2 rigs total (Oil 2, Gas 0) Week to Feb 6, 2026: 2 rigs total (Oil 2, Gas 0) Week to Feb 13, 2026: 2 rigs total (Oil 2, Gas 0) Week to Feb 20, 2026: 2 rigs total (Oil 2, Gas 0) Week to Feb 27, 2026: 3 rigs total (Oil 3, Gas 0) Week to Mar 6, 2026: 3 rigs total (Oil 3, Gas 0) Week to Mar 13, 2026: 6 rigs total (Oil 6, Gas 0) Week to Mar 20, 2026: 9 rigs total (Oil 9, Gas 0) Week to Mar 27, 2026: 8 rigs total (Oil 8, Gas 0) Week to Apr 2, 2026: 8 rigs total (Oil 8, Gas 0) Week to Apr 10, 2026: 9 rigs total (Oil 9, Gas 0) Week to Apr 17, 2026: 9 rigs total (Oil 9, Gas 0) Week to Apr 24, 2026: 9 rigs total (Oil 9, Gas 0) Week to May 1, 2026: 9 rigs total (Oil 9, Gas 0) Week to May 8, 2026: 9 rigs total (Oil 9, Gas 0) Week to May 15, 2026: 9 rigs total (Oil 9, Gas 0) Week to May 22, 2026: 9 rigs total (Oil 9, Gas 0) Week to May 29, 2026: 8 rigs total (Oil 8, Gas 0) Week to Jun 5, 2026: 9 rigs total (Oil 9, Gas 0) Week to Jun 12, 2026: 8 rigs total (Oil 8, Gas 0) Week to Jun 18, 2026: 7 rigs total (Oil 7, Gas 0) Week to Jun 26, 2026: 9 rigs total (Oil 9, Gas 0) Week to Jul 2, 2026: 8 rigs total (Oil 8, Gas 0) Week to Jul 10, 2026: 8 rigs total (Oil 8, Gas 0) Week to Jul 17, 2026: 9 rigs total (Oil 9, Gas 0) Week to Jul 24, 2026: 9 rigs total (Oil 9, Gas 0) Week to Jul 31, 2026: 9 rigs total (Oil 9, Gas 0) Week to Aug 7, 2026: 7 rigs total (Oil 7, Gas 0) Week to Aug 14, 2026: 7 rigs total (Oil 7, Gas 0) Week to Aug 21, 2026: 7 rigs total (Oil 7, Gas 0) Week to Aug 28, 2026: 7 rigs total (Oil 7, Gas 0) Week to Sep 4, 2026: 7 rigs total (Oil 7, Gas 0) Week to Sep 11, 2026: 7 rigs total (Oil 7, Gas 0)

Interactive chart. Focus it and use the left and right arrow keys to read each week, Page Up and Page Down to move a year, Home and End for the ends of the series. The full figures are also in the table below.

  • In Custer County, Oklahoma, 7 drilling rigs were active in the week to September 11, 2026 (2 more than a year earlier).
  • Since Sep 2016, the weekly count peaked at 10 in May 2025.
  • The count covers land and inland-water rigs; rigs in US federal offshore waters are counted on the Gulf of Mexico page.
Average active rigs per month: full table
Month Oil-directedGas-directedAll rigs
Sep 2026 (through September 11, 2026)707
Aug 2026707
Jul 20268.808.8
Jun 20268.208.2
May 20268.808.8
Apr 2026909
Mar 20266.806.8
Feb 20262.202.2
Jan 2026303
Dec 2025303
Nov 20253.203.2
Oct 20253.803.8
Sep 2025505
Aug 2025505
Jul 20253.203.2
Jun 20256.206.2
May 202510010
Apr 2025606
Mar 2025404
Feb 20253.203.2
Jan 2025303
Dec 20243.403.4
Nov 20241.501.5
Oct 20241.501.5

Source: CommoVision (commovision.com)

What we cover here

Each row names the grain a region’s production is held at. Where a source publishes at a coarser grain, the page says so.

DataGrainSinceBenchmark
Oklahoma production lease + well 1990-07 ~99–100% of EIA

Benchmark cells compare our series with the EIA’s published estimates.

About the EIA comparison

The two are produced differently: the EIA estimates from a survey of the largest operators and a model built to anticipate late filings, while the series compared here are rebuilt from the source’s own records as they arrive. Recent months can differ without either being wrong; the methodology page explains both methods.

Coverage rows for Custer County, Oklahoma are regenerated at every build from the same catalog of sources the data is built from.

What the data shows

  • Custer County, Oklahoma produced 3.6 MMbbl of oil and 110.6 Bcf of natural gas in 2025.
  • Custer County, Oklahoma gas production peaked in 2019 at 127.5 Bcf; 2025 output of 110.6 Bcf ran at 87% of that peak.
  • A county page carries the production attributed to wells in that county. Oklahoma also publishes production that is held at lease grain, and that sits on the Oklahoma state page. In 2025 it was 8.5% of the state's oil and 3.9% of its gas.
  • 1,095 producing wells tracked, 12 months to Jun 2026.

Get early access

Watch supply move as soon as its sources publish, with forecasts on 1.1+ million producing wells. The portal, an API and MCP access for AI tools open on October 1, 2026.

Data use is subject to our Terms of Service.