CommoVision

See the future in real time

Pecos County, Texas

Pecos County, Texas produced 23.4 MMbbl of oil and 100.8 Bcf of natural gas in 2025. 4,238 producing wells tracked, 12 months to Jun 2026.

  • 1.1% of the oil produced in Texas, 2025.
  • Oil production fell 11% in 2025 from 2024.
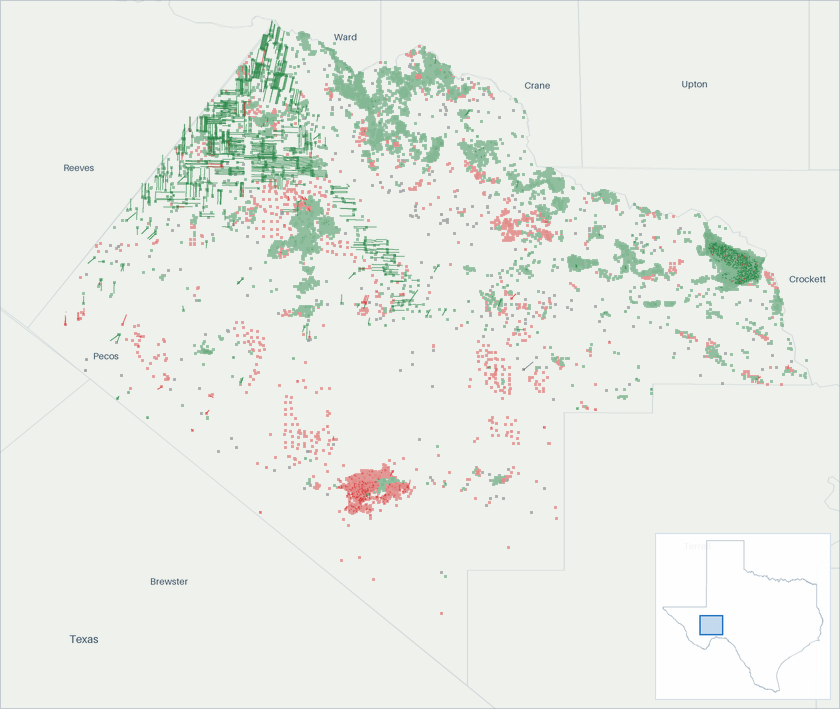
Well map of Pecos County, Texas. The full map is further down this page.

Production

Pecos County, Texas oil production (Mbbl/d, grouped by when each well first produced)
  • filling in (est. · provisional) . Hatching marks our estimate of the volume still to be filed. That estimate draws on our own production forecast. This estimate is published as our best figure. No miss stands against it. It updates as filings arrive
Pecos County, Texas oil production: thousand barrels per day, by first-production vintage filed in full 50100150 Mbbl/d 2017201820192020202120222023202420252026 Oct 2016: 37 Mbbl/d total Nov 2016: 38.7 Mbbl/d total Dec 2016: 37.6 Mbbl/d total Jan 2017: 38.6 Mbbl/d total Feb 2017: 40.3 Mbbl/d total Mar 2017: 39.8 Mbbl/d total Apr 2017: 41.1 Mbbl/d total May 2017: 43.9 Mbbl/d total Jun 2017: 44.8 Mbbl/d total Jul 2017: 46.1 Mbbl/d total Aug 2017: 46.7 Mbbl/d total Sep 2017: 48.8 Mbbl/d total Oct 2017: 48.6 Mbbl/d total Nov 2017: 50.6 Mbbl/d total Dec 2017: 51.5 Mbbl/d total Jan 2018: 55.4 Mbbl/d total Feb 2018: 58.8 Mbbl/d total Mar 2018: 65.2 Mbbl/d total Apr 2018: 70.1 Mbbl/d total May 2018: 70.4 Mbbl/d total Jun 2018: 67.4 Mbbl/d total Jul 2018: 69.7 Mbbl/d total Aug 2018: 73.6 Mbbl/d total Sep 2018: 76 Mbbl/d total Oct 2018: 75.7 Mbbl/d total Nov 2018: 82.2 Mbbl/d total Dec 2018: 85.4 Mbbl/d total Jan 2019: 88.5 Mbbl/d total Feb 2019: 85.3 Mbbl/d total Mar 2019: 92.6 Mbbl/d total Apr 2019: 96.1 Mbbl/d total May 2019: 94.4 Mbbl/d total Jun 2019: 98.6 Mbbl/d total Jul 2019: 102 Mbbl/d total Aug 2019: 99.6 Mbbl/d total Sep 2019: 97 Mbbl/d total Oct 2019: 104 Mbbl/d total Nov 2019: 111 Mbbl/d total Dec 2019: 115 Mbbl/d total Jan 2020: 118 Mbbl/d total Feb 2020: 124 Mbbl/d total Mar 2020: 117 Mbbl/d total Apr 2020: 112 Mbbl/d total May 2020: 90.1 Mbbl/d total Jun 2020: 99.6 Mbbl/d total Jul 2020: 100 Mbbl/d total Aug 2020: 101 Mbbl/d total Sep 2020: 106 Mbbl/d total Oct 2020: 111 Mbbl/d total Nov 2020: 104 Mbbl/d total Dec 2020: 101 Mbbl/d total Jan 2021: 101 Mbbl/d total Feb 2021: 85.3 Mbbl/d total Mar 2021: 105 Mbbl/d total Apr 2021: 102 Mbbl/d total May 2021: 97.3 Mbbl/d total Jun 2021: 97.3 Mbbl/d total Jul 2021: 95.9 Mbbl/d total Aug 2021: 88.5 Mbbl/d total Sep 2021: 86.4 Mbbl/d total Oct 2021: 87.3 Mbbl/d total Nov 2021: 91.4 Mbbl/d total Dec 2021: 81 Mbbl/d total Jan 2022: 80.6 Mbbl/d total Feb 2022: 87.2 Mbbl/d total Mar 2022: 87.8 Mbbl/d total Apr 2022: 85.3 Mbbl/d total May 2022: 85.1 Mbbl/d total Jun 2022: 84.2 Mbbl/d total Jul 2022: 89.3 Mbbl/d total Aug 2022: 94.6 Mbbl/d total Sep 2022: 92.1 Mbbl/d total Oct 2022: 94.3 Mbbl/d total Nov 2022: 98.4 Mbbl/d total Dec 2022: 90.4 Mbbl/d total Jan 2023: 89.7 Mbbl/d total Feb 2023: 87.4 Mbbl/d total Mar 2023: 85.9 Mbbl/d total Apr 2023: 84 Mbbl/d total May 2023: 78.9 Mbbl/d total Jun 2023: 77.7 Mbbl/d total Jul 2023: 79.2 Mbbl/d total Aug 2023: 75.9 Mbbl/d total Sep 2023: 75.5 Mbbl/d total Oct 2023: 79.4 Mbbl/d total Nov 2023: 78.9 Mbbl/d total Dec 2023: 77.8 Mbbl/d total Jan 2024: 69.6 Mbbl/d total Feb 2024: 74.6 Mbbl/d total Mar 2024: 81.3 Mbbl/d total Apr 2024: 75.5 Mbbl/d total May 2024: 76.4 Mbbl/d total Jun 2024: 72.2 Mbbl/d total Jul 2024: 72.2 Mbbl/d total Aug 2024: 70.1 Mbbl/d total Sep 2024: 68 Mbbl/d total Oct 2024: 65.9 Mbbl/d total Nov 2024: 67.3 Mbbl/d total Dec 2024: 66.5 Mbbl/d total Jan 2025: 63.5 Mbbl/d total Feb 2025: 62.3 Mbbl/d total Mar 2025: 64.4 Mbbl/d total Apr 2025: 63.9 Mbbl/d total May 2025: 62.9 Mbbl/d total Jun 2025: 62.7 Mbbl/d total Jul 2025: 62.6 Mbbl/d total Aug 2025: 66.5 Mbbl/d total Sep 2025: 66.6 Mbbl/d total Oct 2025: 65.1 Mbbl/d total Nov 2025: 63.6 Mbbl/d total Dec 2025: 64.5 Mbbl/d total Jan 2026: 61.2 Mbbl/d total Feb 2026: 62.5 Mbbl/d total Mar 2026: 61.7 Mbbl/d total Apr 2026: ≈65.5 Mbbl/d total (98% arrived, remainder estimated) May 2026: ≈65.9 Mbbl/d total (98% arrived, remainder estimated) Jun 2026: ≈61 Mbbl/d total (100% arrived, remainder estimated) Jul 2026: ≈61.3 Mbbl/d total (78% arrived, remainder estimated) Aug 2026: ≈58.4 Mbbl/d total (<1% arrived, remainder estimated) Sep 2026: ≈58.8 Mbbl/d total (<1% arrived, remainder estimated)

All from what the source published. All held at well grain.

How the volume breaks down
  • 24.2% Reported by the official source by well
  • 75.8% Reported by the official source as a lease total, split across the lease's wells. The regional total shown is the reported number, to rounding.

Every barrel through March 2026 starts from what the official source published for those months. Measured over January 1993 to March 2026.

Pecos County, Texas natural gas production (MMcf/d, grouped by when each well first produced)
  • filling in (est. · provisional) . Hatching marks our estimate of the volume still to be filed. That estimate draws on our own production forecast. This estimate is published as our best figure. No miss stands against it. It updates as filings arrive
Pecos County, Texas natural gas production: million cubic feet per day, by first-production vintage filed in full 100200300400 MMcf/d 2017201820192020202120222023202420252026 Oct 2016: 250 MMcf/d total Nov 2016: 261 MMcf/d total Dec 2016: 261 MMcf/d total Jan 2017: 263 MMcf/d total Feb 2017: 270 MMcf/d total Mar 2017: 269 MMcf/d total Apr 2017: 288 MMcf/d total May 2017: 282 MMcf/d total Jun 2017: 278 MMcf/d total Jul 2017: 278 MMcf/d total Aug 2017: 290 MMcf/d total Sep 2017: 275 MMcf/d total Oct 2017: 267 MMcf/d total Nov 2017: 277 MMcf/d total Dec 2017: 261 MMcf/d total Jan 2018: 267 MMcf/d total Feb 2018: 300 MMcf/d total Mar 2018: 301 MMcf/d total Apr 2018: 293 MMcf/d total May 2018: 286 MMcf/d total Jun 2018: 261 MMcf/d total Jul 2018: 282 MMcf/d total Aug 2018: 299 MMcf/d total Sep 2018: 282 MMcf/d total Oct 2018: 280 MMcf/d total Nov 2018: 294 MMcf/d total Dec 2018: 300 MMcf/d total Jan 2019: 308 MMcf/d total Feb 2019: 344 MMcf/d total Mar 2019: 339 MMcf/d total Apr 2019: 314 MMcf/d total May 2019: 310 MMcf/d total Jun 2019: 326 MMcf/d total Jul 2019: 294 MMcf/d total Aug 2019: 337 MMcf/d total Sep 2019: 353 MMcf/d total Oct 2019: 324 MMcf/d total Nov 2019: 363 MMcf/d total Dec 2019: 362 MMcf/d total Jan 2020: 381 MMcf/d total Feb 2020: 374 MMcf/d total Mar 2020: 318 MMcf/d total Apr 2020: 355 MMcf/d total May 2020: 309 MMcf/d total Jun 2020: 338 MMcf/d total Jul 2020: 352 MMcf/d total Aug 2020: 350 MMcf/d total Sep 2020: 353 MMcf/d total Oct 2020: 348 MMcf/d total Nov 2020: 358 MMcf/d total Dec 2020: 365 MMcf/d total Jan 2021: 367 MMcf/d total Feb 2021: 299 MMcf/d total Mar 2021: 360 MMcf/d total Apr 2021: 379 MMcf/d total May 2021: 380 MMcf/d total Jun 2021: 377 MMcf/d total Jul 2021: 383 MMcf/d total Aug 2021: 367 MMcf/d total Sep 2021: 379 MMcf/d total Oct 2021: 381 MMcf/d total Nov 2021: 370 MMcf/d total Dec 2021: 377 MMcf/d total Jan 2022: 369 MMcf/d total Feb 2022: 362 MMcf/d total Mar 2022: 370 MMcf/d total Apr 2022: 364 MMcf/d total May 2022: 353 MMcf/d total Jun 2022: 358 MMcf/d total Jul 2022: 364 MMcf/d total Aug 2022: 367 MMcf/d total Sep 2022: 367 MMcf/d total Oct 2022: 361 MMcf/d total Nov 2022: 362 MMcf/d total Dec 2022: 337 MMcf/d total Jan 2023: 327 MMcf/d total Feb 2023: 337 MMcf/d total Mar 2023: 325 MMcf/d total Apr 2023: 334 MMcf/d total May 2023: 328 MMcf/d total Jun 2023: 324 MMcf/d total Jul 2023: 318 MMcf/d total Aug 2023: 330 MMcf/d total Sep 2023: 333 MMcf/d total Oct 2023: 299 MMcf/d total Nov 2023: 319 MMcf/d total Dec 2023: 327 MMcf/d total Jan 2024: 310 MMcf/d total Feb 2024: 314 MMcf/d total Mar 2024: 298 MMcf/d total Apr 2024: 281 MMcf/d total May 2024: 269 MMcf/d total Jun 2024: 269 MMcf/d total Jul 2024: 264 MMcf/d total Aug 2024: 260 MMcf/d total Sep 2024: 257 MMcf/d total Oct 2024: 252 MMcf/d total Nov 2024: 250 MMcf/d total Dec 2024: 274 MMcf/d total Jan 2025: 284 MMcf/d total Feb 2025: 287 MMcf/d total Mar 2025: 280 MMcf/d total Apr 2025: 274 MMcf/d total May 2025: 258 MMcf/d total Jun 2025: 270 MMcf/d total Jul 2025: 271 MMcf/d total Aug 2025: 284 MMcf/d total Sep 2025: 280 MMcf/d total Oct 2025: 267 MMcf/d total Nov 2025: 279 MMcf/d total Dec 2025: 280 MMcf/d total Jan 2026: 262 MMcf/d total Feb 2026: 260 MMcf/d total Mar 2026: 247 MMcf/d total Apr 2026: ≈268 MMcf/d total (98% arrived, remainder estimated) May 2026: ≈251 MMcf/d total (98% arrived, remainder estimated) Jun 2026: ≈249 MMcf/d total (100% arrived, remainder estimated) Jul 2026: ≈277 MMcf/d total (78% arrived, remainder estimated) Aug 2026: ≈247 MMcf/d total (<1% arrived, remainder estimated) Sep 2026: ≈249 MMcf/d total (<1% arrived, remainder estimated)

All from what the source published. All held at well grain.

How the volume breaks down
  • 78.3% Reported by the official source by well
  • 21.7% Reported by the official source as a lease total, split across the lease's wells. The regional total shown is the reported number, to rounding.

Every cubic foot through March 2026 starts from what the official source published for those months. Measured over January 1993 to March 2026.

The bands group wells by when they first produced.

About this chart

The stack shows what is holding today's rate up and how much of it is new drilling. In the reported months the bands draw the filings already in. The months still filling in are marked.

Texas reports production two ways: for an oil lease or unit, and for an individual gas well. A figure reported for a lease or unit is divided among the wells it covers, and every Texas barrel is labeled reported or allocated. How well-level Texas production is built

Annual table (full history)

best estimate incl. allocated

YearOil (MMbbl)Gas produced (Bcf)
202523.4101
202426.2101
202329.5119
202232.5132
202134.0135
202039.2128
201936.1121
201825.9105
201716.5100
201613.397
201511.2107
20149.9115
20139.7127
20129.8146
201110.0180
201011.0220
200912.0241
200812.5223
200712.1178
200611.8159
200511.3160
20049.8167
20039.5199
20029.4214
200110.6226
200013.5251
199916.9258
199821.4256
199723.4257
199623.0262
199522.9276
199422.2322
199321.3310

Source: CommoVision (commovision.com)

Monthly table (last 24 months)
MonthOil (Mbbl)Gas produced (MMcf)
2026-061,820.17,447
2026-051,991.07,616
2026-041,940.07,856
2026-031,911.97,652
2026-021,749.17,293
2026-011,898.18,114
2025-121,999.38,689
2025-111,908.08,380
2025-102,017.08,265
2025-091,996.88,398
2025-082,061.48,788
2025-071,941.48,409
2025-061,881.88,112
2025-051,951.17,985
2025-041,917.18,228
2025-031,995.48,692
2025-021,745.28,036
2025-011,969.08,812
2024-122,061.68,489
2024-112,020.07,500
2024-102,043.27,811
2024-092,038.57,700
2024-082,173.88,054
2024-072,237.18,182

Source: CommoVision (commovision.com)

Source: CommoVision · Pecos County, Texas, data through July 2026.

Well map

A map of 12,913 well locations in Pecos County, Texas for which CommoVision holds a published surface coordinate, each drawn where it is and colored by its primary product (green for oil, red for natural gas, gray where undetermined; a spot shared by more than one product shows the one with the most wells there), on a ground of land and water over faint county outlines and place names for orientation, with the drilled wellbore path traced for 1,860 wells, with a small inset map locating this frame in Texas.
  • Oil 9,619
  • Natural gas 2,663
  • Undetermined 631
12,913 well locations in Pecos County, Texas, colored by primary product. The drilled path is traced for 1,860 wells from the directional surveys we hold.
About this map

Undetermined means not enough signal to settle it. Producing wells are the ones that reported oil or gas in the 12 months to Jun 2026.

61.3 Mbbl/d (est.) Jul 2026 oil production Jul 2026 is still filling in. The figure is the filings already in plus an estimate of the part not yet filed. The change compares this estimate with the same month last year. -2.1% vs Jul last year best estimate incl. allocated
276.6 MMcf/d (est.) Jul 2026 gas production Jul 2026 is still filling in. The figure is the filings already in plus an estimate of the part not yet filed. The change compares this estimate with the same month last year. +2% vs Jul last year best estimate incl. allocated
64.1 Mbbl/d 2025 oil production best estimate incl. allocated
276.2 MMcf/d 2025 gas production best estimate incl. allocated
4,238 wells Producing wells tracked 12 months to Jun 2026

Type curves

Pecos County, Texas oil type curves (bbl/d per well, log scale, against months on production; cohorts 2010–2026)
Pecos County, Texas oil type curves: average barrels per day per well on a log scale against months on production 2010-2014: 46 wells; starts at 108 bbl/d per well, 88.0 Mbbl cumulative through month 139 (100% of its wells old enough at that month); the dashed curve runs through month 199, on our forecast where a well’s own record ends2015: 29 wells; starts at 252 bbl/d per well, 274 Mbbl cumulative through month 127 (100% of its wells old enough at that month); the dashed curve runs through month 187, on our forecast where a well’s own record ends2016: 35 wells; starts at 238 bbl/d per well, 371 Mbbl cumulative through month 116 (100% of its wells old enough at that month); the dashed curve runs through month 176, on our forecast where a well’s own record ends2017: 68 wells; starts at 211 bbl/d per well, 249 Mbbl cumulative through month 103 (100% of its wells old enough at that month); the dashed curve runs through month 163, on our forecast where a well’s own record ends2018: 127 wells; starts at 298 bbl/d per well, 358 Mbbl cumulative through month 91 (100% of its wells old enough at that month); the dashed curve runs through month 151, on our forecast where a well’s own record ends2019: 178 wells; starts at 244 bbl/d per well, 319 Mbbl cumulative through month 79 (100% of its wells old enough at that month); the dashed curve runs through month 139, on our forecast where a well’s own record ends2020: 84 wells; starts at 227 bbl/d per well, 294 Mbbl cumulative through month 67 (100% of its wells old enough at that month); the dashed curve runs through month 127, on our forecast where a well’s own record ends2021: 48 wells; starts at 319 bbl/d per well, 250 Mbbl cumulative through month 56 (100% of its wells old enough at that month); the dashed curve runs through month 116, on our forecast where a well’s own record ends2022: 89 wells; starts at 279 bbl/d per well, 226 Mbbl cumulative through month 44 (100% of its wells old enough at that month); the dashed curve runs through month 104, on our forecast where a well’s own record ends2023: 38 wells; starts at 207 bbl/d per well, 182 Mbbl cumulative through month 33 (100% of its wells old enough at that month); the dashed curve runs through month 93, on our forecast where a well’s own record ends2024: 11 wells; starts at 96.3 bbl/d per well, 251 Mbbl cumulative through month 27 (100% of its wells old enough at that month); the dashed curve runs through month 87, on our forecast where a well’s own record ends2025: 17 wells; starts at 321 bbl/d per well, 119 Mbbl cumulative through month 7 (100% of its wells old enough at that month); the dashed curve runs through month 67, on our forecast where a well’s own record ends2026: 10 wells; starts at 242 bbl/d per well, 17.5 Mbbl cumulative through month 2 (100% of its wells old enough at that month); the dashed curve runs through month 62, on our forecast where a well’s own record ends351020501002005001,000bbl/d24487296120144168192216Months on production
Pecos County, Texas natural gas type curves (Mcf/d per well, log scale, against months on production; cohorts 2010–2026)
Pecos County, Texas natural gas type curves: average thousand cubic feet per day per well on a log scale against months on production 2010-2014: 46 wells; starts at 218 Mcf/d per well, 0.4 Bcf cumulative through month 139 (100% of its wells old enough at that month); the dashed curve runs through month 199, on our forecast where a well’s own record ends2015: 29 wells; starts at 244 Mcf/d per well, 0.4 Bcf cumulative through month 127 (100% of its wells old enough at that month); the dashed curve runs through month 187, on our forecast where a well’s own record ends2016: 35 wells; starts at 376 Mcf/d per well, 0.8 Bcf cumulative through month 116 (100% of its wells old enough at that month); the dashed curve runs through month 176, on our forecast where a well’s own record ends2017: 68 wells; starts at 287 Mcf/d per well, 0.6 Bcf cumulative through month 103 (100% of its wells old enough at that month); the dashed curve runs through month 163, on our forecast where a well’s own record ends2018: 127 wells; starts at 313 Mcf/d per well, 0.7 Bcf cumulative through month 91 (100% of its wells old enough at that month); the dashed curve runs through month 151, on our forecast where a well’s own record ends2019: 178 wells; starts at 205 Mcf/d per well, 0.8 Bcf cumulative through month 79 (100% of its wells old enough at that month); the dashed curve runs through month 139, on our forecast where a well’s own record ends2020: 84 wells; starts at 293 Mcf/d per well, 0.9 Bcf cumulative through month 67 (100% of its wells old enough at that month); the dashed curve runs through month 127, on our forecast where a well’s own record ends2021: 48 wells; starts at 262 Mcf/d per well, 0.5 Bcf cumulative through month 56 (100% of its wells old enough at that month); the dashed curve runs through month 116, on our forecast where a well’s own record ends2022: 89 wells; starts at 293 Mcf/d per well, 0.4 Bcf cumulative through month 44 (100% of its wells old enough at that month); the dashed curve runs through month 104, on our forecast where a well’s own record ends2023: 38 wells; starts at 177 Mcf/d per well, 0.4 Bcf cumulative through month 33 (100% of its wells old enough at that month); the dashed curve runs through month 93, on our forecast where a well’s own record ends2024: 11 wells; starts at 114 Mcf/d per well, 0.3 Bcf cumulative through month 27 (100% of its wells old enough at that month); the dashed curve runs through month 87, on our forecast where a well’s own record ends2025: 17 wells; starts at 855 Mcf/d per well, 0.4 Bcf cumulative through month 7 (100% of its wells old enough at that month); the dashed curve runs through month 67, on our forecast where a well’s own record ends2026: 10 wells; starts at 497 Mcf/d per well, 0.0 Bcf cumulative through month 2 (100% of its wells old enough at that month); the dashed curve runs through month 62, on our forecast where a well’s own record ends1020501002005001,0002,0003,000Mcf/d24487296120144168192216Months on production

best estimate incl. allocated

Horizontal wells only. Average production per well, for wells grouped by when they first produced.

How these curves are built

Horizontal wells only: 780 of the 1,766 wells in these cohorts. Average daily production per well, for wells grouped by when they first produced. Includes every well of the cohort that is old enough at each month. Wells that are shut in or have stopped producing count as zero, so the average reflects the full cohort, not just survivors. Rates are calendar-day (volume ÷ days in month). The cumulative axis accumulates those same monthly averages at the average month length. Months not yet fully reported are excluded. The 2010-2014 curve draws those years as one group. The chart opens on average daily rate against months on production, the rate on a log scale. The view control switches to rate against cumulative production per well, on the same log rate scale, or to cumulative production per well against months on production, on a linear scale. Every view draws the same cohorts from the same production history. Each cohort is solid through the last month all of its wells sit inside fully reported data. Past it the dashed curve carries the same wells forward, on our forecast where a well’s own record ends, for up to five years. A dashed curve runs as far as at least nine in ten of its wells are accounted for. A well that is old enough but shut in still counts, as zero. The measured months are what these wells reported. In the forward months each well counts its own reported figure for each month it has one, our forecast for each month it has only that, and zero for the rest. The forward average counts every well of the cohort. The drawn forecast runs up to five years past the measured months. Line thickness tracks the size of each cohort. 767 wells are counted here but not shown on the age axis: they started producing in 1995 or earlier, too close to the start of our records for their region to verify their true age.

Cohort summary table
First produced Wells Peak oil (bbl/d per well) Month-12 oil (bbl/d per well) Cum oil in series (Mbbl per well) Peak gas (Mcf/d per well) Month-12 gas (Mcf/d per well) Cum gas in series (Bcf per well) Months in series Wells old enough at last month in series Forecast months drawn
2026 10 333 17.5 810 0.0 2 100% 60
2025 17 822 119 2,790 0.4 7 100% 60
2024 11 812 278 251 763 363 0.3 27 100% 60
2023 38 375 198 182 654 395 0.4 33 100% 60
2022 89 566 181 226 603 344 0.4 44 100% 60
2021 48 460 246 250 523 398 0.5 56 100% 60
2020 84 539 222 294 790 644 0.9 67 100% 60
2019 178 534 230 319 564 427 0.8 79 100% 60
2018 127 628 266 358 686 404 0.7 91 100% 60
2017 68 470 179 249 683 441 0.6 103 100% 60
2016 35 515 239 371 691 395 0.8 116 100% 60
2015 29 419 158 274 471 205 0.4 127 100% 60
2010-2014 46 179 50.3 88.0 433 264 0.4 139 100% 60

Source: CommoVision (commovision.com)

Source: CommoVision · Pecos County, Texas type curves, per-well production by first-production cohort.

Top operators in Pecos County, Texas, 2025 best estimate incl. allocated

  1. Diamondback Energy 27.0%
  2. Kinder Morgan 21.7%
  3. Continental Resources 20.6%
  4. XTO Energy 10.5%
  5. VTX Energy Operating 3.0%
  6. Gordy Oil Company 2.2%
  7. Crescent Energy Company 2.1%
  8. Battalion Oil Corporation 1.8%
  9. MBX Operating LLC 1.3%
  10. Greenlake Energy Operating 1.2%
  11. 147 other operators 8.7%
Top operators in Pecos County, Texas, 2025: full table
OperatorOil (Mbbl/d, 2025)Gas produced (MMcf/d, 2025)Share of output
Diamondback Energy 18.359.427.0%
Kinder Morgan 13.368.421.7%
Continental Resources 14.044.920.6%
XTO Energy 6.138.510.5%
VTX Energy Operating 2.15.53.0%
Gordy Oil Company 1.45.92.2%
Crescent Energy Company 1.26.92.1%
Battalion Oil Corporation 1.15.51.8%
MBX Operating LLC 0.57.71.3%
Greenlake Energy Operating 0.82.31.2%
147 other operators 5.131.18.7%

Mbbl/d = thousand barrels per day · MMcf/d = million cubic feet per day (units).

Source: CommoVision (commovision.com)

Active drilling rigs

3 rigs active in the week to September 11, 2026
+2 rigs vs the same week a year earlier
24 rigs peak week, Aug 2019 (since Sep 2016)
Active drilling rigs by rig type (rigs, weekly count)Source: Baker Hughes rig count
Oil Gas
Active drilling rigs by rig type: rigs, weekly count 10 20 30 rigs 2017201820192020202120222023202420252026 Week to Sep 16, 2016: 5 rigs total (Oil 5, Gas 0) Week to Sep 23, 2016: 5 rigs total (Oil 5, Gas 0) Week to Sep 30, 2016: 5 rigs total (Oil 5, Gas 0) Week to Oct 7, 2016: 4 rigs total (Oil 4, Gas 0) Week to Oct 14, 2016: 4 rigs total (Oil 4, Gas 0) Week to Oct 21, 2016: 4 rigs total (Oil 4, Gas 0) Week to Oct 28, 2016: 4 rigs total (Oil 4, Gas 0) Week to Nov 4, 2016: 3 rigs total (Oil 3, Gas 0) Week to Nov 11, 2016: 3 rigs total (Oil 3, Gas 0) Week to Nov 18, 2016: 4 rigs total (Oil 4, Gas 0) Week to Nov 23, 2016: 4 rigs total (Oil 4, Gas 0) Week to Dec 2, 2016: 4 rigs total (Oil 4, Gas 0) Week to Dec 9, 2016: 6 rigs total (Oil 6, Gas 0) Week to Dec 16, 2016: 6 rigs total (Oil 6, Gas 0) Week to Dec 23, 2016: 6 rigs total (Oil 6, Gas 0) Week to Dec 30, 2016: 6 rigs total (Oil 6, Gas 0) Week to Jan 6, 2017: 7 rigs total (Oil 7, Gas 0) Week to Jan 13, 2017: 6 rigs total (Oil 6, Gas 0) Week to Jan 20, 2017: 7 rigs total (Oil 7, Gas 0) Week to Jan 27, 2017: 8 rigs total (Oil 8, Gas 0) Week to Feb 3, 2017: 8 rigs total (Oil 8, Gas 0) Week to Feb 10, 2017: 8 rigs total (Oil 8, Gas 0) Week to Feb 17, 2017: 8 rigs total (Oil 8, Gas 0) Week to Feb 24, 2017: 8 rigs total (Oil 8, Gas 0) Week to Mar 3, 2017: 8 rigs total (Oil 8, Gas 0) Week to Mar 10, 2017: 9 rigs total (Oil 9, Gas 0) Week to Mar 17, 2017: 8 rigs total (Oil 8, Gas 0) Week to Mar 24, 2017: 11 rigs total (Oil 11, Gas 0) Week to Mar 31, 2017: 10 rigs total (Oil 10, Gas 0) Week to Apr 7, 2017: 12 rigs total (Oil 12, Gas 0) Week to Apr 13, 2017: 12 rigs total (Oil 12, Gas 0) Week to Apr 21, 2017: 13 rigs total (Oil 13, Gas 0) Week to Apr 28, 2017: 13 rigs total (Oil 13, Gas 0) Week to May 5, 2017: 13 rigs total (Oil 13, Gas 0) Week to May 12, 2017: 13 rigs total (Oil 13, Gas 0) Week to May 19, 2017: 12 rigs total (Oil 12, Gas 0) Week to May 26, 2017: 12 rigs total (Oil 12, Gas 0) Week to Jun 2, 2017: 12 rigs total (Oil 12, Gas 0) Week to Jun 9, 2017: 11 rigs total (Oil 11, Gas 0) Week to Jun 16, 2017: 11 rigs total (Oil 11, Gas 0) Week to Jun 23, 2017: 13 rigs total (Oil 13, Gas 0) Week to Jun 30, 2017: 13 rigs total (Oil 13, Gas 0) Week to Jul 7, 2017: 12 rigs total (Oil 12, Gas 0) Week to Jul 14, 2017: 15 rigs total (Oil 15, Gas 0) Week to Jul 21, 2017: 15 rigs total (Oil 15, Gas 0) Week to Jul 28, 2017: 15 rigs total (Oil 15, Gas 0) Week to Aug 4, 2017: 12 rigs total (Oil 12, Gas 0) Week to Aug 11, 2017: 11 rigs total (Oil 11, Gas 0) Week to Aug 18, 2017: 11 rigs total (Oil 11, Gas 0) Week to Aug 25, 2017: 11 rigs total (Oil 11, Gas 0) Week to Sep 1, 2017: 11 rigs total (Oil 11, Gas 0) Week to Sep 8, 2017: 10 rigs total (Oil 10, Gas 0) Week to Sep 15, 2017: 11 rigs total (Oil 11, Gas 0) Week to Sep 22, 2017: 12 rigs total (Oil 12, Gas 0) Week to Sep 29, 2017: 12 rigs total (Oil 12, Gas 0) Week to Oct 6, 2017: 11 rigs total (Oil 11, Gas 0) Week to Oct 13, 2017: 11 rigs total (Oil 11, Gas 0) Week to Oct 20, 2017: 10 rigs total (Oil 10, Gas 0) Week to Oct 27, 2017: 8 rigs total (Oil 8, Gas 0) Week to Nov 3, 2017: 10 rigs total (Oil 10, Gas 0) Week to Nov 10, 2017: 13 rigs total (Oil 13, Gas 0) Week to Nov 17, 2017: 13 rigs total (Oil 13, Gas 0) Week to Nov 22, 2017: 12 rigs total (Oil 12, Gas 0) Week to Dec 1, 2017: 12 rigs total (Oil 12, Gas 0) Week to Dec 8, 2017: 12 rigs total (Oil 12, Gas 0) Week to Dec 15, 2017: 11 rigs total (Oil 11, Gas 0) Week to Dec 22, 2017: 11 rigs total (Oil 11, Gas 0) Week to Dec 29, 2017: 7 rigs total (Oil 7, Gas 0) Week to Jan 5, 2018: 7 rigs total (Oil 7, Gas 0) Week to Jan 12, 2018: 9 rigs total (Oil 9, Gas 0) Week to Jan 19, 2018: 11 rigs total (Oil 11, Gas 0) Week to Jan 26, 2018: 12 rigs total (Oil 12, Gas 0) Week to Feb 2, 2018: 12 rigs total (Oil 12, Gas 0) Week to Feb 9, 2018: 13 rigs total (Oil 13, Gas 0) Week to Feb 16, 2018: 12 rigs total (Oil 12, Gas 0) Week to Feb 23, 2018: 16 rigs total (Oil 16, Gas 0) Week to Mar 2, 2018: 15 rigs total (Oil 15, Gas 0) Week to Mar 9, 2018: 14 rigs total (Oil 14, Gas 0) Week to Mar 16, 2018: 14 rigs total (Oil 14, Gas 0) Week to Mar 23, 2018: 12 rigs total (Oil 12, Gas 0) Week to Mar 29, 2018: 11 rigs total (Oil 11, Gas 0) Week to Apr 6, 2018: 11 rigs total (Oil 11, Gas 0) Week to Apr 13, 2018: 11 rigs total (Oil 11, Gas 0) Week to Apr 20, 2018: 14 rigs total (Oil 14, Gas 0) Week to Apr 27, 2018: 14 rigs total (Oil 14, Gas 0) Week to May 4, 2018: 14 rigs total (Oil 14, Gas 0) Week to May 11, 2018: 15 rigs total (Oil 15, Gas 0) Week to May 18, 2018: 15 rigs total (Oil 15, Gas 0) Week to May 25, 2018: 15 rigs total (Oil 15, Gas 0) Week to Jun 1, 2018: 15 rigs total (Oil 15, Gas 0) Week to Jun 8, 2018: 15 rigs total (Oil 15, Gas 0) Week to Jun 15, 2018: 15 rigs total (Oil 15, Gas 0) Week to Jun 22, 2018: 16 rigs total (Oil 16, Gas 0) Week to Jun 29, 2018: 17 rigs total (Oil 17, Gas 0) Week to Jul 6, 2018: 18 rigs total (Oil 18, Gas 0) Week to Jul 13, 2018: 19 rigs total (Oil 19, Gas 0) Week to Jul 20, 2018: 21 rigs total (Oil 21, Gas 0) Week to Jul 27, 2018: 20 rigs total (Oil 20, Gas 0) Week to Aug 3, 2018: 20 rigs total (Oil 20, Gas 0) Week to Aug 10, 2018: 20 rigs total (Oil 20, Gas 0) Week to Aug 17, 2018: 20 rigs total (Oil 20, Gas 0) Week to Aug 24, 2018: 20 rigs total (Oil 20, Gas 0) Week to Aug 31, 2018: 21 rigs total (Oil 21, Gas 0) Week to Sep 7, 2018: 18 rigs total (Oil 18, Gas 0) Week to Sep 14, 2018: 18 rigs total (Oil 18, Gas 0) Week to Sep 21, 2018: 22 rigs total (Oil 22, Gas 0) Week to Sep 28, 2018: 22 rigs total (Oil 22, Gas 0) Week to Oct 5, 2018: 22 rigs total (Oil 22, Gas 0) Week to Oct 12, 2018: 22 rigs total (Oil 22, Gas 0) Week to Oct 19, 2018: 21 rigs total (Oil 21, Gas 0) Week to Oct 26, 2018: 21 rigs total (Oil 21, Gas 0) Week to Nov 2, 2018: 23 rigs total (Oil 23, Gas 0) Week to Nov 9, 2018: 23 rigs total (Oil 23, Gas 0) Week to Nov 16, 2018: 23 rigs total (Oil 23, Gas 0) Week to Nov 21, 2018: 20 rigs total (Oil 20, Gas 0) Week to Nov 30, 2018: 20 rigs total (Oil 20, Gas 0) Week to Dec 7, 2018: 19 rigs total (Oil 19, Gas 0) Week to Dec 14, 2018: 17 rigs total (Oil 17, Gas 0) Week to Dec 21, 2018: 17 rigs total (Oil 17, Gas 0) Week to Dec 28, 2018: 17 rigs total (Oil 17, Gas 0) Week to Jan 4, 2019: 17 rigs total (Oil 17, Gas 0) Week to Jan 11, 2019: 17 rigs total (Oil 17, Gas 0) Week to Jan 18, 2019: 17 rigs total (Oil 17, Gas 0) Week to Jan 25, 2019: 16 rigs total (Oil 16, Gas 0) Week to Feb 1, 2019: 16 rigs total (Oil 16, Gas 0) Week to Feb 8, 2019: 16 rigs total (Oil 16, Gas 0) Week to Feb 15, 2019: 16 rigs total (Oil 16, Gas 0) Week to Feb 22, 2019: 16 rigs total (Oil 16, Gas 0) Week to Mar 1, 2019: 17 rigs total (Oil 17, Gas 0) Week to Mar 8, 2019: 17 rigs total (Oil 17, Gas 0) Week to Mar 15, 2019: 18 rigs total (Oil 18, Gas 0) Week to Mar 22, 2019: 18 rigs total (Oil 18, Gas 0) Week to Mar 29, 2019: 18 rigs total (Oil 18, Gas 0) Week to Apr 5, 2019: 19 rigs total (Oil 19, Gas 0) Week to Apr 12, 2019: 20 rigs total (Oil 20, Gas 0) Week to Apr 18, 2019: 20 rigs total (Oil 20, Gas 0) Week to Apr 26, 2019: 19 rigs total (Oil 19, Gas 0) Week to May 3, 2019: 18 rigs total (Oil 18, Gas 0) Week to May 10, 2019: 18 rigs total (Oil 18, Gas 0) Week to May 17, 2019: 17 rigs total (Oil 17, Gas 0) Week to May 24, 2019: 17 rigs total (Oil 17, Gas 0) Week to May 31, 2019: 20 rigs total (Oil 20, Gas 0) Week to Jun 7, 2019: 21 rigs total (Oil 21, Gas 0) Week to Jun 14, 2019: 21 rigs total (Oil 21, Gas 0) Week to Jun 21, 2019: 21 rigs total (Oil 21, Gas 0) Week to Jun 28, 2019: 21 rigs total (Oil 21, Gas 0) Week to Jul 3, 2019: 22 rigs total (Oil 22, Gas 0) Week to Jul 12, 2019: 21 rigs total (Oil 21, Gas 0) Week to Jul 19, 2019: 21 rigs total (Oil 21, Gas 0) Week to Jul 26, 2019: 22 rigs total (Oil 22, Gas 0) Week to Aug 2, 2019: 22 rigs total (Oil 22, Gas 0) Week to Aug 9, 2019: 24 rigs total (Oil 24, Gas 0) Week to Aug 16, 2019: 22 rigs total (Oil 22, Gas 0) Week to Aug 23, 2019: 18 rigs total (Oil 18, Gas 0) Week to Aug 30, 2019: 18 rigs total (Oil 18, Gas 0) Week to Sep 6, 2019: 17 rigs total (Oil 17, Gas 0) Week to Sep 13, 2019: 17 rigs total (Oil 17, Gas 0) Week to Sep 20, 2019: 13 rigs total (Oil 13, Gas 0) Week to Sep 27, 2019: 11 rigs total (Oil 11, Gas 0) Week to Oct 4, 2019: 11 rigs total (Oil 11, Gas 0) Week to Oct 11, 2019: 10 rigs total (Oil 10, Gas 0) Week to Oct 18, 2019: 11 rigs total (Oil 11, Gas 0) Week to Oct 25, 2019: 11 rigs total (Oil 11, Gas 0) Week to Nov 1, 2019: 11 rigs total (Oil 11, Gas 0) Week to Nov 8, 2019: 12 rigs total (Oil 12, Gas 0) Week to Nov 15, 2019: 12 rigs total (Oil 12, Gas 0) Week to Nov 22, 2019: 12 rigs total (Oil 12, Gas 0) Week to Nov 27, 2019: 15 rigs total (Oil 15, Gas 0) Week to Dec 6, 2019: 17 rigs total (Oil 17, Gas 0) Week to Dec 13, 2019: 17 rigs total (Oil 17, Gas 0) Week to Dec 20, 2019: 17 rigs total (Oil 17, Gas 0) Week to Dec 27, 2019: 17 rigs total (Oil 17, Gas 0) Week to Jan 3, 2020: 18 rigs total (Oil 18, Gas 0) Week to Jan 10, 2020: 17 rigs total (Oil 17, Gas 0) Week to Jan 17, 2020: 15 rigs total (Oil 15, Gas 0) Week to Jan 24, 2020: 15 rigs total (Oil 15, Gas 0) Week to Jan 31, 2020: 15 rigs total (Oil 15, Gas 0) Week to Feb 7, 2020: 16 rigs total (Oil 16, Gas 0) Week to Feb 14, 2020: 15 rigs total (Oil 15, Gas 0) Week to Feb 21, 2020: 16 rigs total (Oil 16, Gas 0) Week to Feb 28, 2020: 14 rigs total (Oil 14, Gas 0) Week to Mar 6, 2020: 15 rigs total (Oil 15, Gas 0) Week to Mar 13, 2020: 14 rigs total (Oil 14, Gas 0) Week to Mar 20, 2020: 15 rigs total (Oil 15, Gas 0) Week to Mar 27, 2020: 14 rigs total (Oil 14, Gas 0) Week to Apr 3, 2020: 14 rigs total (Oil 14, Gas 0) Week to Apr 9, 2020: 12 rigs total (Oil 12, Gas 0) Week to Apr 17, 2020: 11 rigs total (Oil 11, Gas 0) Week to Apr 24, 2020: 10 rigs total (Oil 10, Gas 0) Week to May 1, 2020: 10 rigs total (Oil 10, Gas 0) Week to May 8, 2020: 7 rigs total (Oil 7, Gas 0) Week to May 15, 2020: 7 rigs total (Oil 7, Gas 0) Week to May 22, 2020: 5 rigs total (Oil 5, Gas 0) Week to May 29, 2020: 4 rigs total (Oil 4, Gas 0) Week to Jun 5, 2020: 4 rigs total (Oil 4, Gas 0) Week to Jun 12, 2020: 2 rigs total (Oil 2, Gas 0) Week to Jun 19, 2020: 1 rig total (Oil 1, Gas 0) Week to Jun 26, 2020: 1 rig total (Oil 1, Gas 0) Week to Jul 2, 2020: 1 rig total (Oil 1, Gas 0) Week to Jul 10, 2020: 1 rig total (Oil 1, Gas 0) Week to Jul 17, 2020: 1 rig total (Oil 1, Gas 0) Week to Jul 24, 2020: 1 rig total (Oil 1, Gas 0) Week to Jul 31, 2020: 1 rig total (Oil 1, Gas 0) Week to Aug 7, 2020: 2 rigs total (Oil 2, Gas 0) Week to Aug 14, 2020: 2 rigs total (Oil 2, Gas 0) Week to Aug 21, 2020: 2 rigs total (Oil 2, Gas 0) Week to Aug 28, 2020: 1 rig total (Oil 1, Gas 0) Week to Sep 4, 2020: 1 rig total (Oil 1, Gas 0) Week to Sep 11, 2020: 2 rigs total (Oil 2, Gas 0) Week to Sep 18, 2020: 2 rigs total (Oil 2, Gas 0) Week to Sep 25, 2020: 1 rig total (Oil 1, Gas 0) Week to Oct 2, 2020: 1 rig total (Oil 1, Gas 0) Week to Oct 9, 2020: 1 rig total (Oil 1, Gas 0) Week to Oct 16, 2020: 1 rig total (Oil 1, Gas 0) Week to Oct 23, 2020: 1 rig total (Oil 1, Gas 0) Week to Oct 30, 2020: 1 rig total (Oil 1, Gas 0) Week to Nov 6, 2020: 1 rig total (Oil 1, Gas 0) Week to Nov 13, 2020: 0 rigs total (Oil 0, Gas 0) Week to Nov 20, 2020: 1 rig total (Oil 1, Gas 0) Week to Nov 25, 2020: 1 rig total (Oil 1, Gas 0) Week to Dec 4, 2020: 1 rig total (Oil 1, Gas 0) Week to Dec 11, 2020: 1 rig total (Oil 1, Gas 0) Week to Dec 18, 2020: 1 rig total (Oil 1, Gas 0) Week to Dec 23, 2020: 1 rig total (Oil 1, Gas 0) Week to Dec 31, 2020: 1 rig total (Oil 1, Gas 0) Week to Jan 8, 2021: 1 rig total (Oil 1, Gas 0) Week to Jan 15, 2021: 1 rig total (Oil 1, Gas 0) Week to Jan 22, 2021: 1 rig total (Oil 1, Gas 0) Week to Jan 29, 2021: 2 rigs total (Oil 2, Gas 0) Week to Feb 5, 2021: 2 rigs total (Oil 2, Gas 0) Week to Feb 12, 2021: 3 rigs total (Oil 3, Gas 0) Week to Feb 19, 2021: 3 rigs total (Oil 3, Gas 0) Week to Feb 26, 2021: 3 rigs total (Oil 3, Gas 0) Week to Mar 5, 2021: 3 rigs total (Oil 3, Gas 0) Week to Mar 12, 2021: 3 rigs total (Oil 3, Gas 0) Week to Mar 19, 2021: 3 rigs total (Oil 3, Gas 0) Week to Mar 26, 2021: 1 rig total (Oil 1, Gas 0) Week to Apr 1, 2021: 1 rig total (Oil 1, Gas 0) Week to Apr 9, 2021: 1 rig total (Oil 1, Gas 0) Week to Apr 16, 2021: 0 rigs total (Oil 0, Gas 0) Week to Apr 23, 2021: 0 rigs total (Oil 0, Gas 0) Week to Apr 30, 2021: 1 rig total (Oil 1, Gas 0) Week to May 7, 2021: 1 rig total (Oil 1, Gas 0) Week to May 14, 2021: 1 rig total (Oil 1, Gas 0) Week to May 21, 2021: 1 rig total (Oil 1, Gas 0) Week to May 28, 2021: 1 rig total (Oil 1, Gas 0) Week to Jun 4, 2021: 1 rig total (Oil 1, Gas 0) Week to Jun 11, 2021: 2 rigs total (Oil 2, Gas 0) Week to Jun 18, 2021: 2 rigs total (Oil 2, Gas 0) Week to Jun 25, 2021: 2 rigs total (Oil 2, Gas 0) Week to Jul 2, 2021: 2 rigs total (Oil 2, Gas 0) Week to Jul 9, 2021: 2 rigs total (Oil 2, Gas 0) Week to Jul 16, 2021: 2 rigs total (Oil 2, Gas 0) Week to Jul 23, 2021: 3 rigs total (Oil 3, Gas 0) Week to Jul 30, 2021: 2 rigs total (Oil 2, Gas 0) Week to Aug 6, 2021: 2 rigs total (Oil 2, Gas 0) Week to Aug 13, 2021: 2 rigs total (Oil 2, Gas 0) Week to Aug 20, 2021: 2 rigs total (Oil 2, Gas 0) Week to Aug 27, 2021: 3 rigs total (Oil 3, Gas 0) Week to Sep 3, 2021: 2 rigs total (Oil 2, Gas 0) Week to Sep 10, 2021: 3 rigs total (Oil 3, Gas 0) Week to Sep 17, 2021: 3 rigs total (Oil 3, Gas 0) Week to Sep 24, 2021: 3 rigs total (Oil 3, Gas 0) Week to Oct 1, 2021: 3 rigs total (Oil 3, Gas 0) Week to Oct 8, 2021: 2 rigs total (Oil 2, Gas 0) Week to Oct 15, 2021: 3 rigs total (Oil 3, Gas 0) Week to Oct 22, 2021: 3 rigs total (Oil 3, Gas 0) Week to Oct 29, 2021: 3 rigs total (Oil 3, Gas 0) Week to Nov 5, 2021: 3 rigs total (Oil 3, Gas 0) Week to Nov 12, 2021: 3 rigs total (Oil 3, Gas 0) Week to Nov 19, 2021: 3 rigs total (Oil 3, Gas 0) Week to Nov 24, 2021: 4 rigs total (Oil 4, Gas 0) Week to Dec 3, 2021: 5 rigs total (Oil 5, Gas 0) Week to Dec 10, 2021: 3 rigs total (Oil 3, Gas 0) Week to Dec 17, 2021: 3 rigs total (Oil 3, Gas 0) Week to Dec 23, 2021: 5 rigs total (Oil 5, Gas 0) Week to Dec 31, 2021: 4 rigs total (Oil 4, Gas 0) Week to Jan 7, 2022: 3 rigs total (Oil 3, Gas 0) Week to Jan 14, 2022: 4 rigs total (Oil 4, Gas 0) Week to Jan 21, 2022: 4 rigs total (Oil 4, Gas 0) Week to Jan 28, 2022: 4 rigs total (Oil 4, Gas 0) Week to Feb 4, 2022: 6 rigs total (Oil 6, Gas 0) Week to Feb 11, 2022: 7 rigs total (Oil 7, Gas 0) Week to Feb 18, 2022: 8 rigs total (Oil 8, Gas 0) Week to Feb 25, 2022: 10 rigs total (Oil 10, Gas 0) Week to Mar 4, 2022: 10 rigs total (Oil 10, Gas 0) Week to Mar 11, 2022: 10 rigs total (Oil 10, Gas 0) Week to Mar 18, 2022: 10 rigs total (Oil 10, Gas 0) Week to Mar 25, 2022: 10 rigs total (Oil 10, Gas 0) Week to Apr 1, 2022: 8 rigs total (Oil 8, Gas 0) Week to Apr 8, 2022: 8 rigs total (Oil 8, Gas 0) Week to Apr 14, 2022: 5 rigs total (Oil 5, Gas 0) Week to Apr 22, 2022: 5 rigs total (Oil 5, Gas 0) Week to Apr 29, 2022: 6 rigs total (Oil 6, Gas 0) Week to May 6, 2022: 6 rigs total (Oil 6, Gas 0) Week to May 13, 2022: 6 rigs total (Oil 6, Gas 0) Week to May 20, 2022: 6 rigs total (Oil 6, Gas 0) Week to May 27, 2022: 6 rigs total (Oil 6, Gas 0) Week to Jun 3, 2022: 6 rigs total (Oil 6, Gas 0) Week to Jun 10, 2022: 6 rigs total (Oil 6, Gas 0) Week to Jun 17, 2022: 5 rigs total (Oil 5, Gas 0) Week to Jun 24, 2022: 5 rigs total (Oil 5, Gas 0) Week to Jul 1, 2022: 5 rigs total (Oil 5, Gas 0) Week to Jul 8, 2022: 5 rigs total (Oil 5, Gas 0) Week to Jul 15, 2022: 5 rigs total (Oil 5, Gas 0) Week to Jul 22, 2022: 5 rigs total (Oil 5, Gas 0) Week to Jul 29, 2022: 5 rigs total (Oil 5, Gas 0) Week to Aug 5, 2022: 5 rigs total (Oil 5, Gas 0) Week to Aug 12, 2022: 5 rigs total (Oil 5, Gas 0) Week to Aug 19, 2022: 4 rigs total (Oil 4, Gas 0) Week to Aug 26, 2022: 3 rigs total (Oil 3, Gas 0) Week to Sep 2, 2022: 3 rigs total (Oil 3, Gas 0) Week to Sep 9, 2022: 3 rigs total (Oil 3, Gas 0) Week to Sep 16, 2022: 3 rigs total (Oil 3, Gas 0) Week to Sep 23, 2022: 3 rigs total (Oil 3, Gas 0) Week to Sep 30, 2022: 3 rigs total (Oil 3, Gas 0) Week to Oct 7, 2022: 3 rigs total (Oil 3, Gas 0) Week to Oct 14, 2022: 3 rigs total (Oil 3, Gas 0) Week to Oct 21, 2022: 3 rigs total (Oil 3, Gas 0) Week to Oct 28, 2022: 2 rigs total (Oil 2, Gas 0) Week to Nov 4, 2022: 2 rigs total (Oil 2, Gas 0) Week to Nov 10, 2022: 2 rigs total (Oil 2, Gas 0) Week to Nov 18, 2022: 2 rigs total (Oil 2, Gas 0) Week to Nov 23, 2022: 2 rigs total (Oil 2, Gas 0) Week to Dec 2, 2022: 2 rigs total (Oil 2, Gas 0) Week to Dec 9, 2022: 2 rigs total (Oil 2, Gas 0) Week to Dec 16, 2022: 2 rigs total (Oil 2, Gas 0) Week to Dec 22, 2022: 1 rig total (Oil 1, Gas 0) Week to Dec 30, 2022: 1 rig total (Oil 1, Gas 0) Week to Jan 6, 2023: 1 rig total (Oil 1, Gas 0) Week to Jan 13, 2023: 2 rigs total (Oil 2, Gas 0) Week to Jan 20, 2023: 4 rigs total (Oil 4, Gas 0) Week to Jan 27, 2023: 4 rigs total (Oil 4, Gas 0) Week to Feb 3, 2023: 6 rigs total (Oil 6, Gas 0) Week to Feb 10, 2023: 6 rigs total (Oil 6, Gas 0) Week to Feb 17, 2023: 6 rigs total (Oil 6, Gas 0) Week to Feb 24, 2023: 6 rigs total (Oil 6, Gas 0) Week to Mar 3, 2023: 7 rigs total (Oil 7, Gas 0) Week to Mar 10, 2023: 6 rigs total (Oil 6, Gas 0) Week to Mar 17, 2023: 6 rigs total (Oil 6, Gas 0) Week to Mar 24, 2023: 6 rigs total (Oil 6, Gas 0) Week to Mar 31, 2023: 6 rigs total (Oil 6, Gas 0) Week to Apr 6, 2023: 6 rigs total (Oil 6, Gas 0) Week to Apr 14, 2023: 6 rigs total (Oil 6, Gas 0) Week to Apr 21, 2023: 6 rigs total (Oil 6, Gas 0) Week to Apr 28, 2023: 4 rigs total (Oil 4, Gas 0) Week to May 5, 2023: 4 rigs total (Oil 4, Gas 0) Week to May 12, 2023: 4 rigs total (Oil 4, Gas 0) Week to May 19, 2023: 1 rig total (Oil 1, Gas 0) Week to May 26, 2023: 1 rig total (Oil 1, Gas 0) Week to Jun 2, 2023: 1 rig total (Oil 1, Gas 0) Week to Jun 9, 2023: 1 rig total (Oil 1, Gas 0) Week to Jun 16, 2023: 1 rig total (Oil 1, Gas 0) Week to Jun 23, 2023: 1 rig total (Oil 1, Gas 0) Week to Jun 30, 2023: 1 rig total (Oil 1, Gas 0) Week to Jul 7, 2023: 0 rigs total (Oil 0, Gas 0) Week to Jul 14, 2023: 0 rigs total (Oil 0, Gas 0) Week to Jul 21, 2023: 0 rigs total (Oil 0, Gas 0) Week to Jul 28, 2023: 0 rigs total (Oil 0, Gas 0) Week to Aug 4, 2023: 0 rigs total (Oil 0, Gas 0) Week to Aug 11, 2023: 1 rig total (Oil 1, Gas 0) Week to Aug 18, 2023: 1 rig total (Oil 1, Gas 0) Week to Aug 25, 2023: 1 rig total (Oil 1, Gas 0) Week to Sep 1, 2023: 1 rig total (Oil 1, Gas 0) Week to Sep 8, 2023: 1 rig total (Oil 1, Gas 0) Week to Sep 15, 2023: 1 rig total (Oil 1, Gas 0) Week to Sep 22, 2023: 0 rigs total (Oil 0, Gas 0) Week to Sep 29, 2023: 1 rig total (Oil 1, Gas 0) Week to Oct 6, 2023: 1 rig total (Oil 1, Gas 0) Week to Oct 13, 2023: 1 rig total (Oil 1, Gas 0) Week to Oct 20, 2023: 1 rig total (Oil 1, Gas 0) Week to Oct 27, 2023: 1 rig total (Oil 1, Gas 0) Week to Nov 3, 2023: 1 rig total (Oil 1, Gas 0) Week to Nov 10, 2023: 1 rig total (Oil 1, Gas 0) Week to Nov 17, 2023: 2 rigs total (Oil 2, Gas 0) Week to Nov 22, 2023: 2 rigs total (Oil 2, Gas 0) Week to Dec 1, 2023: 2 rigs total (Oil 2, Gas 0) Week to Dec 8, 2023: 3 rigs total (Oil 3, Gas 0) Week to Dec 15, 2023: 3 rigs total (Oil 3, Gas 0) Week to Dec 21, 2023: 3 rigs total (Oil 3, Gas 0) Week to Dec 29, 2023: 3 rigs total (Oil 3, Gas 0) Week to Jan 5, 2024: 3 rigs total (Oil 3, Gas 0) Week to Jan 12, 2024: 3 rigs total (Oil 3, Gas 0) Week to Jan 19, 2024: 3 rigs total (Oil 3, Gas 0) Week to Jan 26, 2024: 2 rigs total (Oil 2, Gas 0) Week to Feb 2, 2024: 1 rig total (Oil 1, Gas 0) Week to Feb 9, 2024: 1 rig total (Oil 1, Gas 0) Week to Feb 16, 2024: 1 rig total (Oil 1, Gas 0) Week to Feb 23, 2024: 1 rig total (Oil 1, Gas 0) Week to Mar 1, 2024: 1 rig total (Oil 1, Gas 0) Week to Mar 8, 2024: 1 rig total (Oil 1, Gas 0) Week to Mar 15, 2024: 1 rig total (Oil 1, Gas 0) Week to Mar 22, 2024: 1 rig total (Oil 1, Gas 0) Week to Mar 28, 2024: 1 rig total (Oil 1, Gas 0) Week to Apr 5, 2024: 1 rig total (Oil 1, Gas 0) Week to Apr 12, 2024: 1 rig total (Oil 1, Gas 0) Week to Apr 19, 2024: 1 rig total (Oil 1, Gas 0) Week to Apr 26, 2024: 1 rig total (Oil 1, Gas 0) Week to May 3, 2024: 1 rig total (Oil 1, Gas 0) Week to May 10, 2024: 1 rig total (Oil 1, Gas 0) Week to May 17, 2024: 1 rig total (Oil 1, Gas 0) Week to May 24, 2024: 1 rig total (Oil 1, Gas 0) Week to May 31, 2024: 1 rig total (Oil 1, Gas 0) Week to Jun 7, 2024: 1 rig total (Oil 1, Gas 0) Week to Jun 14, 2024: 1 rig total (Oil 1, Gas 0) Week to Jun 21, 2024: 1 rig total (Oil 1, Gas 0) Week to Jun 28, 2024: 1 rig total (Oil 1, Gas 0) Week to Jul 5, 2024: 1 rig total (Oil 1, Gas 0) Week to Jul 12, 2024: 1 rig total (Oil 1, Gas 0) Week to Jul 19, 2024: 1 rig total (Oil 1, Gas 0) Week to Jul 26, 2024: 1 rig total (Oil 1, Gas 0) Week to Aug 2, 2024: 1 rig total (Oil 1, Gas 0) Week to Aug 9, 2024: 1 rig total (Oil 1, Gas 0) Week to Aug 16, 2024: 1 rig total (Oil 1, Gas 0) Week to Aug 23, 2024: 1 rig total (Oil 1, Gas 0) Week to Aug 30, 2024: 1 rig total (Oil 1, Gas 0) Week to Sep 6, 2024: 1 rig total (Oil 1, Gas 0) Week to Sep 13, 2024: 1 rig total (Oil 1, Gas 0) Week to Sep 20, 2024: 1 rig total (Oil 1, Gas 0) Week to Sep 27, 2024: 1 rig total (Oil 1, Gas 0) Week to Oct 4, 2024: 1 rig total (Oil 1, Gas 0) Week to Oct 11, 2024: 1 rig total (Oil 1, Gas 0) Week to Oct 18, 2024: 1 rig total (Oil 1, Gas 0) Week to Oct 25, 2024: 1 rig total (Oil 1, Gas 0) Week to Nov 1, 2024: 1 rig total (Oil 1, Gas 0) Week to Nov 8, 2024: 1 rig total (Oil 1, Gas 0) Week to Nov 15, 2024: 1 rig total (Oil 1, Gas 0) Week to Nov 22, 2024: 1 rig total (Oil 1, Gas 0) Week to Nov 27, 2024: 1 rig total (Oil 1, Gas 0) Week to Dec 6, 2024: 1 rig total (Oil 1, Gas 0) Week to Dec 13, 2024: 1 rig total (Oil 1, Gas 0) Week to Dec 20, 2024: 1 rig total (Oil 1, Gas 0) Week to Dec 27, 2024: 1 rig total (Oil 1, Gas 0) Week to Jan 3, 2025: 1 rig total (Oil 1, Gas 0) Week to Jan 10, 2025: 1 rig total (Oil 1, Gas 0) Week to Jan 17, 2025: 1 rig total (Oil 1, Gas 0) Week to Jan 24, 2025: 1 rig total (Oil 1, Gas 0) Week to Jan 31, 2025: 1 rig total (Oil 1, Gas 0) Week to Feb 7, 2025: 1 rig total (Oil 1, Gas 0) Week to Feb 14, 2025: 1 rig total (Oil 1, Gas 0) Week to Feb 21, 2025: 1 rig total (Oil 1, Gas 0) Week to Feb 28, 2025: 1 rig total (Oil 1, Gas 0) Week to Mar 7, 2025: 1 rig total (Oil 1, Gas 0) Week to Mar 14, 2025: 1 rig total (Oil 1, Gas 0) Week to Mar 21, 2025: 1 rig total (Oil 1, Gas 0) Week to Mar 28, 2025: 1 rig total (Oil 1, Gas 0) Week to Apr 4, 2025: 1 rig total (Oil 1, Gas 0) Week to Apr 11, 2025: 1 rig total (Oil 1, Gas 0) Week to Apr 17, 2025: 1 rig total (Oil 1, Gas 0) Week to Apr 25, 2025: 1 rig total (Oil 1, Gas 0) Week to May 2, 2025: 1 rig total (Oil 1, Gas 0) Week to May 9, 2025: 1 rig total (Oil 1, Gas 0) Week to May 16, 2025: 1 rig total (Oil 1, Gas 0) Week to May 23, 2025: 1 rig total (Oil 1, Gas 0) Week to May 30, 2025: 1 rig total (Oil 1, Gas 0) Week to Jun 6, 2025: 1 rig total (Oil 1, Gas 0) Week to Jun 13, 2025: 1 rig total (Oil 1, Gas 0) Week to Jun 20, 2025: 1 rig total (Oil 1, Gas 0) Week to Jun 27, 2025: 1 rig total (Oil 1, Gas 0) Week to Jul 3, 2025: 0 rigs total (Oil 0, Gas 0) Week to Jul 11, 2025: 0 rigs total (Oil 0, Gas 0) Week to Jul 18, 2025: 0 rigs total (Oil 0, Gas 0) Week to Jul 25, 2025: 0 rigs total (Oil 0, Gas 0) Week to Aug 1, 2025: 0 rigs total (Oil 0, Gas 0) Week to Aug 8, 2025: 0 rigs total (Oil 0, Gas 0) Week to Aug 15, 2025: 0 rigs total (Oil 0, Gas 0) Week to Aug 22, 2025: 0 rigs total (Oil 0, Gas 0) Week to Aug 29, 2025: 0 rigs total (Oil 0, Gas 0) Week to Sep 5, 2025: 1 rig total (Oil 1, Gas 0) Week to Sep 12, 2025: 1 rig total (Oil 1, Gas 0) Week to Sep 19, 2025: 1 rig total (Oil 1, Gas 0) Week to Sep 26, 2025: 1 rig total (Oil 1, Gas 0) Week to Oct 3, 2025: 1 rig total (Oil 1, Gas 0) Week to Oct 10, 2025: 1 rig total (Oil 1, Gas 0) Week to Oct 17, 2025: 1 rig total (Oil 1, Gas 0) Week to Oct 24, 2025: 1 rig total (Oil 1, Gas 0) Week to Oct 31, 2025: 1 rig total (Oil 1, Gas 0) Week to Nov 6, 2025: 1 rig total (Oil 1, Gas 0) Week to Nov 14, 2025: 1 rig total (Oil 1, Gas 0) Week to Nov 21, 2025: 1 rig total (Oil 1, Gas 0) Week to Nov 26, 2025: 1 rig total (Oil 1, Gas 0) Week to Dec 4, 2025: 1 rig total (Oil 1, Gas 0) Week to Dec 12, 2025: 1 rig total (Oil 1, Gas 0) Week to Dec 19, 2025: 1 rig total (Oil 1, Gas 0) Week to Dec 24, 2025: 1 rig total (Oil 1, Gas 0) Week to Dec 30, 2025: 1 rig total (Oil 1, Gas 0) Week to Jan 9, 2026: 0 rigs total (Oil 0, Gas 0) Week to Jan 16, 2026: 0 rigs total (Oil 0, Gas 0) Week to Jan 23, 2026: 0 rigs total (Oil 0, Gas 0) Week to Jan 30, 2026: 0 rigs total (Oil 0, Gas 0) Week to Feb 6, 2026: 0 rigs total (Oil 0, Gas 0) Week to Feb 13, 2026: 0 rigs total (Oil 0, Gas 0) Week to Feb 20, 2026: 0 rigs total (Oil 0, Gas 0) Week to Feb 27, 2026: 0 rigs total (Oil 0, Gas 0) Week to Mar 6, 2026: 0 rigs total (Oil 0, Gas 0) Week to Mar 13, 2026: 0 rigs total (Oil 0, Gas 0) Week to Mar 20, 2026: 1 rig total (Oil 1, Gas 0) Week to Mar 27, 2026: 1 rig total (Oil 1, Gas 0) Week to Apr 2, 2026: 1 rig total (Oil 1, Gas 0) Week to Apr 10, 2026: 1 rig total (Oil 1, Gas 0) Week to Apr 17, 2026: 1 rig total (Oil 1, Gas 0) Week to Apr 24, 2026: 1 rig total (Oil 1, Gas 0) Week to May 1, 2026: 1 rig total (Oil 1, Gas 0) Week to May 8, 2026: 1 rig total (Oil 1, Gas 0) Week to May 15, 2026: 1 rig total (Oil 1, Gas 0) Week to May 22, 2026: 1 rig total (Oil 1, Gas 0) Week to May 29, 2026: 1 rig total (Oil 1, Gas 0) Week to Jun 5, 2026: 1 rig total (Oil 1, Gas 0) Week to Jun 12, 2026: 1 rig total (Oil 1, Gas 0) Week to Jun 18, 2026: 1 rig total (Oil 1, Gas 0) Week to Jun 26, 2026: 1 rig total (Oil 1, Gas 0) Week to Jul 2, 2026: 1 rig total (Oil 1, Gas 0) Week to Jul 10, 2026: 1 rig total (Oil 1, Gas 0) Week to Jul 17, 2026: 1 rig total (Oil 1, Gas 0) Week to Jul 24, 2026: 1 rig total (Oil 1, Gas 0) Week to Jul 31, 2026: 1 rig total (Oil 1, Gas 0) Week to Aug 7, 2026: 1 rig total (Oil 1, Gas 0) Week to Aug 14, 2026: 1 rig total (Oil 1, Gas 0) Week to Aug 21, 2026: 1 rig total (Oil 1, Gas 0) Week to Aug 28, 2026: 3 rigs total (Oil 3, Gas 0) Week to Sep 4, 2026: 3 rigs total (Oil 3, Gas 0) Week to Sep 11, 2026: 3 rigs total (Oil 3, Gas 0)

Interactive chart. Focus it and use the left and right arrow keys to read each week, Page Up and Page Down to move a year, Home and End for the ends of the series. The full figures are also in the table below.

  • In Pecos County, Texas, 3 drilling rigs were active in the week to September 11, 2026 (2 more than a year earlier).
  • Since Sep 2016, the weekly count peaked at 24 in Aug 2019.
  • The count covers land and inland-water rigs; rigs in US federal offshore waters are counted on the Gulf of Mexico page.
Average active rigs per month: full table
Month Oil-directedGas-directedAll rigs
Sep 2026 (through September 11, 2026)303
Aug 20261.801.8
Jul 2026101
Jun 2026101
May 2026101
Apr 2026101
Mar 20260.600.6
Feb 2026000
Jan 2026000
Dec 2025101
Nov 2025101
Oct 2025101
Sep 2025101
Aug 2025000
Jul 2025000
Jun 20250.800.8
May 2025101
Apr 2025101
Mar 2025101
Feb 2025101
Jan 2025101
Dec 2024101
Nov 2024101
Oct 2024101

Source: CommoVision (commovision.com)

What we cover here

Each row names the grain a region’s production is held at. Where a source publishes at a coarser grain, the page says so.

DataGrainSinceBenchmark
Texas production well 1993-01 ~99–100% of EIA

Benchmark cells compare our series with the EIA’s published estimates.

About the EIA comparison

The two are produced differently: the EIA estimates from a survey of the largest operators and a model built to anticipate late filings, while the series compared here are rebuilt from the source’s own records as they arrive. Recent months can differ without either being wrong; the methodology page explains both methods.

Coverage rows for Pecos County, Texas are regenerated at every build from the same catalog of sources the data is built from.

What the data shows

  • Pecos County, Texas produced 23.4 MMbbl of oil and 100.8 Bcf of natural gas in 2025.
  • Pecos County, Texas oil production peaked in 2020 at 39.2 MMbbl; 2025 output of 23.4 MMbbl ran at 60% of that peak.
  • 4,238 producing wells tracked, 12 months to Jun 2026.

Get early access

Watch supply move as soon as its sources publish, with forecasts on 1.1+ million producing wells. The portal, an API and MCP access for AI tools open on October 1, 2026.

Data use is subject to our Terms of Service.