CommoVision

See the future in real time

Tarrant County, Texas

Tarrant County, Texas produced 2 Mbbl (thousand barrels) of oil and 277.7 Bcf of natural gas in 2025. 3,556 producing wells tracked, 12 months to Jun 2026.

  • 2.0% of the natural gas produced in Texas, 2025.
  • Natural gas production fell 5% in 2025 from 2024.
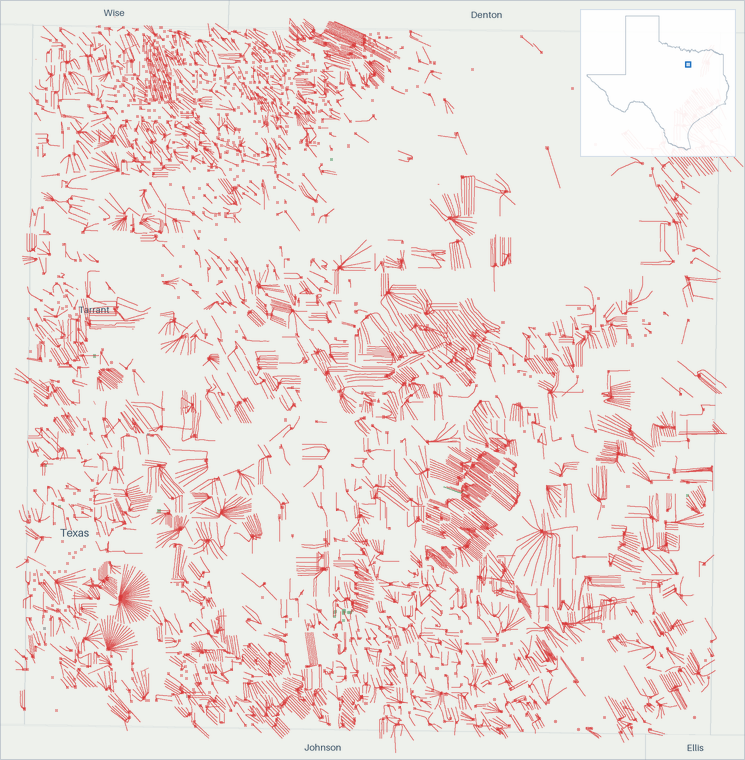
Well map of Tarrant County, Texas. The full map is further down this page.

Production

Tarrant County, Texas natural gas production (MMcf/d, grouped by when each well first produced)
  • filling in (est. · provisional) . Hatching marks our estimate of the volume still to be filed. That estimate draws on our own production forecast. This estimate is published as our best figure. No miss stands against it. It updates as filings arrive
Tarrant County, Texas natural gas production: million cubic feet per day, by first-production vintage filed in full 5001,0001,500 MMcf/d 2017201820192020202120222023202420252026 Oct 2016: 1,388 MMcf/d total Nov 2016: 1,368 MMcf/d total Dec 2016: 1,354 MMcf/d total Jan 2017: 1,336 MMcf/d total Feb 2017: 1,332 MMcf/d total Mar 2017: 1,307 MMcf/d total Apr 2017: 1,309 MMcf/d total May 2017: 1,292 MMcf/d total Jun 2017: 1,289 MMcf/d total Jul 2017: 1,271 MMcf/d total Aug 2017: 1,229 MMcf/d total Sep 2017: 1,221 MMcf/d total Oct 2017: 1,235 MMcf/d total Nov 2017: 1,214 MMcf/d total Dec 2017: 1,237 MMcf/d total Jan 2018: 1,188 MMcf/d total Feb 2018: 1,212 MMcf/d total Mar 2018: 1,190 MMcf/d total Apr 2018: 1,203 MMcf/d total May 2018: 1,217 MMcf/d total Jun 2018: 1,206 MMcf/d total Jul 2018: 1,173 MMcf/d total Aug 2018: 1,157 MMcf/d total Sep 2018: 1,136 MMcf/d total Oct 2018: 1,154 MMcf/d total Nov 2018: 1,147 MMcf/d total Dec 2018: 1,151 MMcf/d total Jan 2019: 1,143 MMcf/d total Feb 2019: 1,143 MMcf/d total Mar 2019: 1,127 MMcf/d total Apr 2019: 1,112 MMcf/d total May 2019: 1,093 MMcf/d total Jun 2019: 1,066 MMcf/d total Jul 2019: 1,054 MMcf/d total Aug 2019: 1,047 MMcf/d total Sep 2019: 1,040 MMcf/d total Oct 2019: 1,015 MMcf/d total Nov 2019: 1,009 MMcf/d total Dec 2019: 1,005 MMcf/d total Jan 2020: 1,033 MMcf/d total Feb 2020: 1,018 MMcf/d total Mar 2020: 1,005 MMcf/d total Apr 2020: 1,006 MMcf/d total May 2020: 989 MMcf/d total Jun 2020: 975 MMcf/d total Jul 2020: 959 MMcf/d total Aug 2020: 946 MMcf/d total Sep 2020: 943 MMcf/d total Oct 2020: 937 MMcf/d total Nov 2020: 940 MMcf/d total Dec 2020: 928 MMcf/d total Jan 2021: 925 MMcf/d total Feb 2021: 787 MMcf/d total Mar 2021: 875 MMcf/d total Apr 2021: 889 MMcf/d total May 2021: 882 MMcf/d total Jun 2021: 875 MMcf/d total Jul 2021: 909 MMcf/d total Aug 2021: 893 MMcf/d total Sep 2021: 919 MMcf/d total Oct 2021: 929 MMcf/d total Nov 2021: 925 MMcf/d total Dec 2021: 907 MMcf/d total Jan 2022: 873 MMcf/d total Feb 2022: 850 MMcf/d total Mar 2022: 856 MMcf/d total Apr 2022: 869 MMcf/d total May 2022: 868 MMcf/d total Jun 2022: 867 MMcf/d total Jul 2022: 852 MMcf/d total Aug 2022: 866 MMcf/d total Sep 2022: 849 MMcf/d total Oct 2022: 845 MMcf/d total Nov 2022: 876 MMcf/d total Dec 2022: 844 MMcf/d total Jan 2023: 840 MMcf/d total Feb 2023: 813 MMcf/d total Mar 2023: 833 MMcf/d total Apr 2023: 840 MMcf/d total May 2023: 839 MMcf/d total Jun 2023: 821 MMcf/d total Jul 2023: 818 MMcf/d total Aug 2023: 799 MMcf/d total Sep 2023: 806 MMcf/d total Oct 2023: 804 MMcf/d total Nov 2023: 811 MMcf/d total Dec 2023: 800 MMcf/d total Jan 2024: 768 MMcf/d total Feb 2024: 789 MMcf/d total Mar 2024: 778 MMcf/d total Apr 2024: 764 MMcf/d total May 2024: 764 MMcf/d total Jun 2024: 804 MMcf/d total Jul 2024: 791 MMcf/d total Aug 2024: 825 MMcf/d total Sep 2024: 816 MMcf/d total Oct 2024: 801 MMcf/d total Nov 2024: 822 MMcf/d total Dec 2024: 820 MMcf/d total Jan 2025: 792 MMcf/d total Feb 2025: 800 MMcf/d total Mar 2025: 797 MMcf/d total Apr 2025: 793 MMcf/d total May 2025: 782 MMcf/d total Jun 2025: 768 MMcf/d total Jul 2025: 757 MMcf/d total Aug 2025: 747 MMcf/d total Sep 2025: 749 MMcf/d total Oct 2025: 717 MMcf/d total Nov 2025: 716 MMcf/d total Dec 2025: 716 MMcf/d total Jan 2026: 670 MMcf/d total Feb 2026: 683 MMcf/d total Mar 2026: 689 MMcf/d total Apr 2026: ≈722 MMcf/d total (98% arrived, remainder estimated) May 2026: ≈708 MMcf/d total (98% arrived, remainder estimated) Jun 2026: ≈719 MMcf/d total (100% arrived, remainder estimated) Jul 2026: ≈739 MMcf/d total (78% arrived, remainder estimated) Aug 2026: ≈724 MMcf/d total (<1% arrived, remainder estimated) Sep 2026: ≈713 MMcf/d total (<1% arrived, remainder estimated)

All from what the source published. All held at well grain.

How the volume breaks down
  • 100% Reported by the official source by well

Every cubic foot through March 2026 starts from what the official source published for those months. Measured over January 1998 to March 2026.

Tarrant County, Texas oil production (bbl/d, grouped by when each well first produced)
  • filling in (est. · provisional) . Hatching marks our estimate of the volume still to be filed. That estimate draws on our own production forecast. This estimate is published as our best figure. No miss stands against it. It updates as filings arrive
Tarrant County, Texas oil production: barrels per day, by first-production vintage filed in full today 20406080 bbl/d 2017201820192020202120222023202420252026 Aug 2016: 41.3 bbl/d total Sep 2016: 30.4 bbl/d total Oct 2016: 21.7 bbl/d total Nov 2016: 46.1 bbl/d total Dec 2016: 40.8 bbl/d total Jan 2017: 29.3 bbl/d total Feb 2017: 74.5 bbl/d total Mar 2017: 36.7 bbl/d total Apr 2017: 45.9 bbl/d total May 2017: 34.9 bbl/d total Jun 2017: 19.7 bbl/d total Jul 2017: 27.2 bbl/d total Aug 2017: 34.2 bbl/d total Sep 2017: 10.1 bbl/d total Oct 2017: 30.7 bbl/d total Nov 2017: 73.3 bbl/d total Dec 2017: 20.2 bbl/d total Jan 2018: 52.7 bbl/d total Feb 2018: 25.3 bbl/d total Mar 2018: 17.6 bbl/d total Apr 2018: 68.8 bbl/d total May 2018: 45.7 bbl/d total Jun 2018: 32.3 bbl/d total Jul 2018: 20.8 bbl/d total Aug 2018: 8.71 bbl/d total Sep 2018: 33.1 bbl/d total Oct 2018: 20.7 bbl/d total Nov 2018: 18.3 bbl/d total Dec 2018: 33.9 bbl/d total Jan 2019: 21.1 bbl/d total Feb 2019: 30.7 bbl/d total Mar 2019: 33.2 bbl/d total Apr 2019: 30.6 bbl/d total May 2019: 10.9 bbl/d total Jun 2019: 13.7 bbl/d total Jul 2019: 19.7 bbl/d total Aug 2019: 5.65 bbl/d total Sep 2019: 31.1 bbl/d total Oct 2019: 6.23 bbl/d total Nov 2019: 9.63 bbl/d total Dec 2019: 23.7 bbl/d total Jan 2020: 13 bbl/d total Feb 2020: 44.1 bbl/d total Mar 2020: 20.6 bbl/d total Apr 2020: 11 bbl/d total May 2020: 7.9 bbl/d total Jun 2020: 22.2 bbl/d total Jul 2020: 12.5 bbl/d total Aug 2020: 16.3 bbl/d total Sep 2020: 15 bbl/d total Oct 2020: 16.3 bbl/d total Nov 2020: 11.9 bbl/d total Dec 2020: 18.3 bbl/d total Jan 2021: 33.6 bbl/d total Feb 2021: 13.8 bbl/d total Mar 2021: 21 bbl/d total Apr 2021: 27.1 bbl/d total May 2021: 9.13 bbl/d total Jun 2021: 22.5 bbl/d total Jul 2021: 8.87 bbl/d total Aug 2021: 9.58 bbl/d total Sep 2021: 15.3 bbl/d total Oct 2021: 7.1 bbl/d total Nov 2021: 17.8 bbl/d total Dec 2021: 28.4 bbl/d total Jan 2022: 33.5 bbl/d total Feb 2022: 13.5 bbl/d total Mar 2022: 14.2 bbl/d total Apr 2022: 21.7 bbl/d total May 2022: 10.1 bbl/d total Jun 2022: 11.3 bbl/d total Jul 2022: 3.81 bbl/d total Aug 2022: 2.23 bbl/d total Sep 2022: 11 bbl/d total Oct 2022: 27.7 bbl/d total Nov 2022: 12.9 bbl/d total Dec 2022: 14.7 bbl/d total Jan 2023: 4.16 bbl/d total Feb 2023: 1.61 bbl/d total Mar 2023: 20.8 bbl/d total Apr 2023: 8.6 bbl/d total May 2023: 4.48 bbl/d total Jun 2023: 13.6 bbl/d total Jul 2023: 2.32 bbl/d total Aug 2023: 2.45 bbl/d total Sep 2023: 4.17 bbl/d total Oct 2023: 1.71 bbl/d total Nov 2023: 8.17 bbl/d total Dec 2023: 8.39 bbl/d total Jan 2024: 9.26 bbl/d total Feb 2024: 9.14 bbl/d total Mar 2024: 7.58 bbl/d total Apr 2024: 9.23 bbl/d total May 2024: 5.55 bbl/d total Jun 2024: 1.87 bbl/d total Jul 2024: 2.87 bbl/d total Aug 2024: 8.45 bbl/d total Sep 2024: 12 bbl/d total Oct 2024: 5.58 bbl/d total Nov 2024: 28 bbl/d total Dec 2024: 12.9 bbl/d total Jan 2025: 9.19 bbl/d total Feb 2025: 12.4 bbl/d total Mar 2025: 6.9 bbl/d total Apr 2025: 7 bbl/d total May 2025: 5.16 bbl/d total Jun 2025: 8.6 bbl/d total Jul 2025: 1.32 bbl/d total Aug 2025: 2.94 bbl/d total Sep 2025: 6.53 bbl/d total Oct 2025: 3.42 bbl/d total Nov 2025: 7.77 bbl/d total Dec 2025: 4.13 bbl/d total Jan 2026: 3.07 bbl/d total Feb 2026: 7.04 bbl/d total Mar 2026: 28.1 bbl/d total Apr 2026: ≈4.83 bbl/d total (98% arrived, remainder estimated) May 2026: ≈10.1 bbl/d total (98% arrived, remainder estimated) Jun 2026: ≈3.63 bbl/d total (100% arrived, remainder estimated) Jul 2026: ≈17.8 bbl/d total (78% arrived, remainder estimated)

Still arriving: Aug 2026 <1% filed.

All from what the source published. All held at well grain.

How the volume breaks down
  • 100% Reported by the official source by well

Every barrel through March 2026 starts from what the official source published for those months. Measured over January 1998 to March 2026.

The bands group wells by when they first produced.

About this chart

The stack shows what is holding today's rate up and how much of it is new drilling. In the reported months the bands draw the filings already in. The months still filling in are marked.

Texas reports production two ways: for an oil lease or unit, and for an individual gas well. A figure reported for a lease or unit is divided among the wells it covers, and every Texas barrel is labeled reported or allocated. How well-level Texas production is built

Annual table (full history)
YearOil (MMbbl)Gas produced (Bcf)
2025<0.1278
2024<0.1291
2023<0.1299
2022<0.1314
2021<0.1326
2020<0.1356
2019<0.1391
2018<0.1430
2017<0.1464
2016<0.1538
2015<0.1610
2014<0.1684
2013<0.1773
2012<0.1822
2011<0.1757
2010<0.1647
2009<0.1548
20080.1461
2007<0.1280
2006<0.1184
2005<0.1124
2004<0.175
2003<0.141
2002<0.118
2001<0.13
2000<0.11
1999<0.11
1998<0.11

Source: CommoVision (commovision.com)

Monthly table (last 24 months)
MonthOil (Mbbl)Gas produced (MMcf)
2026-060.121,523
2026-050.221,518
2026-040.121,124
2026-030.921,357
2026-020.219,117
2026-010.120,770
2025-120.122,187
2025-110.221,474
2025-100.122,215
2025-090.222,484
2025-080.123,148
2025-07<0.123,461
2025-060.323,029
2025-050.224,232
2025-040.223,797
2025-030.224,700
2025-020.322,388
2025-010.324,538
2024-120.425,426
2024-110.824,668
2024-100.224,824
2024-090.424,481
2024-080.325,564
2024-070.124,509

Source: CommoVision (commovision.com)

Source: CommoVision · Tarrant County, Texas, data through July 2026.

Well map

A map of 5,407 well locations in Tarrant County, Texas for which CommoVision holds a published surface coordinate, each drawn where it is and colored by its primary product (green for oil, red for natural gas, gray where undetermined; a spot shared by more than one product shows the one with the most wells there), on a ground of land and water over faint county outlines and place names for orientation, with the drilled wellbore path traced for 3,992 wells, with a small inset map locating this frame in Texas.
  • Oil 40
  • Natural gas 5,360
  • Undetermined 7
5,407 well locations in Tarrant County, Texas, colored by primary product. The drilled path is traced for 3,992 wells from the directional surveys we hold.
About this map

Undetermined means not enough signal to settle it. Producing wells are the ones that reported oil or gas in the 12 months to Jun 2026.

17.8 bbl/d (est.) Jul 2026 oil production Jul 2026 is still filling in. The figure is the filings already in plus an estimate of the part not yet filed. The change compares this estimate with the same month last year. +1,248.8% vs Jul last year
738.8 MMcf/d (est.) Jul 2026 gas production Jul 2026 is still filling in. The figure is the filings already in plus an estimate of the part not yet filed. The change compares this estimate with the same month last year. -2.4% vs Jul last year
6.2 bbl/d 2025 oil production
760.7 MMcf/d 2025 gas production
3,556 wells Producing wells tracked 12 months to Jun 2026

Type curves

Tarrant County, Texas natural gas type curves (Mcf/d per well, log scale, against months on production; cohorts 2010–2026)
Tarrant County, Texas natural gas type curves: average thousand cubic feet per day per well on a log scale against months on production 2010-2014: 1,956 wells; starts at 1,434 Mcf/d per well, 2.2 Bcf cumulative through month 139 (100% of its wells old enough at that month); the dashed curve runs through month 199, on our forecast where a well’s own record ends2015: 55 wells; starts at 1,869 Mcf/d per well, 2.6 Bcf cumulative through month 127 (100% of its wells old enough at that month); the dashed curve runs through month 187, on our forecast where a well’s own record ends2016: 46 wells; starts at 1,150 Mcf/d per well, 2.0 Bcf cumulative through month 115 (100% of its wells old enough at that month); the dashed curve runs through month 175, on our forecast where a well’s own record ends2017: 13 wells; starts at 1,849 Mcf/d per well, 3.0 Bcf cumulative through month 103 (100% of its wells old enough at that month); the dashed curve runs through month 163, on our forecast where a well’s own record ends2018: 28 wells; starts at 1,528 Mcf/d per well, 2.5 Bcf cumulative through month 94 (100% of its wells old enough at that month); the dashed curve runs through month 154, on our forecast where a well’s own record ends2019: 6 wells; starts at 2,415 Mcf/d per well, 4.1 Bcf cumulative through month 84 (100% of its wells old enough at that month); the dashed curve runs through month 144, on our forecast where a well’s own record ends2020: 11 wells; starts at 4,213 Mcf/d per well, 4.2 Bcf cumulative through month 69 (100% of its wells old enough at that month); the dashed curve runs through month 129, on our forecast where a well’s own record ends2021: 19 wells; starts at 3,430 Mcf/d per well, 3.3 Bcf cumulative through month 57 (100% of its wells old enough at that month); the dashed curve runs through month 117, on our forecast where a well’s own record ends2022: 27 wells; starts at 2,648 Mcf/d per well, 2.3 Bcf cumulative through month 44 (100% of its wells old enough at that month); the dashed curve runs through month 104, on our forecast where a well’s own record ends2023: 16 wells; starts at 1,869 Mcf/d per well, 2.1 Bcf cumulative through month 34 (100% of its wells old enough at that month); the dashed curve runs through month 94, on our forecast where a well’s own record ends2024: 33 wells; starts at 1,759 Mcf/d per well, 1.6 Bcf cumulative through month 19 (100% of its wells old enough at that month); the dashed curve runs through month 79, on our forecast where a well’s own record ends2025: 10 wells; starts at 1,144 Mcf/d per well, 0.8 Bcf cumulative through month 10 (100% of its wells old enough at that month); the dashed curve runs through month 70, on our forecast where a well’s own record ends2026: 10 wells; starts at 2,876 Mcf/d per well, 0.1 Bcf cumulative through month 1 (100% of its wells old enough at that month); the dashed curve runs through month 61, on our forecast where a well’s own record ends1002005001,0002,0005,0007,000Mcf/d24487296120144168192216Months on production
Tarrant County, Texas oil type curves (bbl/d per well, log scale, against months on production; cohorts 2010–2016)
Tarrant County, Texas oil type curves: average barrels per day per well on a log scale against months on production 2010-2014: 1,956 wells; starts at 0.1 bbl/d per well, 0.0 Mbbl cumulative through month 5 (100% of its wells old enough at that month)2015: 55 wells; starts at 0.2 bbl/d per well, 0.0 Mbbl cumulative through month 20 (100% of its wells old enough at that month)2016: 46 wells; starts at 0.1 bbl/d per well, 0.0 Mbbl cumulative through month 4 (100% of its wells old enough at that month)0.10.2bbl/d1224Months on production

Horizontal wells only. Average production per well, for wells grouped by when they first produced.

How these curves are built

Horizontal wells only: 2,230 of the 2,236 wells in these cohorts. Average daily production per well, for wells grouped by when they first produced. Includes every well of the cohort that is old enough at each month. Wells that are shut in or have stopped producing count as zero, so the average reflects the full cohort, not just survivors. Rates are calendar-day (volume ÷ days in month). The cumulative axis accumulates those same monthly averages at the average month length. Months not yet fully reported are excluded. The 2010-2014 curve draws those years as one group. The chart opens on average daily rate against months on production, the rate on a log scale. The view control switches to rate against cumulative production per well, on the same log rate scale, or to cumulative production per well against months on production, on a linear scale. Every view draws the same cohorts from the same production history. Each cohort with a dashed curve is solid through the last month all of its wells sit inside fully reported data. Past it the dashed curve carries the same wells forward, on our forecast where a well’s own record ends, for up to five years. A dashed curve runs as far as at least nine in ten of its wells are accounted for. A cohort with no dashed curve is drawn only through the months where at least 30% of its wells are old enough for the month to be fully reported. A well that is old enough but shut in still counts, as zero. The measured months are what these wells reported. In the forward months each well counts its own reported figure for each month it has one, our forecast for each month it has only that, and zero for the rest. The forward average counts every well of the cohort. The drawn forecast runs up to five years past the measured months. Line thickness tracks how many wells each curve is drawn from.

Cohort summary table
First produced Wells Peak oil (bbl/d per well) Month-12 oil (bbl/d per well) Cum oil in series (Mbbl per well) Peak gas (Mcf/d per well) Month-12 gas (Mcf/d per well) Cum gas in series (Bcf per well) Months in series Wells old enough at last month in series Forecast months drawn
2026 10 0 0.0 2,876 0.1 1 100% 60
2025 10 0 0 0.0 4,612 0.8 18 50% 60
2024 33 0 0 0.0 5,232 2,435 1.6 26 52% 60
2023 16 0 0 0.0 3,492 2,000 2.1 39 38% 60
2022 27 0 0 0.0 3,990 1,880 2.3 49 41% 60
2021 19 0 0 0.0 6,628 2,516 3.3 61 42% 60
2020 11 0 0 0.0 5,653 2,737 4.2 78 45% 60
2019 6 0 0 0.0 5,637 2,675 4.1 90 50% 60
2018 28 0 0 0.0 3,556 1,498 2.5 99 54% 60
2017 13 0 0 0.0 4,251 1,944 3.0 106 38% 60
2016 46 0.1 0 0.0 2,582 1,207 2.0 125 39% 60
2015 55 0.2 0 0.0 3,264 1,445 2.6 134 40% 60
2010-2014 1,956 0.1 0 0.0 2,409 1,112 2.2 187 30% 60

Source: CommoVision (commovision.com)

Source: CommoVision · Tarrant County, Texas type curves, per-well production by first-production cohort.

Top operators in Tarrant County, Texas, 2025

  1. TEP Barnett USA 49.6%
  2. BKV Corporation 22.5%
  3. BKV Barnett 7.3%
  4. EagleRidge Operating 5.9%
  5. UPP Operating 3.4%
  6. Diversified Energy Company 3.1%
  7. Javelin Energy Partners 2.5%
  8. GHA Barnett 2.1%
  9. Bedrock Production 2.0%
  10. BRG Lone Star 0.4%
  11. 13 other operators 1.2%
Top operators in Tarrant County, Texas, 2025: full table
OperatorOil (Mbbl/d, 2025)Gas produced (MMcf/d, 2025)Share of output
TEP Barnett USA 0.0377.349.6%
BKV Corporation 0.0171.022.5%
BKV Barnett 0.055.87.3%
EagleRidge Operating 0.044.55.9%
UPP Operating 0.025.93.4%
Diversified Energy Company 0.023.43.1%
Javelin Energy Partners (January to November) 0.021.02.5%
GHA Barnett 0.016.02.1%
Bedrock Production (January to August) 0.023.12.0%
BRG Lone Star 0.03.10.4%
13 other operators 0.09.01.2%

Mbbl/d = thousand barrels per day · MMcf/d = million cubic feet per day (units).

Source: CommoVision (commovision.com)

Active drilling rigs

0 rigs active in the week to September 11, 2026
±0 rigs vs the same week a year earlier
2 rigs peak week, Jan 2022 (since Sep 2016)
Active drilling rigs by rig type (rigs, weekly count)Source: Baker Hughes rig count
Oil Gas
Active drilling rigs by rig type: rigs, weekly count 0.5 1 1.5 2 2.5 rigs 2017201820192020202120222023202420252026 Week to Sep 16, 2016: 0 rigs total (Oil 0, Gas 0) Week to Sep 23, 2016: 0 rigs total (Oil 0, Gas 0) Week to Sep 30, 2016: 0 rigs total (Oil 0, Gas 0) Week to Oct 7, 2016: 0 rigs total (Oil 0, Gas 0) Week to Oct 14, 2016: 0 rigs total (Oil 0, Gas 0) Week to Oct 21, 2016: 0 rigs total (Oil 0, Gas 0) Week to Oct 28, 2016: 0 rigs total (Oil 0, Gas 0) Week to Nov 4, 2016: 0 rigs total (Oil 0, Gas 0) Week to Nov 11, 2016: 0 rigs total (Oil 0, Gas 0) Week to Nov 18, 2016: 0 rigs total (Oil 0, Gas 0) Week to Nov 23, 2016: 0 rigs total (Oil 0, Gas 0) Week to Dec 2, 2016: 0 rigs total (Oil 0, Gas 0) Week to Dec 9, 2016: 0 rigs total (Oil 0, Gas 0) Week to Dec 16, 2016: 0 rigs total (Oil 0, Gas 0) Week to Dec 23, 2016: 0 rigs total (Oil 0, Gas 0) Week to Dec 30, 2016: 0 rigs total (Oil 0, Gas 0) Week to Jan 6, 2017: 0 rigs total (Oil 0, Gas 0) Week to Jan 13, 2017: 0 rigs total (Oil 0, Gas 0) Week to Jan 20, 2017: 0 rigs total (Oil 0, Gas 0) Week to Jan 27, 2017: 0 rigs total (Oil 0, Gas 0) Week to Feb 3, 2017: 0 rigs total (Oil 0, Gas 0) Week to Feb 10, 2017: 0 rigs total (Oil 0, Gas 0) Week to Feb 17, 2017: 0 rigs total (Oil 0, Gas 0) Week to Feb 24, 2017: 0 rigs total (Oil 0, Gas 0) Week to Mar 3, 2017: 0 rigs total (Oil 0, Gas 0) Week to Mar 10, 2017: 0 rigs total (Oil 0, Gas 0) Week to Mar 17, 2017: 0 rigs total (Oil 0, Gas 0) Week to Mar 24, 2017: 0 rigs total (Oil 0, Gas 0) Week to Mar 31, 2017: 0 rigs total (Oil 0, Gas 0) Week to Apr 7, 2017: 0 rigs total (Oil 0, Gas 0) Week to Apr 13, 2017: 0 rigs total (Oil 0, Gas 0) Week to Apr 21, 2017: 0 rigs total (Oil 0, Gas 0) Week to Apr 28, 2017: 0 rigs total (Oil 0, Gas 0) Week to May 5, 2017: 0 rigs total (Oil 0, Gas 0) Week to May 12, 2017: 0 rigs total (Oil 0, Gas 0) Week to May 19, 2017: 0 rigs total (Oil 0, Gas 0) Week to May 26, 2017: 0 rigs total (Oil 0, Gas 0) Week to Jun 2, 2017: 0 rigs total (Oil 0, Gas 0) Week to Jun 9, 2017: 1 rig total (Oil 0, Gas 1) Week to Jun 16, 2017: 1 rig total (Oil 0, Gas 1) Week to Jun 23, 2017: 1 rig total (Oil 0, Gas 1) Week to Jun 30, 2017: 1 rig total (Oil 0, Gas 1) Week to Jul 7, 2017: 1 rig total (Oil 0, Gas 1) Week to Jul 14, 2017: 1 rig total (Oil 0, Gas 1) Week to Jul 21, 2017: 0 rigs total (Oil 0, Gas 0) Week to Jul 28, 2017: 0 rigs total (Oil 0, Gas 0) Week to Aug 4, 2017: 0 rigs total (Oil 0, Gas 0) Week to Aug 11, 2017: 0 rigs total (Oil 0, Gas 0) Week to Aug 18, 2017: 0 rigs total (Oil 0, Gas 0) Week to Aug 25, 2017: 0 rigs total (Oil 0, Gas 0) Week to Sep 1, 2017: 0 rigs total (Oil 0, Gas 0) Week to Sep 8, 2017: 0 rigs total (Oil 0, Gas 0) Week to Sep 15, 2017: 1 rig total (Oil 0, Gas 1) Week to Sep 22, 2017: 1 rig total (Oil 0, Gas 1) Week to Sep 29, 2017: 1 rig total (Oil 0, Gas 1) Week to Oct 6, 2017: 1 rig total (Oil 0, Gas 1) Week to Oct 13, 2017: 1 rig total (Oil 0, Gas 1) Week to Oct 20, 2017: 1 rig total (Oil 0, Gas 1) Week to Oct 27, 2017: 1 rig total (Oil 0, Gas 1) Week to Nov 3, 2017: 1 rig total (Oil 0, Gas 1) Week to Nov 10, 2017: 1 rig total (Oil 0, Gas 1) Week to Nov 17, 2017: 1 rig total (Oil 0, Gas 1) Week to Nov 22, 2017: 1 rig total (Oil 0, Gas 1) Week to Dec 1, 2017: 1 rig total (Oil 0, Gas 1) Week to Dec 8, 2017: 1 rig total (Oil 0, Gas 1) Week to Dec 15, 2017: 1 rig total (Oil 0, Gas 1) Week to Dec 22, 2017: 1 rig total (Oil 0, Gas 1) Week to Dec 29, 2017: 1 rig total (Oil 0, Gas 1) Week to Jan 5, 2018: 1 rig total (Oil 0, Gas 1) Week to Jan 12, 2018: 1 rig total (Oil 0, Gas 1) Week to Jan 19, 2018: 1 rig total (Oil 0, Gas 1) Week to Jan 26, 2018: 1 rig total (Oil 0, Gas 1) Week to Feb 2, 2018: 1 rig total (Oil 0, Gas 1) Week to Feb 9, 2018: 1 rig total (Oil 0, Gas 1) Week to Feb 16, 2018: 1 rig total (Oil 0, Gas 1) Week to Feb 23, 2018: 1 rig total (Oil 0, Gas 1) Week to Mar 2, 2018: 1 rig total (Oil 0, Gas 1) Week to Mar 9, 2018: 1 rig total (Oil 0, Gas 1) Week to Mar 16, 2018: 1 rig total (Oil 0, Gas 1) Week to Mar 23, 2018: 1 rig total (Oil 0, Gas 1) Week to Mar 29, 2018: 1 rig total (Oil 0, Gas 1) Week to Apr 6, 2018: 1 rig total (Oil 0, Gas 1) Week to Apr 13, 2018: 1 rig total (Oil 0, Gas 1) Week to Apr 20, 2018: 1 rig total (Oil 0, Gas 1) Week to Apr 27, 2018: 1 rig total (Oil 0, Gas 1) Week to May 4, 2018: 1 rig total (Oil 0, Gas 1) Week to May 11, 2018: 1 rig total (Oil 0, Gas 1) Week to May 18, 2018: 1 rig total (Oil 0, Gas 1) Week to May 25, 2018: 1 rig total (Oil 0, Gas 1) Week to Jun 1, 2018: 1 rig total (Oil 0, Gas 1) Week to Jun 8, 2018: 1 rig total (Oil 0, Gas 1) Week to Jun 15, 2018: 1 rig total (Oil 0, Gas 1) Week to Jun 22, 2018: 1 rig total (Oil 0, Gas 1) Week to Jun 29, 2018: 1 rig total (Oil 0, Gas 1) Week to Jul 6, 2018: 1 rig total (Oil 0, Gas 1) Week to Jul 13, 2018: 1 rig total (Oil 0, Gas 1) Week to Jul 20, 2018: 1 rig total (Oil 0, Gas 1) Week to Jul 27, 2018: 1 rig total (Oil 0, Gas 1) Week to Aug 3, 2018: 1 rig total (Oil 0, Gas 1) Week to Aug 10, 2018: 1 rig total (Oil 0, Gas 1) Week to Aug 17, 2018: 1 rig total (Oil 0, Gas 1) Week to Aug 24, 2018: 1 rig total (Oil 0, Gas 1) Week to Aug 31, 2018: 1 rig total (Oil 0, Gas 1) Week to Sep 7, 2018: 1 rig total (Oil 0, Gas 1) Week to Sep 14, 2018: 1 rig total (Oil 0, Gas 1) Week to Sep 21, 2018: 1 rig total (Oil 0, Gas 1) Week to Sep 28, 2018: 1 rig total (Oil 0, Gas 1) Week to Oct 5, 2018: 1 rig total (Oil 0, Gas 1) Week to Oct 12, 2018: 1 rig total (Oil 0, Gas 1) Week to Oct 19, 2018: 1 rig total (Oil 0, Gas 1) Week to Oct 26, 2018: 0 rigs total (Oil 0, Gas 0) Week to Nov 2, 2018: 0 rigs total (Oil 0, Gas 0) Week to Nov 9, 2018: 0 rigs total (Oil 0, Gas 0) Week to Nov 16, 2018: 0 rigs total (Oil 0, Gas 0) Week to Nov 21, 2018: 0 rigs total (Oil 0, Gas 0) Week to Nov 30, 2018: 0 rigs total (Oil 0, Gas 0) Week to Dec 7, 2018: 0 rigs total (Oil 0, Gas 0) Week to Dec 14, 2018: 0 rigs total (Oil 0, Gas 0) Week to Dec 21, 2018: 0 rigs total (Oil 0, Gas 0) Week to Dec 28, 2018: 0 rigs total (Oil 0, Gas 0) Week to Jan 4, 2019: 0 rigs total (Oil 0, Gas 0) Week to Jan 11, 2019: 0 rigs total (Oil 0, Gas 0) Week to Jan 18, 2019: 0 rigs total (Oil 0, Gas 0) Week to Jan 25, 2019: 0 rigs total (Oil 0, Gas 0) Week to Feb 1, 2019: 0 rigs total (Oil 0, Gas 0) Week to Feb 8, 2019: 0 rigs total (Oil 0, Gas 0) Week to Feb 15, 2019: 0 rigs total (Oil 0, Gas 0) Week to Feb 22, 2019: 0 rigs total (Oil 0, Gas 0) Week to Mar 1, 2019: 0 rigs total (Oil 0, Gas 0) Week to Mar 8, 2019: 0 rigs total (Oil 0, Gas 0) Week to Mar 15, 2019: 0 rigs total (Oil 0, Gas 0) Week to Mar 22, 2019: 0 rigs total (Oil 0, Gas 0) Week to Mar 29, 2019: 0 rigs total (Oil 0, Gas 0) Week to Apr 5, 2019: 0 rigs total (Oil 0, Gas 0) Week to Apr 12, 2019: 0 rigs total (Oil 0, Gas 0) Week to Apr 18, 2019: 0 rigs total (Oil 0, Gas 0) Week to Apr 26, 2019: 0 rigs total (Oil 0, Gas 0) Week to May 3, 2019: 0 rigs total (Oil 0, Gas 0) Week to May 10, 2019: 0 rigs total (Oil 0, Gas 0) Week to May 17, 2019: 0 rigs total (Oil 0, Gas 0) Week to May 24, 2019: 0 rigs total (Oil 0, Gas 0) Week to May 31, 2019: 0 rigs total (Oil 0, Gas 0) Week to Jun 7, 2019: 0 rigs total (Oil 0, Gas 0) Week to Jun 14, 2019: 0 rigs total (Oil 0, Gas 0) Week to Jun 21, 2019: 0 rigs total (Oil 0, Gas 0) Week to Jun 28, 2019: 0 rigs total (Oil 0, Gas 0) Week to Jul 3, 2019: 0 rigs total (Oil 0, Gas 0) Week to Jul 12, 2019: 0 rigs total (Oil 0, Gas 0) Week to Jul 19, 2019: 0 rigs total (Oil 0, Gas 0) Week to Jul 26, 2019: 0 rigs total (Oil 0, Gas 0) Week to Aug 2, 2019: 0 rigs total (Oil 0, Gas 0) Week to Aug 9, 2019: 0 rigs total (Oil 0, Gas 0) Week to Aug 16, 2019: 0 rigs total (Oil 0, Gas 0) Week to Aug 23, 2019: 0 rigs total (Oil 0, Gas 0) Week to Aug 30, 2019: 0 rigs total (Oil 0, Gas 0) Week to Sep 6, 2019: 0 rigs total (Oil 0, Gas 0) Week to Sep 13, 2019: 0 rigs total (Oil 0, Gas 0) Week to Sep 20, 2019: 0 rigs total (Oil 0, Gas 0) Week to Sep 27, 2019: 0 rigs total (Oil 0, Gas 0) Week to Oct 4, 2019: 0 rigs total (Oil 0, Gas 0) Week to Oct 11, 2019: 0 rigs total (Oil 0, Gas 0) Week to Oct 18, 2019: 0 rigs total (Oil 0, Gas 0) Week to Oct 25, 2019: 0 rigs total (Oil 0, Gas 0) Week to Nov 1, 2019: 0 rigs total (Oil 0, Gas 0) Week to Nov 8, 2019: 0 rigs total (Oil 0, Gas 0) Week to Nov 15, 2019: 0 rigs total (Oil 0, Gas 0) Week to Nov 22, 2019: 0 rigs total (Oil 0, Gas 0) Week to Nov 27, 2019: 0 rigs total (Oil 0, Gas 0) Week to Dec 6, 2019: 0 rigs total (Oil 0, Gas 0) Week to Dec 13, 2019: 0 rigs total (Oil 0, Gas 0) Week to Dec 20, 2019: 0 rigs total (Oil 0, Gas 0) Week to Dec 27, 2019: 0 rigs total (Oil 0, Gas 0) Week to Jan 3, 2020: 0 rigs total (Oil 0, Gas 0) Week to Jan 10, 2020: 0 rigs total (Oil 0, Gas 0) Week to Jan 17, 2020: 0 rigs total (Oil 0, Gas 0) Week to Jan 24, 2020: 0 rigs total (Oil 0, Gas 0) Week to Jan 31, 2020: 0 rigs total (Oil 0, Gas 0) Week to Feb 7, 2020: 0 rigs total (Oil 0, Gas 0) Week to Feb 14, 2020: 0 rigs total (Oil 0, Gas 0) Week to Feb 21, 2020: 0 rigs total (Oil 0, Gas 0) Week to Feb 28, 2020: 0 rigs total (Oil 0, Gas 0) Week to Mar 6, 2020: 0 rigs total (Oil 0, Gas 0) Week to Mar 13, 2020: 0 rigs total (Oil 0, Gas 0) Week to Mar 20, 2020: 0 rigs total (Oil 0, Gas 0) Week to Mar 27, 2020: 0 rigs total (Oil 0, Gas 0) Week to Apr 3, 2020: 0 rigs total (Oil 0, Gas 0) Week to Apr 9, 2020: 0 rigs total (Oil 0, Gas 0) Week to Apr 17, 2020: 0 rigs total (Oil 0, Gas 0) Week to Apr 24, 2020: 0 rigs total (Oil 0, Gas 0) Week to May 1, 2020: 0 rigs total (Oil 0, Gas 0) Week to May 8, 2020: 0 rigs total (Oil 0, Gas 0) Week to May 15, 2020: 0 rigs total (Oil 0, Gas 0) Week to May 22, 2020: 0 rigs total (Oil 0, Gas 0) Week to May 29, 2020: 0 rigs total (Oil 0, Gas 0) Week to Jun 5, 2020: 0 rigs total (Oil 0, Gas 0) Week to Jun 12, 2020: 0 rigs total (Oil 0, Gas 0) Week to Jun 19, 2020: 0 rigs total (Oil 0, Gas 0) Week to Jun 26, 2020: 0 rigs total (Oil 0, Gas 0) Week to Jul 2, 2020: 0 rigs total (Oil 0, Gas 0) Week to Jul 10, 2020: 0 rigs total (Oil 0, Gas 0) Week to Jul 17, 2020: 0 rigs total (Oil 0, Gas 0) Week to Jul 24, 2020: 0 rigs total (Oil 0, Gas 0) Week to Jul 31, 2020: 0 rigs total (Oil 0, Gas 0) Week to Aug 7, 2020: 0 rigs total (Oil 0, Gas 0) Week to Aug 14, 2020: 0 rigs total (Oil 0, Gas 0) Week to Aug 21, 2020: 0 rigs total (Oil 0, Gas 0) Week to Aug 28, 2020: 0 rigs total (Oil 0, Gas 0) Week to Sep 4, 2020: 0 rigs total (Oil 0, Gas 0) Week to Sep 11, 2020: 0 rigs total (Oil 0, Gas 0) Week to Sep 18, 2020: 0 rigs total (Oil 0, Gas 0) Week to Sep 25, 2020: 0 rigs total (Oil 0, Gas 0) Week to Oct 2, 2020: 0 rigs total (Oil 0, Gas 0) Week to Oct 9, 2020: 0 rigs total (Oil 0, Gas 0) Week to Oct 16, 2020: 0 rigs total (Oil 0, Gas 0) Week to Oct 23, 2020: 0 rigs total (Oil 0, Gas 0) Week to Oct 30, 2020: 0 rigs total (Oil 0, Gas 0) Week to Nov 6, 2020: 0 rigs total (Oil 0, Gas 0) Week to Nov 13, 2020: 0 rigs total (Oil 0, Gas 0) Week to Nov 20, 2020: 0 rigs total (Oil 0, Gas 0) Week to Nov 25, 2020: 0 rigs total (Oil 0, Gas 0) Week to Dec 4, 2020: 0 rigs total (Oil 0, Gas 0) Week to Dec 11, 2020: 0 rigs total (Oil 0, Gas 0) Week to Dec 18, 2020: 0 rigs total (Oil 0, Gas 0) Week to Dec 23, 2020: 0 rigs total (Oil 0, Gas 0) Week to Dec 31, 2020: 0 rigs total (Oil 0, Gas 0) Week to Jan 8, 2021: 0 rigs total (Oil 0, Gas 0) Week to Jan 15, 2021: 0 rigs total (Oil 0, Gas 0) Week to Jan 22, 2021: 1 rig total (Oil 0, Gas 1) Week to Jan 29, 2021: 1 rig total (Oil 0, Gas 1) Week to Feb 5, 2021: 1 rig total (Oil 0, Gas 1) Week to Feb 12, 2021: 1 rig total (Oil 0, Gas 1) Week to Feb 19, 2021: 1 rig total (Oil 0, Gas 1) Week to Feb 26, 2021: 1 rig total (Oil 0, Gas 1) Week to Mar 5, 2021: 1 rig total (Oil 1, Gas 0) Week to Mar 12, 2021: 1 rig total (Oil 1, Gas 0) Week to Mar 19, 2021: 1 rig total (Oil 1, Gas 0) Week to Mar 26, 2021: 1 rig total (Oil 1, Gas 0) Week to Apr 1, 2021: 1 rig total (Oil 1, Gas 0) Week to Apr 9, 2021: 1 rig total (Oil 1, Gas 0) Week to Apr 16, 2021: 1 rig total (Oil 1, Gas 0) Week to Apr 23, 2021: 1 rig total (Oil 1, Gas 0) Week to Apr 30, 2021: 1 rig total (Oil 1, Gas 0) Week to May 7, 2021: 1 rig total (Oil 1, Gas 0) Week to May 14, 2021: 1 rig total (Oil 1, Gas 0) Week to May 21, 2021: 1 rig total (Oil 1, Gas 0) Week to May 28, 2021: 1 rig total (Oil 1, Gas 0) Week to Jun 4, 2021: 1 rig total (Oil 1, Gas 0) Week to Jun 11, 2021: 1 rig total (Oil 1, Gas 0) Week to Jun 18, 2021: 1 rig total (Oil 1, Gas 0) Week to Jun 25, 2021: 0 rigs total (Oil 0, Gas 0) Week to Jul 2, 2021: 0 rigs total (Oil 0, Gas 0) Week to Jul 9, 2021: 0 rigs total (Oil 0, Gas 0) Week to Jul 16, 2021: 0 rigs total (Oil 0, Gas 0) Week to Jul 23, 2021: 0 rigs total (Oil 0, Gas 0) Week to Jul 30, 2021: 0 rigs total (Oil 0, Gas 0) Week to Aug 6, 2021: 0 rigs total (Oil 0, Gas 0) Week to Aug 13, 2021: 0 rigs total (Oil 0, Gas 0) Week to Aug 20, 2021: 0 rigs total (Oil 0, Gas 0) Week to Aug 27, 2021: 0 rigs total (Oil 0, Gas 0) Week to Sep 3, 2021: 0 rigs total (Oil 0, Gas 0) Week to Sep 10, 2021: 0 rigs total (Oil 0, Gas 0) Week to Sep 17, 2021: 0 rigs total (Oil 0, Gas 0) Week to Sep 24, 2021: 0 rigs total (Oil 0, Gas 0) Week to Oct 1, 2021: 0 rigs total (Oil 0, Gas 0) Week to Oct 8, 2021: 0 rigs total (Oil 0, Gas 0) Week to Oct 15, 2021: 0 rigs total (Oil 0, Gas 0) Week to Oct 22, 2021: 0 rigs total (Oil 0, Gas 0) Week to Oct 29, 2021: 0 rigs total (Oil 0, Gas 0) Week to Nov 5, 2021: 0 rigs total (Oil 0, Gas 0) Week to Nov 12, 2021: 0 rigs total (Oil 0, Gas 0) Week to Nov 19, 2021: 0 rigs total (Oil 0, Gas 0) Week to Nov 24, 2021: 0 rigs total (Oil 0, Gas 0) Week to Dec 3, 2021: 0 rigs total (Oil 0, Gas 0) Week to Dec 10, 2021: 0 rigs total (Oil 0, Gas 0) Week to Dec 17, 2021: 0 rigs total (Oil 0, Gas 0) Week to Dec 23, 2021: 0 rigs total (Oil 0, Gas 0) Week to Dec 31, 2021: 0 rigs total (Oil 0, Gas 0) Week to Jan 7, 2022: 0 rigs total (Oil 0, Gas 0) Week to Jan 14, 2022: 0 rigs total (Oil 0, Gas 0) Week to Jan 21, 2022: 0 rigs total (Oil 0, Gas 0) Week to Jan 28, 2022: 2 rigs total (Oil 2, Gas 0) Week to Feb 4, 2022: 2 rigs total (Oil 2, Gas 0) Week to Feb 11, 2022: 2 rigs total (Oil 2, Gas 0) Week to Feb 18, 2022: 2 rigs total (Oil 2, Gas 0) Week to Feb 25, 2022: 2 rigs total (Oil 2, Gas 0) Week to Mar 4, 2022: 2 rigs total (Oil 2, Gas 0) Week to Mar 11, 2022: 2 rigs total (Oil 2, Gas 0) Week to Mar 18, 2022: 2 rigs total (Oil 2, Gas 0) Week to Mar 25, 2022: 2 rigs total (Oil 2, Gas 0) Week to Apr 1, 2022: 2 rigs total (Oil 2, Gas 0) Week to Apr 8, 2022: 2 rigs total (Oil 2, Gas 0) Week to Apr 14, 2022: 2 rigs total (Oil 2, Gas 0) Week to Apr 22, 2022: 2 rigs total (Oil 2, Gas 0) Week to Apr 29, 2022: 2 rigs total (Oil 2, Gas 0) Week to May 6, 2022: 2 rigs total (Oil 2, Gas 0) Week to May 13, 2022: 2 rigs total (Oil 2, Gas 0) Week to May 20, 2022: 2 rigs total (Oil 2, Gas 0) Week to May 27, 2022: 2 rigs total (Oil 2, Gas 0) Week to Jun 3, 2022: 2 rigs total (Oil 2, Gas 0) Week to Jun 10, 2022: 2 rigs total (Oil 2, Gas 0) Week to Jun 17, 2022: 2 rigs total (Oil 2, Gas 0) Week to Jun 24, 2022: 2 rigs total (Oil 2, Gas 0) Week to Jul 1, 2022: 2 rigs total (Oil 2, Gas 0) Week to Jul 8, 2022: 2 rigs total (Oil 2, Gas 0) Week to Jul 15, 2022: 2 rigs total (Oil 2, Gas 0) Week to Jul 22, 2022: 2 rigs total (Oil 2, Gas 0) Week to Jul 29, 2022: 2 rigs total (Oil 2, Gas 0) Week to Aug 5, 2022: 2 rigs total (Oil 2, Gas 0) Week to Aug 12, 2022: 1 rig total (Oil 1, Gas 0) Week to Aug 19, 2022: 1 rig total (Oil 1, Gas 0) Week to Aug 26, 2022: 1 rig total (Oil 1, Gas 0) Week to Sep 2, 2022: 1 rig total (Oil 1, Gas 0) Week to Sep 9, 2022: 1 rig total (Oil 1, Gas 0) Week to Sep 16, 2022: 1 rig total (Oil 1, Gas 0) Week to Sep 23, 2022: 1 rig total (Oil 1, Gas 0) Week to Sep 30, 2022: 1 rig total (Oil 1, Gas 0) Week to Oct 7, 2022: 1 rig total (Oil 1, Gas 0) Week to Oct 14, 2022: 1 rig total (Oil 1, Gas 0) Week to Oct 21, 2022: 1 rig total (Oil 1, Gas 0) Week to Oct 28, 2022: 1 rig total (Oil 1, Gas 0) Week to Nov 4, 2022: 1 rig total (Oil 1, Gas 0) Week to Nov 10, 2022: 1 rig total (Oil 1, Gas 0) Week to Nov 18, 2022: 1 rig total (Oil 1, Gas 0) Week to Nov 23, 2022: 1 rig total (Oil 1, Gas 0) Week to Dec 2, 2022: 1 rig total (Oil 1, Gas 0) Week to Dec 9, 2022: 1 rig total (Oil 1, Gas 0) Week to Dec 16, 2022: 1 rig total (Oil 1, Gas 0) Week to Dec 22, 2022: 1 rig total (Oil 1, Gas 0) Week to Dec 30, 2022: 1 rig total (Oil 1, Gas 0) Week to Jan 6, 2023: 1 rig total (Oil 1, Gas 0) Week to Jan 13, 2023: 1 rig total (Oil 1, Gas 0) Week to Jan 20, 2023: 1 rig total (Oil 1, Gas 0) Week to Jan 27, 2023: 1 rig total (Oil 1, Gas 0) Week to Feb 3, 2023: 1 rig total (Oil 1, Gas 0) Week to Feb 10, 2023: 1 rig total (Oil 1, Gas 0) Week to Feb 17, 2023: 1 rig total (Oil 1, Gas 0) Week to Feb 24, 2023: 1 rig total (Oil 1, Gas 0) Week to Mar 3, 2023: 1 rig total (Oil 1, Gas 0) Week to Mar 10, 2023: 1 rig total (Oil 1, Gas 0) Week to Mar 17, 2023: 1 rig total (Oil 1, Gas 0) Week to Mar 24, 2023: 1 rig total (Oil 1, Gas 0) Week to Mar 31, 2023: 1 rig total (Oil 1, Gas 0) Week to Apr 6, 2023: 1 rig total (Oil 1, Gas 0) Week to Apr 14, 2023: 1 rig total (Oil 1, Gas 0) Week to Apr 21, 2023: 1 rig total (Oil 1, Gas 0) Week to Apr 28, 2023: 1 rig total (Oil 1, Gas 0) Week to May 5, 2023: 1 rig total (Oil 1, Gas 0) Week to May 12, 2023: 1 rig total (Oil 1, Gas 0) Week to May 19, 2023: 1 rig total (Oil 1, Gas 0) Week to May 26, 2023: 0 rigs total (Oil 0, Gas 0) Week to Jun 2, 2023: 0 rigs total (Oil 0, Gas 0) Week to Jun 9, 2023: 0 rigs total (Oil 0, Gas 0) Week to Jun 16, 2023: 0 rigs total (Oil 0, Gas 0) Week to Jun 23, 2023: 0 rigs total (Oil 0, Gas 0) Week to Jun 30, 2023: 0 rigs total (Oil 0, Gas 0) Week to Jul 7, 2023: 0 rigs total (Oil 0, Gas 0) Week to Jul 14, 2023: 0 rigs total (Oil 0, Gas 0) Week to Jul 21, 2023: 0 rigs total (Oil 0, Gas 0) Week to Jul 28, 2023: 0 rigs total (Oil 0, Gas 0) Week to Aug 4, 2023: 0 rigs total (Oil 0, Gas 0) Week to Aug 11, 2023: 0 rigs total (Oil 0, Gas 0) Week to Aug 18, 2023: 0 rigs total (Oil 0, Gas 0) Week to Aug 25, 2023: 0 rigs total (Oil 0, Gas 0) Week to Sep 1, 2023: 0 rigs total (Oil 0, Gas 0) Week to Sep 8, 2023: 0 rigs total (Oil 0, Gas 0) Week to Sep 15, 2023: 0 rigs total (Oil 0, Gas 0) Week to Sep 22, 2023: 0 rigs total (Oil 0, Gas 0) Week to Sep 29, 2023: 0 rigs total (Oil 0, Gas 0) Week to Oct 6, 2023: 0 rigs total (Oil 0, Gas 0) Week to Oct 13, 2023: 0 rigs total (Oil 0, Gas 0) Week to Oct 20, 2023: 0 rigs total (Oil 0, Gas 0) Week to Oct 27, 2023: 0 rigs total (Oil 0, Gas 0) Week to Nov 3, 2023: 0 rigs total (Oil 0, Gas 0) Week to Nov 10, 2023: 0 rigs total (Oil 0, Gas 0) Week to Nov 17, 2023: 0 rigs total (Oil 0, Gas 0) Week to Nov 22, 2023: 0 rigs total (Oil 0, Gas 0) Week to Dec 1, 2023: 0 rigs total (Oil 0, Gas 0) Week to Dec 8, 2023: 0 rigs total (Oil 0, Gas 0) Week to Dec 15, 2023: 0 rigs total (Oil 0, Gas 0) Week to Dec 21, 2023: 0 rigs total (Oil 0, Gas 0) Week to Dec 29, 2023: 0 rigs total (Oil 0, Gas 0) Week to Jan 5, 2024: 0 rigs total (Oil 0, Gas 0) Week to Jan 12, 2024: 0 rigs total (Oil 0, Gas 0) Week to Jan 19, 2024: 0 rigs total (Oil 0, Gas 0) Week to Jan 26, 2024: 0 rigs total (Oil 0, Gas 0) Week to Feb 2, 2024: 0 rigs total (Oil 0, Gas 0) Week to Feb 9, 2024: 0 rigs total (Oil 0, Gas 0) Week to Feb 16, 2024: 0 rigs total (Oil 0, Gas 0) Week to Feb 23, 2024: 0 rigs total (Oil 0, Gas 0) Week to Mar 1, 2024: 0 rigs total (Oil 0, Gas 0) Week to Mar 8, 2024: 0 rigs total (Oil 0, Gas 0) Week to Mar 15, 2024: 0 rigs total (Oil 0, Gas 0) Week to Mar 22, 2024: 0 rigs total (Oil 0, Gas 0) Week to Mar 28, 2024: 0 rigs total (Oil 0, Gas 0) Week to Apr 5, 2024: 0 rigs total (Oil 0, Gas 0) Week to Apr 12, 2024: 0 rigs total (Oil 0, Gas 0) Week to Apr 19, 2024: 0 rigs total (Oil 0, Gas 0) Week to Apr 26, 2024: 0 rigs total (Oil 0, Gas 0) Week to May 3, 2024: 0 rigs total (Oil 0, Gas 0) Week to May 10, 2024: 0 rigs total (Oil 0, Gas 0) Week to May 17, 2024: 0 rigs total (Oil 0, Gas 0) Week to May 24, 2024: 0 rigs total (Oil 0, Gas 0) Week to May 31, 2024: 0 rigs total (Oil 0, Gas 0) Week to Jun 7, 2024: 0 rigs total (Oil 0, Gas 0) Week to Jun 14, 2024: 0 rigs total (Oil 0, Gas 0) Week to Jun 21, 2024: 0 rigs total (Oil 0, Gas 0) Week to Jun 28, 2024: 0 rigs total (Oil 0, Gas 0) Week to Jul 5, 2024: 0 rigs total (Oil 0, Gas 0) Week to Jul 12, 2024: 0 rigs total (Oil 0, Gas 0) Week to Jul 19, 2024: 0 rigs total (Oil 0, Gas 0) Week to Jul 26, 2024: 0 rigs total (Oil 0, Gas 0) Week to Aug 2, 2024: 0 rigs total (Oil 0, Gas 0) Week to Aug 9, 2024: 0 rigs total (Oil 0, Gas 0) Week to Aug 16, 2024: 0 rigs total (Oil 0, Gas 0) Week to Aug 23, 2024: 0 rigs total (Oil 0, Gas 0) Week to Aug 30, 2024: 0 rigs total (Oil 0, Gas 0) Week to Sep 6, 2024: 0 rigs total (Oil 0, Gas 0) Week to Sep 13, 2024: 0 rigs total (Oil 0, Gas 0) Week to Sep 20, 2024: 0 rigs total (Oil 0, Gas 0) Week to Sep 27, 2024: 0 rigs total (Oil 0, Gas 0) Week to Oct 4, 2024: 0 rigs total (Oil 0, Gas 0) Week to Oct 11, 2024: 0 rigs total (Oil 0, Gas 0) Week to Oct 18, 2024: 0 rigs total (Oil 0, Gas 0) Week to Oct 25, 2024: 0 rigs total (Oil 0, Gas 0) Week to Nov 1, 2024: 0 rigs total (Oil 0, Gas 0) Week to Nov 8, 2024: 0 rigs total (Oil 0, Gas 0) Week to Nov 15, 2024: 0 rigs total (Oil 0, Gas 0) Week to Nov 22, 2024: 0 rigs total (Oil 0, Gas 0) Week to Nov 27, 2024: 0 rigs total (Oil 0, Gas 0) Week to Dec 6, 2024: 0 rigs total (Oil 0, Gas 0) Week to Dec 13, 2024: 0 rigs total (Oil 0, Gas 0) Week to Dec 20, 2024: 0 rigs total (Oil 0, Gas 0) Week to Dec 27, 2024: 0 rigs total (Oil 0, Gas 0) Week to Jan 3, 2025: 0 rigs total (Oil 0, Gas 0) Week to Jan 10, 2025: 0 rigs total (Oil 0, Gas 0) Week to Jan 17, 2025: 0 rigs total (Oil 0, Gas 0) Week to Jan 24, 2025: 0 rigs total (Oil 0, Gas 0) Week to Jan 31, 2025: 0 rigs total (Oil 0, Gas 0) Week to Feb 7, 2025: 0 rigs total (Oil 0, Gas 0) Week to Feb 14, 2025: 0 rigs total (Oil 0, Gas 0) Week to Feb 21, 2025: 0 rigs total (Oil 0, Gas 0) Week to Feb 28, 2025: 0 rigs total (Oil 0, Gas 0) Week to Mar 7, 2025: 0 rigs total (Oil 0, Gas 0) Week to Mar 14, 2025: 0 rigs total (Oil 0, Gas 0) Week to Mar 21, 2025: 0 rigs total (Oil 0, Gas 0) Week to Mar 28, 2025: 0 rigs total (Oil 0, Gas 0) Week to Apr 4, 2025: 0 rigs total (Oil 0, Gas 0) Week to Apr 11, 2025: 0 rigs total (Oil 0, Gas 0) Week to Apr 17, 2025: 0 rigs total (Oil 0, Gas 0) Week to Apr 25, 2025: 0 rigs total (Oil 0, Gas 0) Week to May 2, 2025: 0 rigs total (Oil 0, Gas 0) Week to May 9, 2025: 0 rigs total (Oil 0, Gas 0) Week to May 16, 2025: 0 rigs total (Oil 0, Gas 0) Week to May 23, 2025: 0 rigs total (Oil 0, Gas 0) Week to May 30, 2025: 0 rigs total (Oil 0, Gas 0) Week to Jun 6, 2025: 0 rigs total (Oil 0, Gas 0) Week to Jun 13, 2025: 0 rigs total (Oil 0, Gas 0) Week to Jun 20, 2025: 0 rigs total (Oil 0, Gas 0) Week to Jun 27, 2025: 0 rigs total (Oil 0, Gas 0) Week to Jul 3, 2025: 0 rigs total (Oil 0, Gas 0) Week to Jul 11, 2025: 0 rigs total (Oil 0, Gas 0) Week to Jul 18, 2025: 0 rigs total (Oil 0, Gas 0) Week to Jul 25, 2025: 0 rigs total (Oil 0, Gas 0) Week to Aug 1, 2025: 0 rigs total (Oil 0, Gas 0) Week to Aug 8, 2025: 0 rigs total (Oil 0, Gas 0) Week to Aug 15, 2025: 0 rigs total (Oil 0, Gas 0) Week to Aug 22, 2025: 0 rigs total (Oil 0, Gas 0) Week to Aug 29, 2025: 0 rigs total (Oil 0, Gas 0) Week to Sep 5, 2025: 0 rigs total (Oil 0, Gas 0) Week to Sep 12, 2025: 0 rigs total (Oil 0, Gas 0) Week to Sep 19, 2025: 0 rigs total (Oil 0, Gas 0) Week to Sep 26, 2025: 0 rigs total (Oil 0, Gas 0) Week to Oct 3, 2025: 0 rigs total (Oil 0, Gas 0) Week to Oct 10, 2025: 0 rigs total (Oil 0, Gas 0) Week to Oct 17, 2025: 0 rigs total (Oil 0, Gas 0) Week to Oct 24, 2025: 0 rigs total (Oil 0, Gas 0) Week to Oct 31, 2025: 1 rig total (Oil 1, Gas 0) Week to Nov 6, 2025: 1 rig total (Oil 1, Gas 0) Week to Nov 14, 2025: 1 rig total (Oil 1, Gas 0) Week to Nov 21, 2025: 1 rig total (Oil 1, Gas 0) Week to Nov 26, 2025: 1 rig total (Oil 1, Gas 0) Week to Dec 4, 2025: 1 rig total (Oil 1, Gas 0) Week to Dec 12, 2025: 1 rig total (Oil 1, Gas 0) Week to Dec 19, 2025: 0 rigs total (Oil 0, Gas 0) Week to Dec 24, 2025: 0 rigs total (Oil 0, Gas 0) Week to Dec 30, 2025: 0 rigs total (Oil 0, Gas 0) Week to Jan 9, 2026: 0 rigs total (Oil 0, Gas 0) Week to Jan 16, 2026: 0 rigs total (Oil 0, Gas 0) Week to Jan 23, 2026: 0 rigs total (Oil 0, Gas 0) Week to Jan 30, 2026: 0 rigs total (Oil 0, Gas 0) Week to Feb 6, 2026: 0 rigs total (Oil 0, Gas 0) Week to Feb 13, 2026: 0 rigs total (Oil 0, Gas 0) Week to Feb 20, 2026: 0 rigs total (Oil 0, Gas 0) Week to Feb 27, 2026: 0 rigs total (Oil 0, Gas 0) Week to Mar 6, 2026: 0 rigs total (Oil 0, Gas 0) Week to Mar 13, 2026: 0 rigs total (Oil 0, Gas 0) Week to Mar 20, 2026: 0 rigs total (Oil 0, Gas 0) Week to Mar 27, 2026: 0 rigs total (Oil 0, Gas 0) Week to Apr 2, 2026: 0 rigs total (Oil 0, Gas 0) Week to Apr 10, 2026: 0 rigs total (Oil 0, Gas 0) Week to Apr 17, 2026: 0 rigs total (Oil 0, Gas 0) Week to Apr 24, 2026: 0 rigs total (Oil 0, Gas 0) Week to May 1, 2026: 0 rigs total (Oil 0, Gas 0) Week to May 8, 2026: 0 rigs total (Oil 0, Gas 0) Week to May 15, 2026: 0 rigs total (Oil 0, Gas 0) Week to May 22, 2026: 0 rigs total (Oil 0, Gas 0) Week to May 29, 2026: 0 rigs total (Oil 0, Gas 0) Week to Jun 5, 2026: 0 rigs total (Oil 0, Gas 0) Week to Jun 12, 2026: 0 rigs total (Oil 0, Gas 0) Week to Jun 18, 2026: 0 rigs total (Oil 0, Gas 0) Week to Jun 26, 2026: 0 rigs total (Oil 0, Gas 0) Week to Jul 2, 2026: 0 rigs total (Oil 0, Gas 0) Week to Jul 10, 2026: 0 rigs total (Oil 0, Gas 0) Week to Jul 17, 2026: 0 rigs total (Oil 0, Gas 0) Week to Jul 24, 2026: 0 rigs total (Oil 0, Gas 0) Week to Jul 31, 2026: 0 rigs total (Oil 0, Gas 0) Week to Aug 7, 2026: 0 rigs total (Oil 0, Gas 0) Week to Aug 14, 2026: 0 rigs total (Oil 0, Gas 0) Week to Aug 21, 2026: 0 rigs total (Oil 0, Gas 0) Week to Aug 28, 2026: 0 rigs total (Oil 0, Gas 0) Week to Sep 4, 2026: 0 rigs total (Oil 0, Gas 0) Week to Sep 11, 2026: 0 rigs total (Oil 0, Gas 0)

Interactive chart. Focus it and use the left and right arrow keys to read each week, Page Up and Page Down to move a year, Home and End for the ends of the series. The full figures are also in the table below.

  • In Tarrant County, Texas, 0 drilling rigs were active in the week to September 11, 2026 (unchanged from a year earlier).
  • Since Sep 2016, the weekly count peaked at 2 in Jan 2022.
  • The count covers land and inland-water rigs; rigs in US federal offshore waters are counted on the Gulf of Mexico page.
Average active rigs per month: full table
Month Oil-directedGas-directedAll rigs
Sep 2026 (through September 11, 2026)000
Aug 2026000
Jul 2026000
Jun 2026000
May 2026000
Apr 2026000
Mar 2026000
Feb 2026000
Jan 2026000
Dec 20250.400.4
Nov 2025101
Oct 20250.200.2
Sep 2025000
Aug 2025000
Jul 2025000
Jun 2025000
May 2025000
Apr 2025000
Mar 2025000
Feb 2025000
Jan 2025000
Dec 2024000
Nov 2024000
Oct 2024000

Source: CommoVision (commovision.com)

What we cover here

Each row names the grain a region’s production is held at. Where a source publishes at a coarser grain, the page says so.

DataGrainSinceBenchmark
Texas production well 1993-01 ~99–100% of EIA

Benchmark cells compare our series with the EIA’s published estimates.

About the EIA comparison

The two are produced differently: the EIA estimates from a survey of the largest operators and a model built to anticipate late filings, while the series compared here are rebuilt from the source’s own records as they arrive. Recent months can differ without either being wrong; the methodology page explains both methods.

Coverage rows for Tarrant County, Texas are regenerated at every build from the same catalog of sources the data is built from.

What the data shows

  • Tarrant County, Texas produced 2 Mbbl (thousand barrels) of oil and 277.7 Bcf of natural gas in 2025.
  • Tarrant County, Texas gas production peaked in 2012 at 821.8 Bcf; 2025 output of 277.7 Bcf ran at 34% of that peak.
  • 3,556 producing wells tracked, 12 months to Jun 2026.

Get early access

Watch supply move as soon as its sources publish, with forecasts on 1.1+ million producing wells. The portal, an API and MCP access for AI tools open on October 1, 2026.

Data use is subject to our Terms of Service.