CommoVision

See the future in real time

Hilcorp Alaska Part of Hilcorp Energy

Hilcorp Alaska produced 31.1 MMbbl of oil and 438.1 Bcf of natural gas in 2025. 1,608 operated producing wells tracked, trailing 12 months per region.

  • Third-largest operator by operated oil in Alaska, 2025.
  • Operated 20.2% of the oil produced in Alaska, 2025.
  • Oil production rose 25% in 2025 as wells changed hands.
Operator

Its production also counts in Hilcorp Energy's figures.

Its production also counts in Hilcorp Energy's figures. Under Current operator an old month can show a later company.
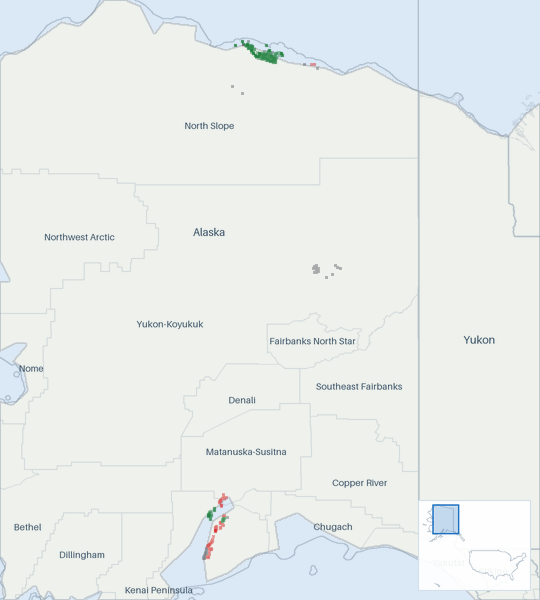
Well map of Hilcorp Alaska. The full map is further down this page.

Production

Hilcorp Alaska oil production (Mbbl/d, grouped by when each well first produced)
As reported. Reported data only.
Hilcorp Alaska oil production: thousand barrels per day, by first-production vintage as filed so far today 100200300400 Mbbl/d 2017201820192020202120222023202420252026 Sep 2016: 46.8 Mbbl/d total Oct 2016: 46.1 Mbbl/d total Nov 2016: 47.4 Mbbl/d total Dec 2016: 47.9 Mbbl/d total Jan 2017: 46 Mbbl/d total Feb 2017: 46.7 Mbbl/d total Mar 2017: 47 Mbbl/d total Apr 2017: 45.2 Mbbl/d total May 2017: 43.2 Mbbl/d total Jun 2017: 43.8 Mbbl/d total Jul 2017: 45.3 Mbbl/d total Aug 2017: 44.1 Mbbl/d total Sep 2017: 43.4 Mbbl/d total Oct 2017: 47 Mbbl/d total Nov 2017: 47.1 Mbbl/d total Dec 2017: 48.8 Mbbl/d total Jan 2018: 49.1 Mbbl/d total Feb 2018: 48.1 Mbbl/d total Mar 2018: 48 Mbbl/d total Apr 2018: 48.4 Mbbl/d total May 2018: 47.9 Mbbl/d total Jun 2018: 44.7 Mbbl/d total Jul 2018: 43.9 Mbbl/d total Aug 2018: 48.8 Mbbl/d total Sep 2018: 48.6 Mbbl/d total Oct 2018: 47.9 Mbbl/d total Nov 2018: 49.9 Mbbl/d total Dec 2018: 48.6 Mbbl/d total Jan 2019: 49.9 Mbbl/d total Feb 2019: 49.6 Mbbl/d total Mar 2019: 49.5 Mbbl/d total Apr 2019: 52.3 Mbbl/d total May 2019: 51 Mbbl/d total Jun 2019: 52.8 Mbbl/d total Jul 2019: 52.8 Mbbl/d total Aug 2019: 34.5 Mbbl/d total Sep 2019: 53.3 Mbbl/d total Oct 2019: 54 Mbbl/d total Nov 2019: 53.6 Mbbl/d total Dec 2019: 55 Mbbl/d total Jan 2020: 56.2 Mbbl/d total Feb 2020: 56.5 Mbbl/d total Mar 2020: 54.7 Mbbl/d total Apr 2020: 56 Mbbl/d total May 2020: 54.5 Mbbl/d total Jun 2020: 56.6 Mbbl/d total Jul 2020: 55.4 Mbbl/d total Aug 2020: 55 Mbbl/d total Sep 2020: 55 Mbbl/d total Oct 2020: 56.7 Mbbl/d total Nov 2020: 58.2 Mbbl/d total Dec 2020: 58.1 Mbbl/d total Jan 2021: 56.3 Mbbl/d total Feb 2021: 55.7 Mbbl/d total Mar 2021: 54.6 Mbbl/d total Apr 2021: 54.8 Mbbl/d total May 2021: 55.1 Mbbl/d total Jun 2021: 55.8 Mbbl/d total Jul 2021: 52.1 Mbbl/d total Aug 2021: 53.5 Mbbl/d total Sep 2021: 55.3 Mbbl/d total Oct 2021: 53.1 Mbbl/d total Nov 2021: 62.3 Mbbl/d total Dec 2021: 64.9 Mbbl/d total Jan 2022: 63.9 Mbbl/d total Feb 2022: 63.7 Mbbl/d total Mar 2022: 63.4 Mbbl/d total Apr 2022: 63.7 Mbbl/d total May 2022: 64.6 Mbbl/d total Jun 2022: 63.9 Mbbl/d total Jul 2022: 62.9 Mbbl/d total Aug 2022: 63.6 Mbbl/d total Sep 2022: 63.3 Mbbl/d total Oct 2022: 61.4 Mbbl/d total Nov 2022: 65.7 Mbbl/d total Dec 2022: 65.2 Mbbl/d total Jan 2023: 63.9 Mbbl/d total Feb 2023: 65.1 Mbbl/d total Mar 2023: 61.7 Mbbl/d total Apr 2023: 62.5 Mbbl/d total May 2023: 59 Mbbl/d total Jun 2023: 59.7 Mbbl/d total Jul 2023: 61.2 Mbbl/d total Aug 2023: 60 Mbbl/d total Sep 2023: 60.7 Mbbl/d total Oct 2023: 60.4 Mbbl/d total Nov 2023: 63.2 Mbbl/d total Dec 2023: 62.2 Mbbl/d total Jan 2024: 58.8 Mbbl/d total Feb 2024: 58.2 Mbbl/d total Mar 2024: 58.4 Mbbl/d total Apr 2024: 58.7 Mbbl/d total May 2024: 60.7 Mbbl/d total Jun 2024: 62.7 Mbbl/d total Jul 2024: 63.1 Mbbl/d total Aug 2024: 72.5 Mbbl/d total Sep 2024: 64.7 Mbbl/d total Oct 2024: 84.3 Mbbl/d total Nov 2024: 86.4 Mbbl/d total Dec 2024: 87.6 Mbbl/d total Jan 2025: 86.7 Mbbl/d total Feb 2025: 86.3 Mbbl/d total Mar 2025: 87.8 Mbbl/d total Apr 2025: 87.9 Mbbl/d total May 2025: 88.8 Mbbl/d total Jun 2025: 84.2 Mbbl/d total Jul 2025: 78.1 Mbbl/d total Aug 2025: 80.4 Mbbl/d total Sep 2025: 81.9 Mbbl/d total Oct 2025: 86.8 Mbbl/d total Nov 2025: 87.3 Mbbl/d total Dec 2025: 86.6 Mbbl/d total Jan 2026: 290 Mbbl/d total Feb 2026: 281 Mbbl/d total Mar 2026: 287 Mbbl/d total Apr 2026: 291 Mbbl/d total May 2026: 284 Mbbl/d total Jun 2026: 276 Mbbl/d total Jul 2026: 278 Mbbl/d total Aug 2026: 267 Mbbl/d total Sep 2026: 286 Mbbl/d as filed so far. Filings for this month are still arriving. The chart shows what has been filed.

Still arriving: Oct 2026 <1% filed.

All from what the source published. All held at well grain.

How the volume breaks down
  • 100% Reported by the official source by well

Every barrel here starts from what the official source published for the months measured. Measured over January 2011 to August 2026.

Hilcorp Alaska oil production (Mbbl/d, grouped by when each well first produced)
As reported. Reported data only.
Hilcorp Alaska oil production: thousand barrels per day, by first-production vintage as filed so far today 100200300400 Mbbl/d 2017201820192020202120222023202420252026 Sep 2016: 273 Mbbl/d total Oct 2016: 315 Mbbl/d total Nov 2016: 331 Mbbl/d total Dec 2016: 336 Mbbl/d total Jan 2017: 331 Mbbl/d total Feb 2017: 330 Mbbl/d total Mar 2017: 331 Mbbl/d total Apr 2017: 331 Mbbl/d total May 2017: 323 Mbbl/d total Jun 2017: 290 Mbbl/d total Jul 2017: 251 Mbbl/d total Aug 2017: 265 Mbbl/d total Sep 2017: 298 Mbbl/d total Oct 2017: 319 Mbbl/d total Nov 2017: 322 Mbbl/d total Dec 2017: 317 Mbbl/d total Jan 2018: 312 Mbbl/d total Feb 2018: 318 Mbbl/d total Mar 2018: 317 Mbbl/d total Apr 2018: 309 Mbbl/d total May 2018: 307 Mbbl/d total Jun 2018: 268 Mbbl/d total Jul 2018: 258 Mbbl/d total Aug 2018: 266 Mbbl/d total Sep 2018: 286 Mbbl/d total Oct 2018: 295 Mbbl/d total Nov 2018: 305 Mbbl/d total Dec 2018: 304 Mbbl/d total Jan 2019: 313 Mbbl/d total Feb 2019: 302 Mbbl/d total Mar 2019: 298 Mbbl/d total Apr 2019: 298 Mbbl/d total May 2019: 297 Mbbl/d total Jun 2019: 279 Mbbl/d total Jul 2019: 273 Mbbl/d total Aug 2019: 215 Mbbl/d total Sep 2019: 268 Mbbl/d total Oct 2019: 291 Mbbl/d total Nov 2019: 301 Mbbl/d total Dec 2019: 306 Mbbl/d total Jan 2020: 308 Mbbl/d total Feb 2020: 308 Mbbl/d total Mar 2020: 301 Mbbl/d total Apr 2020: 300 Mbbl/d total May 2020: 291 Mbbl/d total Jun 2020: 297 Mbbl/d total Jul 2020: 293 Mbbl/d total Aug 2020: 285 Mbbl/d total Sep 2020: 295 Mbbl/d total Oct 2020: 302 Mbbl/d total Nov 2020: 307 Mbbl/d total Dec 2020: 311 Mbbl/d total Jan 2021: 307 Mbbl/d total Feb 2021: 304 Mbbl/d total Mar 2021: 300 Mbbl/d total Apr 2021: 299 Mbbl/d total May 2021: 295 Mbbl/d total Jun 2021: 295 Mbbl/d total Jul 2021: 273 Mbbl/d total Aug 2021: 275 Mbbl/d total Sep 2021: 288 Mbbl/d total Oct 2021: 296 Mbbl/d total Nov 2021: 305 Mbbl/d total Dec 2021: 306 Mbbl/d total Jan 2022: 299 Mbbl/d total Feb 2022: 302 Mbbl/d total Mar 2022: 300 Mbbl/d total Apr 2022: 301 Mbbl/d total May 2022: 300 Mbbl/d total Jun 2022: 278 Mbbl/d total Jul 2022: 291 Mbbl/d total Aug 2022: 292 Mbbl/d total Sep 2022: 289 Mbbl/d total Oct 2022: 290 Mbbl/d total Nov 2022: 304 Mbbl/d total Dec 2022: 307 Mbbl/d total Jan 2023: 306 Mbbl/d total Feb 2023: 306 Mbbl/d total Mar 2023: 302 Mbbl/d total Apr 2023: 298 Mbbl/d total May 2023: 289 Mbbl/d total Jun 2023: 283 Mbbl/d total Jul 2023: 271 Mbbl/d total Aug 2023: 263 Mbbl/d total Sep 2023: 275 Mbbl/d total Oct 2023: 287 Mbbl/d total Nov 2023: 296 Mbbl/d total Dec 2023: 299 Mbbl/d total Jan 2024: 294 Mbbl/d total Feb 2024: 292 Mbbl/d total Mar 2024: 295 Mbbl/d total Apr 2024: 291 Mbbl/d total May 2024: 288 Mbbl/d total Jun 2024: 276 Mbbl/d total Jul 2024: 281 Mbbl/d total Aug 2024: 272 Mbbl/d total Sep 2024: 283 Mbbl/d total Oct 2024: 286 Mbbl/d total Nov 2024: 295 Mbbl/d total Dec 2024: 295 Mbbl/d total Jan 2025: 295 Mbbl/d total Feb 2025: 294 Mbbl/d total Mar 2025: 293 Mbbl/d total Apr 2025: 288 Mbbl/d total May 2025: 288 Mbbl/d total Jun 2025: 281 Mbbl/d total Jul 2025: 215 Mbbl/d total Aug 2025: 265 Mbbl/d total Sep 2025: 282 Mbbl/d total Oct 2025: 287 Mbbl/d total Nov 2025: 295 Mbbl/d total Dec 2025: 295 Mbbl/d total Jan 2026: 290 Mbbl/d total Feb 2026: 281 Mbbl/d total Mar 2026: 287 Mbbl/d total Apr 2026: 291 Mbbl/d total May 2026: 284 Mbbl/d total Jun 2026: 276 Mbbl/d total Jul 2026: 278 Mbbl/d total Aug 2026: 267 Mbbl/d total Sep 2026: 286 Mbbl/d as filed so far. Filings for this month are still arriving. The chart shows what has been filed.

Still arriving: Oct 2026 <1% filed.

Hilcorp Alaska natural gas production (Bcf/d, grouped by when each well first produced)
As reported. Reported data only.
Hilcorp Alaska natural gas production: billion cubic feet per day, by first-production vintage as filed so far today 51015 Bcf/d 2017201820192020202120222023202420252026 Sep 2016: 1.05 Bcf/d total Oct 2016: 1.03 Bcf/d total Nov 2016: 1.1 Bcf/d total Dec 2016: 1.16 Bcf/d total Jan 2017: 1.16 Bcf/d total Feb 2017: 1.2 Bcf/d total Mar 2017: 1.21 Bcf/d total Apr 2017: 1.16 Bcf/d total May 2017: 1.14 Bcf/d total Jun 2017: 1.01 Bcf/d total Jul 2017: 0.99 Bcf/d total Aug 2017: 0.98 Bcf/d total Sep 2017: 1.02 Bcf/d total Oct 2017: 1.11 Bcf/d total Nov 2017: 1.16 Bcf/d total Dec 2017: 1.15 Bcf/d total Jan 2018: 1.17 Bcf/d total Feb 2018: 1.07 Bcf/d total Mar 2018: 1.03 Bcf/d total Apr 2018: 1.08 Bcf/d total May 2018: 1.03 Bcf/d total Jun 2018: 0.91 Bcf/d total Jul 2018: 1.04 Bcf/d total Aug 2018: 1.06 Bcf/d total Sep 2018: 1.05 Bcf/d total Oct 2018: 1.04 Bcf/d total Nov 2018: 1.15 Bcf/d total Dec 2018: 1.08 Bcf/d total Jan 2019: 1.14 Bcf/d total Feb 2019: 1.14 Bcf/d total Mar 2019: 1.11 Bcf/d total Apr 2019: 1.15 Bcf/d total May 2019: 1.06 Bcf/d total Jun 2019: 1 Bcf/d total Jul 2019: 1.04 Bcf/d total Aug 2019: 0.91 Bcf/d total Sep 2019: 0.94 Bcf/d total Oct 2019: 1.1 Bcf/d total Nov 2019: 1.14 Bcf/d total Dec 2019: 1.15 Bcf/d total Jan 2020: 1.15 Bcf/d total Feb 2020: 1.15 Bcf/d total Mar 2020: 1.15 Bcf/d total Apr 2020: 1.13 Bcf/d total May 2020: 1.06 Bcf/d total Jun 2020: 1.07 Bcf/d total Jul 2020: 1.08 Bcf/d total Aug 2020: 1.09 Bcf/d total Sep 2020: 1.1 Bcf/d total Oct 2020: 1.11 Bcf/d total Nov 2020: 1.18 Bcf/d total Dec 2020: 1.2 Bcf/d total Jan 2021: 1.16 Bcf/d total Feb 2021: 1.2 Bcf/d total Mar 2021: 1.2 Bcf/d total Apr 2021: 1.18 Bcf/d total May 2021: 1.1 Bcf/d total Jun 2021: 1.1 Bcf/d total Jul 2021: 0.93 Bcf/d total Aug 2021: 1 Bcf/d total Sep 2021: 1.08 Bcf/d total Oct 2021: 1.11 Bcf/d total Nov 2021: 1.32 Bcf/d total Dec 2021: 1.34 Bcf/d total Jan 2022: 1.35 Bcf/d total Feb 2022: 1.34 Bcf/d total Mar 2022: 1.35 Bcf/d total Apr 2022: 1.34 Bcf/d total May 2022: 1.28 Bcf/d total Jun 2022: 1.2 Bcf/d total Jul 2022: 1.11 Bcf/d total Aug 2022: 1.09 Bcf/d total Sep 2022: 1.24 Bcf/d total Oct 2022: 1.29 Bcf/d total Nov 2022: 1.33 Bcf/d total Dec 2022: 1.35 Bcf/d total Jan 2023: 1.35 Bcf/d total Feb 2023: 1.34 Bcf/d total Mar 2023: 1.24 Bcf/d total Apr 2023: 1.31 Bcf/d total May 2023: 1.21 Bcf/d total Jun 2023: 1.16 Bcf/d total Jul 2023: 1.12 Bcf/d total Aug 2023: 0.99 Bcf/d total Sep 2023: 1.15 Bcf/d total Oct 2023: 1.19 Bcf/d total Nov 2023: 1.25 Bcf/d total Dec 2023: 1.28 Bcf/d total Jan 2024: 1.26 Bcf/d total Feb 2024: 1.22 Bcf/d total Mar 2024: 1.2 Bcf/d total Apr 2024: 1.19 Bcf/d total May 2024: 1.15 Bcf/d total Jun 2024: 1.2 Bcf/d total Jul 2024: 1.17 Bcf/d total Aug 2024: 1.03 Bcf/d total Sep 2024: 1.11 Bcf/d total Oct 2024: 1.22 Bcf/d total Nov 2024: 1.26 Bcf/d total Dec 2024: 1.28 Bcf/d total Jan 2025: 1.24 Bcf/d total Feb 2025: 1.27 Bcf/d total Mar 2025: 1.25 Bcf/d total Apr 2025: 1.27 Bcf/d total May 2025: 1.2 Bcf/d total Jun 2025: 1.19 Bcf/d total Jul 2025: 1.17 Bcf/d total Aug 2025: 1.04 Bcf/d total Sep 2025: 1.01 Bcf/d total Oct 2025: 1.22 Bcf/d total Nov 2025: 1.25 Bcf/d total Dec 2025: 1.3 Bcf/d total Jan 2026: 10.2 Bcf/d total Feb 2026: 10.1 Bcf/d total Mar 2026: 10.3 Bcf/d total Apr 2026: 9.99 Bcf/d total May 2026: 9.24 Bcf/d total Jun 2026: 8.8 Bcf/d total Jul 2026: 8.69 Bcf/d total Aug 2026: 8.37 Bcf/d total Sep 2026: 8.64 Bcf/d as filed so far. Filings for this month are still arriving. The chart shows what has been filed.

Still arriving: Oct 2026 <1% filed.

All from what the source published. All held at well grain.

How the volume breaks down
  • 100% Reported by the official source by well

Every cubic foot here starts from what the official source published for the months measured. Measured over January 2011 to August 2026.

Hilcorp Alaska natural gas production (Bcf/d, grouped by when each well first produced)
As reported. Reported data only.
Hilcorp Alaska natural gas production: billion cubic feet per day, by first-production vintage as filed so far today 51015 Bcf/d 2017201820192020202120222023202420252026 Sep 2016: 7.53 Bcf/d total Oct 2016: 7.99 Bcf/d total Nov 2016: 8.92 Bcf/d total Dec 2016: 8.99 Bcf/d total Jan 2017: 8.76 Bcf/d total Feb 2017: 8.8 Bcf/d total Mar 2017: 8.93 Bcf/d total Apr 2017: 8.69 Bcf/d total May 2017: 8.6 Bcf/d total Jun 2017: 7.75 Bcf/d total Jul 2017: 6.18 Bcf/d total Aug 2017: 6.57 Bcf/d total Sep 2017: 7.82 Bcf/d total Oct 2017: 8.46 Bcf/d total Nov 2017: 8.76 Bcf/d total Dec 2017: 8.86 Bcf/d total Jan 2018: 8.87 Bcf/d total Feb 2018: 8.87 Bcf/d total Mar 2018: 8.8 Bcf/d total Apr 2018: 8.67 Bcf/d total May 2018: 8.38 Bcf/d total Jun 2018: 7.03 Bcf/d total Jul 2018: 7.02 Bcf/d total Aug 2018: 7.28 Bcf/d total Sep 2018: 7.92 Bcf/d total Oct 2018: 8.18 Bcf/d total Nov 2018: 9 Bcf/d total Dec 2018: 9.14 Bcf/d total Jan 2019: 9.4 Bcf/d total Feb 2019: 9 Bcf/d total Mar 2019: 8.67 Bcf/d total Apr 2019: 9.09 Bcf/d total May 2019: 8.71 Bcf/d total Jun 2019: 7.95 Bcf/d total Jul 2019: 7.14 Bcf/d total Aug 2019: 6.81 Bcf/d total Sep 2019: 7.58 Bcf/d total Oct 2019: 8.16 Bcf/d total Nov 2019: 9.02 Bcf/d total Dec 2019: 9.13 Bcf/d total Jan 2020: 9.47 Bcf/d total Feb 2020: 9.54 Bcf/d total Mar 2020: 9.04 Bcf/d total Apr 2020: 8.82 Bcf/d total May 2020: 8.72 Bcf/d total Jun 2020: 8.54 Bcf/d total Jul 2020: 8.37 Bcf/d total Aug 2020: 7.98 Bcf/d total Sep 2020: 8.68 Bcf/d total Oct 2020: 9.09 Bcf/d total Nov 2020: 9.3 Bcf/d total Dec 2020: 10 Bcf/d total Jan 2021: 9.8 Bcf/d total Feb 2021: 9.53 Bcf/d total Mar 2021: 9.54 Bcf/d total Apr 2021: 9.29 Bcf/d total May 2021: 9.04 Bcf/d total Jun 2021: 8.61 Bcf/d total Jul 2021: 7.73 Bcf/d total Aug 2021: 8.31 Bcf/d total Sep 2021: 8.87 Bcf/d total Oct 2021: 8.84 Bcf/d total Nov 2021: 9.67 Bcf/d total Dec 2021: 9.96 Bcf/d total Jan 2022: 9.88 Bcf/d total Feb 2022: 9.99 Bcf/d total Mar 2022: 9.71 Bcf/d total Apr 2022: 9.5 Bcf/d total May 2022: 9.16 Bcf/d total Jun 2022: 8.5 Bcf/d total Jul 2022: 8.71 Bcf/d total Aug 2022: 8.43 Bcf/d total Sep 2022: 8.96 Bcf/d total Oct 2022: 9.12 Bcf/d total Nov 2022: 9.84 Bcf/d total Dec 2022: 10.1 Bcf/d total Jan 2023: 9.94 Bcf/d total Feb 2023: 9.98 Bcf/d total Mar 2023: 9.67 Bcf/d total Apr 2023: 9.58 Bcf/d total May 2023: 9.13 Bcf/d total Jun 2023: 8.68 Bcf/d total Jul 2023: 7.96 Bcf/d total Aug 2023: 7.29 Bcf/d total Sep 2023: 8.31 Bcf/d total Oct 2023: 9.17 Bcf/d total Nov 2023: 9.51 Bcf/d total Dec 2023: 10.1 Bcf/d total Jan 2024: 9.96 Bcf/d total Feb 2024: 10 Bcf/d total Mar 2024: 9.84 Bcf/d total Apr 2024: 9.31 Bcf/d total May 2024: 9.18 Bcf/d total Jun 2024: 8.62 Bcf/d total Jul 2024: 8.51 Bcf/d total Aug 2024: 8.09 Bcf/d total Sep 2024: 8.5 Bcf/d total Oct 2024: 9.2 Bcf/d total Nov 2024: 9.75 Bcf/d total Dec 2024: 9.89 Bcf/d total Jan 2025: 9.89 Bcf/d total Feb 2025: 9.92 Bcf/d total Mar 2025: 9.96 Bcf/d total Apr 2025: 9.58 Bcf/d total May 2025: 9.48 Bcf/d total Jun 2025: 8.86 Bcf/d total Jul 2025: 7.54 Bcf/d total Aug 2025: 8.31 Bcf/d total Sep 2025: 8.67 Bcf/d total Oct 2025: 9.18 Bcf/d total Nov 2025: 9.72 Bcf/d total Dec 2025: 10.4 Bcf/d total Jan 2026: 10.2 Bcf/d total Feb 2026: 10.1 Bcf/d total Mar 2026: 10.3 Bcf/d total Apr 2026: 9.99 Bcf/d total May 2026: 9.24 Bcf/d total Jun 2026: 8.8 Bcf/d total Jul 2026: 8.69 Bcf/d total Aug 2026: 8.37 Bcf/d total Sep 2026: 8.64 Bcf/d as filed so far. Filings for this month are still arriving. The chart shows what has been filed.

Still arriving: Oct 2026 <1% filed.

The bands group wells by when they first produced.

About this chart

The stack shows what is holding today's rate up and how much of it is new drilling. The bands draw the filings already in.

These volumes are the production from the wells and facilities this company operates. Ownership works differently: other parties hold interests in these wells, and this company holds interests in wells that other companies operate. How we attribute production to a company

Annual table (full history)
YearOil (MMbbl)Gas produced (Bcf)
202531.1438
202424.9436
202322.5443
202223.3464
202120.5417
202020.5411
201918.5392
201817.5386
201716.7404
201616.7386
201516.9384
20146.7121
20133.949
20122.828
20110.34

Source: CommoVision (commovision.com)

Monthly table (last 24 months)
MonthOil (Mbbl)Gas produced (MMcf)
2026-098,578.8259,009
2026-088,265.5259,507
2026-078,606.5269,278
2026-068,266.1263,860
2026-058,801.7286,589
2026-048,718.3299,787
2026-038,901.3319,352
2026-027,870.3281,397
2026-018,984.5316,685
2025-122,685.440,392
2025-112,619.337,402
2025-102,689.337,905
2025-092,456.430,133
2025-082,493.632,235
2025-072,422.136,186
2025-062,527.135,803
2025-052,753.537,217
2025-042,636.137,986
2025-032,720.338,847
2025-022,417.335,627
2025-012,687.238,357
2024-122,716.439,491
2024-112,592.337,845
2024-102,614.737,902

Source: CommoVision (commovision.com)

Source: CommoVision · Hilcorp Alaska, data through August 2026.

Well map

A map of 3,412 well locations operated by Hilcorp Alaska for which CommoVision holds a published surface coordinate, each drawn where it is and colored by its primary product (green for oil, red for natural gas, gray where undetermined; a spot shared by more than one product shows the one with the most wells there), on a ground of land and water over faint state, province, county and census-division outlines and place names for orientation, with a small inset map locating this frame in the United States.
  • Oil 2,281
  • Natural gas 536
  • Undetermined 595
3,412 well locations operated by Hilcorp Alaska, colored by primary product.
About this map

Undetermined means not enough signal to settle it. Producing wells are the ones that reported oil or gas in the trailing 12 months per region.

266.6 Mbbl/d Aug 2026 oil production +231.5% vs Aug last year
8.37 Bcf/d Aug 2026 gas production +705% vs Aug last year
85.2 Mbbl/d 2025 oil production
1.2 Bcf/d 2025 gas production
1,608 wells Operated producing wells tracked trailing 12 months per region

Type curves

Hilcorp Alaska oil type curves (bbl/d per well, log scale, against months on production; cohorts 2010–2026)
Hilcorp Alaska oil type curves: average barrels per day per well on a log scale against months on production 2010-2014: 73 wells in curve; starts at 587 bbl/d per well, 1,694 Mbbl cumulative through month 142 (100% of its wells old enough at that month); the dashed curve runs through month 202, on our forecast where a well’s own record ends2015: 14 wells in curve; starts at 671 bbl/d per well, 1,349 Mbbl cumulative through month 131 (100% of its wells old enough at that month); the dashed curve runs through month 191, on our forecast where a well’s own record ends2016: 11 wells in curve; starts at 1,377 bbl/d per well, 1,653 Mbbl cumulative through month 119 (100% of its wells old enough at that month); the dashed curve runs through month 179, on our forecast where a well’s own record ends2017: 4 wells in curve; starts at 328 bbl/d per well, 495 Mbbl cumulative through month 106 (100% of its wells old enough at that month); the dashed curve runs through month 166, on our forecast where a well’s own record ends2018: 10 wells in curve; starts at 198 bbl/d per well, 1,018 Mbbl cumulative through month 95 (100% of its wells old enough at that month); the dashed curve runs through month 155, on our forecast where a well’s own record ends2019: 18 wells in curve; starts at 492 bbl/d per well, 1,218 Mbbl cumulative through month 82 (100% of its wells old enough at that month); the dashed curve runs through month 142, on our forecast where a well’s own record ends2020: 17 wells in curve; starts at 301 bbl/d per well, 858 Mbbl cumulative through month 70 (100% of its wells old enough at that month); the dashed curve runs through month 130, on our forecast where a well’s own record ends2021: 6 wells in curve; starts at 526 bbl/d per well, 1,183 Mbbl cumulative through month 60 (100% of its wells old enough at that month); the dashed curve runs through month 120, on our forecast where a well’s own record ends2022: 22 wells in curve; starts at 613 bbl/d per well, 805 Mbbl cumulative through month 46 (100% of its wells old enough at that month); the dashed curve runs through month 106, on our forecast where a well’s own record ends2023: 25 wells in curve; starts at 745 bbl/d per well, 527 Mbbl cumulative through month 34 (100% of its wells old enough at that month); the dashed curve runs through month 94, on our forecast where a well’s own record ends2024: 24 wells in curve; starts at 643 bbl/d per well, 330 Mbbl cumulative through month 22 (100% of its wells old enough at that month); the dashed curve runs through month 82, on our forecast where a well’s own record ends2025: 19 wells in curve; starts at 440 bbl/d per well, 183 Mbbl cumulative through month 10 (100% of its wells old enough at that month); the dashed curve runs through month 70, on our forecast where a well’s own record ends2026: 13 wells in curve; starts at 365 bbl/d per well, 29.7 Mbbl cumulative through month 2 (100% of its wells old enough at that month); the dashed curve runs through month 62, on our forecast where a well’s own record ends30501002005001,0002,000bbl/d24487296120144168192216Months on production

3 of the drawn cohorts’ wells are not in these curves yet: each is still producing and joins its curve once it carries a forecast.

Hilcorp Alaska natural gas type curves (Mcf/d per well, log scale, against months on production; cohorts 2010–2026)
Hilcorp Alaska natural gas type curves: average thousand cubic feet per day per well on a log scale against months on production 2010-2014: 73 wells in curve; starts at 526 Mcf/d per well, 1.8 Bcf cumulative through month 142 (100% of its wells old enough at that month); the dashed curve runs through month 202, on our forecast where a well’s own record ends2015: 14 wells in curve; starts at 2,402 Mcf/d per well, 8.9 Bcf cumulative through month 131 (100% of its wells old enough at that month); the dashed curve runs through month 191, on our forecast where a well’s own record ends2016: 11 wells in curve; starts at 2,047 Mcf/d per well, 9.5 Bcf cumulative through month 119 (100% of its wells old enough at that month); the dashed curve runs through month 179, on our forecast where a well’s own record ends2017: 4 wells in curve; starts at 5.4 Mcf/d per well, 1.5 Bcf cumulative through month 106 (100% of its wells old enough at that month); the dashed curve runs through month 166, on our forecast where a well’s own record ends2018: 10 wells in curve; starts at 219 Mcf/d per well, 13.8 Bcf cumulative through month 95 (100% of its wells old enough at that month); the dashed curve runs through month 155, on our forecast where a well’s own record ends2019: 18 wells in curve; starts at 354 Mcf/d per well, 4.6 Bcf cumulative through month 82 (100% of its wells old enough at that month); the dashed curve runs through month 142, on our forecast where a well’s own record ends2020: 17 wells in curve; starts at 595 Mcf/d per well, 4.8 Bcf cumulative through month 70 (100% of its wells old enough at that month); the dashed curve runs through month 130, on our forecast where a well’s own record ends2021: 6 wells in curve; starts at 334 Mcf/d per well, 1.0 Bcf cumulative through month 60 (100% of its wells old enough at that month); the dashed curve runs through month 120, on our forecast where a well’s own record ends2022: 22 wells in curve; starts at 642 Mcf/d per well, 0.8 Bcf cumulative through month 46 (100% of its wells old enough at that month); the dashed curve runs through month 106, on our forecast where a well’s own record ends2023: 25 wells in curve; starts at 470 Mcf/d per well, 0.5 Bcf cumulative through month 34 (100% of its wells old enough at that month); the dashed curve runs through month 94, on our forecast where a well’s own record ends2024: 24 wells in curve; starts at 1,123 Mcf/d per well, 0.7 Bcf cumulative through month 22 (100% of its wells old enough at that month); the dashed curve runs through month 82, on our forecast where a well’s own record ends2025: 19 wells in curve; starts at 149 Mcf/d per well, 0.1 Bcf cumulative through month 10 (100% of its wells old enough at that month); the dashed curve runs through month 70, on our forecast where a well’s own record ends2026: 13 wells in curve; starts at 175 Mcf/d per well, 0.0 Bcf cumulative through month 2 (100% of its wells old enough at that month); the dashed curve runs through month 62, on our forecast where a well’s own record ends5101001,00010,000Mcf/d24487296120144168192216Months on production

3 of the drawn cohorts’ wells are not in these curves yet: each is still producing and joins its curve once it carries a forecast.

Horizontal wells only. Average production per well, for wells grouped by when they first produced.

How these curves are built

Horizontal wells only: 259 of the 438 wells in these cohorts. Average daily production per well, for wells grouped by when they first produced. Includes every well of the cohort that is old enough at each month, except wells that are still active but not yet covered by our forecasts; those are left out of both the reported and forecast parts until they are. Wells that are shut in or have stopped producing count as zero, so the average reflects the whole group drawn, not just survivors. Rates are calendar-day (volume ÷ days in month). The cumulative axis accumulates those same monthly averages at the average month length. Months not yet fully reported are excluded. The 2010-2014 curve draws those years as one group. The chart opens on average daily rate against months on production, the rate on a log scale. The view control switches to rate against cumulative production per well, on the same log rate scale, or to cumulative production per well against months on production, on a linear scale. Every view draws the same cohorts from the same production history. Each cohort is solid through the last month all the wells in its curve sit inside fully reported data. Past it the dashed curve carries the same wells forward, on our forecast where a well’s own record ends, for up to five years. A dashed curve runs as far as at least nine in ten of its wells are accounted for. A well that is old enough but shut in still counts, as zero. The measured months are what these wells reported. In the forward months each well counts its own reported figure for each month it has one, our forecast for each month it has only that, and zero for the rest. The forward average counts every well in the curve. The drawn forecast runs up to five years past the measured months. Line thickness tracks how many wells each curve is drawn from.

Cohort summary table
First produced Wells in curve Peak oil (bbl/d per well) Month-12 oil (bbl/d per well) Cum oil in series (Mbbl per well) Peak gas (Mcf/d per well) Month-12 gas (Mcf/d per well) Cum gas in series (Bcf per well) Months in series Wells old enough at last month in series Forecast months drawn
2026 13 611 — 29.7 486 — 0.0 2 100% 60
2025 19 1,009 — 183 482 — 0.1 10 100% 60
2024 24 834 476 330 1,590 1,556 0.7 22 100% 60
2023 25 1,107 521 527 952 560 0.5 34 100% 60
2022 22 924 588 805 1,335 413 0.8 46 100% 60
2021 6 1,216 735 1,183 1,405 797 1.0 60 100% 60
2020 17 672 480 858 3,131 2,192 4.8 70 100% 60
2019 18 769 672 1,218 3,070 2,051 4.6 82 100% 60
2018 10 560 383 1,018 9,241 4,914 13.8 95 100% 60
2017 4 755 154 495 2,057 786 1.5 106 100% 60
2016 11 1,599 782 1,653 5,646 4,310 9.5 119 100% 60
2015 14 1,306 374 1,349 3,987 2,551 8.9 131 100% 60
2010-2014 73 910 509 1,694 869 720 1.8 142 100% 60

Source: CommoVision (commovision.com)

Source: CommoVision · Hilcorp Alaska type curves, per-well production by first-production cohort.

Recent permitting

111 permits approved in the 365 days to November 9, 2026
28 permits in the 90 days to November 9, 2026
28 new-well permits in the 90 days to November 9, 2026
November 9, 2026 latest approval on record
About this chart

Approvals of every permit type per month, the 24 months to Nov 2026. The last bar is Nov 2026 through November 9, 2026 (4 so far), drawn hatched. All 111 approved in the 365 days to November 9, 2026 are permits to drill a new well. Permits to drill a new well: 111 in the 365 days to November 9, 2026 and 28 in the last 90 days of that window. How permits are counted.

  • Hilcorp Alaska was granted 111 well permits in the 365 days to November 9, 2026. Of those, 28 came in the last 90 days of that window. The latest approval on record is dated November 9, 2026.
  • All 111 approved in the 365 days to November 9, 2026 are permits to drill a new well. Permits to drill a new well: 111 in the 365 days to November 9, 2026 and 28 in the last 90 days of that window.
Well permits approved per month: full table
MonthPermits approved
Nov 2026 (through November 9, 2026)4
Oct 20267
Sep 202611
Aug 202612
Jul 20267
Jun 202614
May 20267
Apr 202610
Mar 20266
Feb 202610
Jan 202611
Dec 202510
Nov 20254
Oct 20259
Sep 202511
Aug 202510
Jul 20259
Jun 20258
May 20255
Apr 202510
Mar 20258
Feb 20256
Jan 20257
Dec 20249

Source: CommoVision (commovision.com)

What we cover here

Each row names the grain a region’s production is held at. Where a source publishes at a coarser grain, the page says so.

DataGrainSinceBenchmark
Alaska production well 1919-12 ~100–101% of EIA

Benchmark cells compare our series with the EIA’s published estimates.

About the EIA comparison

The two are produced differently: the EIA estimates from a survey of the largest operators and a model built to anticipate late filings, while the series compared here are rebuilt from official records as they arrive. Recent months can differ without either being wrong; the methodology page explains both methods.

Coverage rows for Hilcorp Alaska are regenerated at every build from the same catalog of sources the data is built from.

Top regions by 2025 operated production

RegionOil (MMbbl)Gas produced (Bcf)Share of 2025 output
Alaska31.1438.1100.0%

Share of output counts oil and gas together, gas at its market-value weight.

What the data shows

  • Hilcorp Alaska produced 31.1 MMbbl of oil and 438.1 Bcf of natural gas in 2025.
  • Hilcorp Alaska oil production reached its highest level on record in 2025 at 31.1 MMbbl.
  • Hilcorp Alaska operated production in Alaska in our coverage.
  • 1,608 operated producing wells tracked, trailing 12 months per region.

Corporate history

Start a free trial

Watch supply move as soon as its sources publish, with forecasts on 1.1+ million producing wells. A real API and MCP access for AI tools are live, and the Portal is open.

What the trial includes

Data use is subject to our Terms of Service.