CommoVision

See the future in real time

Pacific Canbriam Energy Part of Pacific Energy Corporation Limited since June 2019

Pacific Canbriam Energy produced 8 Mbbl (thousand barrels) of oil and 161.1 Bcf of natural gas in 2025. 261 operated producing wells tracked, trailing 12 months per region.

  • Seventh-largest operator by operated natural gas in British Columbia, 2025.
  • Operated 5.4% of the natural gas produced in British Columbia, 2025.
  • Natural gas production rose 14% in 2025 from 2024.
Operator

Its production also counts in Pacific Energy Corporation Limited's figures.

Its production also counts in Pacific Energy Corporation Limited's figures. Under Current operator an old month can show a later company.
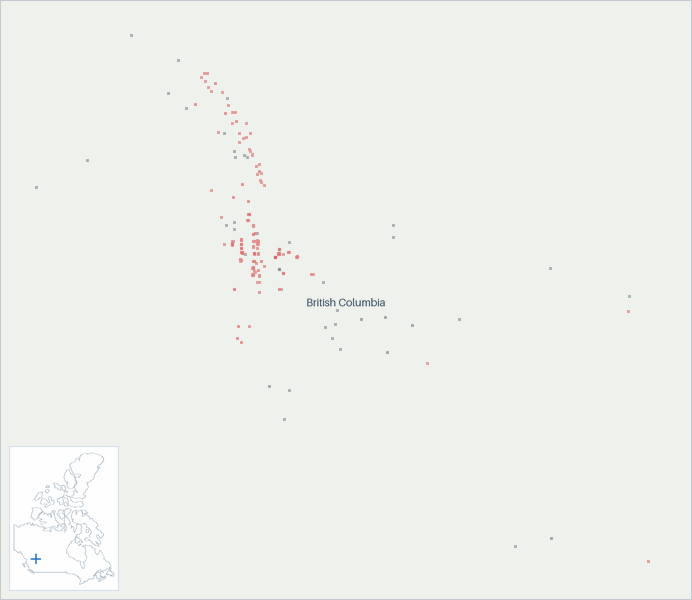
Well map of Pacific Canbriam Energy. The full map is further down this page.

Production

Pacific Canbriam Energy natural gas production (MMcf/d, grouped by when each well first produced)
As reported. Reported data only.
Pacific Canbriam Energy natural gas production: million cubic feet per day, by first-production vintage today 200400600 MMcf/d 2017201820192020202120222023202420252026 Oct 2016: 160 MMcf/d total Nov 2016: 158 MMcf/d total Dec 2016: 155 MMcf/d total Jan 2017: 160 MMcf/d total Feb 2017: 154 MMcf/d total Mar 2017: 161 MMcf/d total Apr 2017: 118 MMcf/d total May 2017: 58.3 MMcf/d total Jun 2017: 145 MMcf/d total Jul 2017: 164 MMcf/d total Aug 2017: 167 MMcf/d total Sep 2017: 153 MMcf/d total Oct 2017: 156 MMcf/d total Nov 2017: 157 MMcf/d total Dec 2017: 193 MMcf/d total Jan 2018: 211 MMcf/d total Feb 2018: 205 MMcf/d total Mar 2018: 209 MMcf/d total Apr 2018: 213 MMcf/d total May 2018: 220 MMcf/d total Jun 2018: 213 MMcf/d total Jul 2018: 167 MMcf/d total Aug 2018: 172 MMcf/d total Sep 2018: 200 MMcf/d total Oct 2018: 155 MMcf/d total Nov 2018: 147 MMcf/d total Dec 2018: 162 MMcf/d total Jan 2019: 205 MMcf/d total Feb 2019: 194 MMcf/d total Mar 2019: 196 MMcf/d total Apr 2019: 198 MMcf/d total May 2019: 205 MMcf/d total Jun 2019: 198 MMcf/d total Jul 2019: 141 MMcf/d total Aug 2019: 147 MMcf/d total Sep 2019: 204 MMcf/d total Oct 2019: 212 MMcf/d total Nov 2019: 216 MMcf/d total Dec 2019: 208 MMcf/d total Jan 2020: 221 MMcf/d total Feb 2020: 218 MMcf/d total Mar 2020: 218 MMcf/d total Apr 2020: 221 MMcf/d total May 2020: 221 MMcf/d total Jun 2020: 219 MMcf/d total Jul 2020: 189 MMcf/d total Aug 2020: 211 MMcf/d total Sep 2020: 218 MMcf/d total Oct 2020: 214 MMcf/d total Nov 2020: 218 MMcf/d total Dec 2020: 217 MMcf/d total Jan 2021: 208 MMcf/d total Feb 2021: 211 MMcf/d total Mar 2021: 204 MMcf/d total Apr 2021: 223 MMcf/d total May 2021: 233 MMcf/d total Jun 2021: 225 MMcf/d total Jul 2021: 136 MMcf/d total Aug 2021: 195 MMcf/d total Sep 2021: 226 MMcf/d total Oct 2021: 158 MMcf/d total Nov 2021: 242 MMcf/d total Dec 2021: 241 MMcf/d total Jan 2022: 234 MMcf/d total Feb 2022: 244 MMcf/d total Mar 2022: 261 MMcf/d total Apr 2022: 309 MMcf/d total May 2022: 306 MMcf/d total Jun 2022: 306 MMcf/d total Jul 2022: 310 MMcf/d total Aug 2022: 319 MMcf/d total Sep 2022: 340 MMcf/d total Oct 2022: 336 MMcf/d total Nov 2022: 327 MMcf/d total Dec 2022: 340 MMcf/d total Jan 2023: 291 MMcf/d total Feb 2023: 135 MMcf/d total Mar 2023: 289 MMcf/d total Apr 2023: 351 MMcf/d total May 2023: 342 MMcf/d total Jun 2023: 344 MMcf/d total Jul 2023: 341 MMcf/d total Aug 2023: 349 MMcf/d total Sep 2023: 339 MMcf/d total Oct 2023: 344 MMcf/d total Nov 2023: 362 MMcf/d total Dec 2023: 370 MMcf/d total Jan 2024: 370 MMcf/d total Feb 2024: 373 MMcf/d total Mar 2024: 376 MMcf/d total Apr 2024: 370 MMcf/d total May 2024: 368 MMcf/d total Jun 2024: 362 MMcf/d total Jul 2024: 335 MMcf/d total Aug 2024: 366 MMcf/d total Sep 2024: 349 MMcf/d total Oct 2024: 449 MMcf/d total Nov 2024: 444 MMcf/d total Dec 2024: 474 MMcf/d total Jan 2025: 438 MMcf/d total Feb 2025: 420 MMcf/d total Mar 2025: 470 MMcf/d total Apr 2025: 471 MMcf/d total May 2025: 456 MMcf/d total Jun 2025: 441 MMcf/d total Jul 2025: 448 MMcf/d total Aug 2025: 435 MMcf/d total Sep 2025: 391 MMcf/d total Oct 2025: 441 MMcf/d total Nov 2025: 435 MMcf/d total Dec 2025: 448 MMcf/d total Jan 2026: 450 MMcf/d total Feb 2026: 443 MMcf/d total Mar 2026: 450 MMcf/d total Apr 2026: 452 MMcf/d total May 2026: 444 MMcf/d total Jun 2026: 432 MMcf/d total Jul 2026: 373 MMcf/d total Aug 2026: 433 MMcf/d total Sep 2026: 430 MMcf/d total

Still arriving: Oct 2026 <1% filed.

All from what the source published. All held at well grain.

How the volume breaks down
  • 100% Reported by the official source by well

Every cubic foot here starts from what the official source published for the months measured. Measured over January 1958 to September 2026.

Pacific Canbriam Energy natural gas production (MMcf/d, grouped by when each well first produced)
As reported. Reported data only.
Pacific Canbriam Energy natural gas production: million cubic feet per day, by first-production vintage today 200400600 MMcf/d 2017201820192020202120222023202420252026 Oct 2016: 172 MMcf/d total Nov 2016: 172 MMcf/d total Dec 2016: 170 MMcf/d total Jan 2017: 174 MMcf/d total Feb 2017: 168 MMcf/d total Mar 2017: 175 MMcf/d total Apr 2017: 132 MMcf/d total May 2017: 70.7 MMcf/d total Jun 2017: 148 MMcf/d total Jul 2017: 168 MMcf/d total Aug 2017: 178 MMcf/d total Sep 2017: 162 MMcf/d total Oct 2017: 164 MMcf/d total Nov 2017: 165 MMcf/d total Dec 2017: 203 MMcf/d total Jan 2018: 222 MMcf/d total Feb 2018: 216 MMcf/d total Mar 2018: 220 MMcf/d total Apr 2018: 226 MMcf/d total May 2018: 220 MMcf/d total Jun 2018: 215 MMcf/d total Jul 2018: 169 MMcf/d total Aug 2018: 174 MMcf/d total Sep 2018: 201 MMcf/d total Oct 2018: 156 MMcf/d total Nov 2018: 148 MMcf/d total Dec 2018: 162 MMcf/d total Jan 2019: 205 MMcf/d total Feb 2019: 194 MMcf/d total Mar 2019: 197 MMcf/d total Apr 2019: 198 MMcf/d total May 2019: 205 MMcf/d total Jun 2019: 199 MMcf/d total Jul 2019: 141 MMcf/d total Aug 2019: 147 MMcf/d total Sep 2019: 204 MMcf/d total Oct 2019: 212 MMcf/d total Nov 2019: 216 MMcf/d total Dec 2019: 208 MMcf/d total Jan 2020: 221 MMcf/d total Feb 2020: 218 MMcf/d total Mar 2020: 218 MMcf/d total Apr 2020: 221 MMcf/d total May 2020: 221 MMcf/d total Jun 2020: 219 MMcf/d total Jul 2020: 189 MMcf/d total Aug 2020: 211 MMcf/d total Sep 2020: 218 MMcf/d total Oct 2020: 214 MMcf/d total Nov 2020: 218 MMcf/d total Dec 2020: 217 MMcf/d total Jan 2021: 208 MMcf/d total Feb 2021: 211 MMcf/d total Mar 2021: 204 MMcf/d total Apr 2021: 223 MMcf/d total May 2021: 233 MMcf/d total Jun 2021: 225 MMcf/d total Jul 2021: 136 MMcf/d total Aug 2021: 195 MMcf/d total Sep 2021: 226 MMcf/d total Oct 2021: 158 MMcf/d total Nov 2021: 242 MMcf/d total Dec 2021: 241 MMcf/d total Jan 2022: 234 MMcf/d total Feb 2022: 244 MMcf/d total Mar 2022: 261 MMcf/d total Apr 2022: 309 MMcf/d total May 2022: 306 MMcf/d total Jun 2022: 306 MMcf/d total Jul 2022: 310 MMcf/d total Aug 2022: 319 MMcf/d total Sep 2022: 340 MMcf/d total Oct 2022: 336 MMcf/d total Nov 2022: 327 MMcf/d total Dec 2022: 340 MMcf/d total Jan 2023: 291 MMcf/d total Feb 2023: 135 MMcf/d total Mar 2023: 289 MMcf/d total Apr 2023: 351 MMcf/d total May 2023: 342 MMcf/d total Jun 2023: 344 MMcf/d total Jul 2023: 341 MMcf/d total Aug 2023: 349 MMcf/d total Sep 2023: 339 MMcf/d total Oct 2023: 344 MMcf/d total Nov 2023: 362 MMcf/d total Dec 2023: 370 MMcf/d total Jan 2024: 370 MMcf/d total Feb 2024: 373 MMcf/d total Mar 2024: 376 MMcf/d total Apr 2024: 370 MMcf/d total May 2024: 368 MMcf/d total Jun 2024: 362 MMcf/d total Jul 2024: 335 MMcf/d total Aug 2024: 366 MMcf/d total Sep 2024: 349 MMcf/d total Oct 2024: 449 MMcf/d total Nov 2024: 444 MMcf/d total Dec 2024: 474 MMcf/d total Jan 2025: 438 MMcf/d total Feb 2025: 420 MMcf/d total Mar 2025: 470 MMcf/d total Apr 2025: 471 MMcf/d total May 2025: 456 MMcf/d total Jun 2025: 441 MMcf/d total Jul 2025: 448 MMcf/d total Aug 2025: 435 MMcf/d total Sep 2025: 391 MMcf/d total Oct 2025: 441 MMcf/d total Nov 2025: 435 MMcf/d total Dec 2025: 448 MMcf/d total Jan 2026: 450 MMcf/d total Feb 2026: 443 MMcf/d total Mar 2026: 450 MMcf/d total Apr 2026: 452 MMcf/d total May 2026: 444 MMcf/d total Jun 2026: 432 MMcf/d total Jul 2026: 373 MMcf/d total Aug 2026: 433 MMcf/d total Sep 2026: 430 MMcf/d total

Still arriving: Oct 2026 <1% filed.

Pacific Canbriam Energy oil production (bbl/d, grouped by when each well first produced)
As reported. Reported data only.
Pacific Canbriam Energy oil production: barrels per day, by first-production vintage today 20406080 bbl/d 2017201820192020202120222023202420252026 Oct 2016: 0 bbl/d total Nov 2016: 0.17 bbl/d total Dec 2016: 0.29 bbl/d total Jan 2017: 0 bbl/d total Feb 2017: 0 bbl/d total Mar 2017: 0 bbl/d total Apr 2017: 0 bbl/d total May 2017: 0 bbl/d total Jun 2017: 0.17 bbl/d total Jul 2017: 0 bbl/d total Aug 2017: 0.1 bbl/d total Sep 2017: 0.23 bbl/d total Oct 2017: 0.23 bbl/d total Nov 2017: 0.37 bbl/d total Dec 2017: 0.16 bbl/d total Jan 2018: 0.19 bbl/d total Feb 2018: 0 bbl/d total Mar 2018: 0.58 bbl/d total Apr 2018: 0 bbl/d total May 2018: 0 bbl/d total Jun 2018: 0 bbl/d total Jul 2018: 0 bbl/d total Aug 2018: 0 bbl/d total Sep 2018: 0 bbl/d total Oct 2018: 0 bbl/d total Nov 2018: 0 bbl/d total Dec 2018: 0 bbl/d total Jan 2019: 0 bbl/d total Feb 2019: 0 bbl/d total Mar 2019: 0 bbl/d total Apr 2019: 12.3 bbl/d total May 2019: 0 bbl/d total Jun 2019: 0 bbl/d total Jul 2019: 8.03 bbl/d total Aug 2019: 9.58 bbl/d total Sep 2019: 11.2 bbl/d total Oct 2019: 7.13 bbl/d total Nov 2019: 8.5 bbl/d total Dec 2019: 5.13 bbl/d total Jan 2020: 6.58 bbl/d total Feb 2020: 2.59 bbl/d total Mar 2020: 3.9 bbl/d total Apr 2020: 0.53 bbl/d total May 2020: 0 bbl/d total Jun 2020: 4.77 bbl/d total Jul 2020: 7.42 bbl/d total Aug 2020: 8.03 bbl/d total Sep 2020: 8.63 bbl/d total Oct 2020: 6.71 bbl/d total Nov 2020: 15.3 bbl/d total Dec 2020: 8.39 bbl/d total Jan 2021: 6.94 bbl/d total Feb 2021: 10.7 bbl/d total Mar 2021: 9.9 bbl/d total Apr 2021: 17.6 bbl/d total May 2021: 36.6 bbl/d total Jun 2021: 46.2 bbl/d total Jul 2021: 36.7 bbl/d total Aug 2021: 28.4 bbl/d total Sep 2021: 22.3 bbl/d total Oct 2021: 2.45 bbl/d total Nov 2021: 22.6 bbl/d total Dec 2021: 21.7 bbl/d total Jan 2022: 22.9 bbl/d total Feb 2022: 32.3 bbl/d total Mar 2022: 70.6 bbl/d total Apr 2022: 74.8 bbl/d total May 2022: 65.6 bbl/d total Jun 2022: 49.2 bbl/d total Jul 2022: 46.9 bbl/d total Aug 2022: 13.5 bbl/d total Sep 2022: 25.8 bbl/d total Oct 2022: 13.8 bbl/d total Nov 2022: 62.3 bbl/d total Dec 2022: 51.1 bbl/d total Jan 2023: 23.8 bbl/d total Feb 2023: 9.79 bbl/d total Mar 2023: 75.7 bbl/d total Apr 2023: 62.8 bbl/d total May 2023: 48.1 bbl/d total Jun 2023: 49.6 bbl/d total Jul 2023: 43.7 bbl/d total Aug 2023: 34.3 bbl/d total Sep 2023: 42.6 bbl/d total Oct 2023: 28.4 bbl/d total Nov 2023: 4.27 bbl/d total Dec 2023: 0.03 bbl/d total Jan 2024: 0.32 bbl/d total Feb 2024: 0.69 bbl/d total Mar 2024: 0 bbl/d total Apr 2024: 2.9 bbl/d total May 2024: 0 bbl/d total Jun 2024: 0 bbl/d total Jul 2024: 1.26 bbl/d total Aug 2024: 46 bbl/d total Sep 2024: 42.6 bbl/d total Oct 2024: 21.5 bbl/d total Nov 2024: 42.6 bbl/d total Dec 2024: 31.3 bbl/d total Jan 2025: 23.8 bbl/d total Feb 2025: 55.8 bbl/d total Mar 2025: 46.4 bbl/d total Apr 2025: 36.9 bbl/d total May 2025: 32.3 bbl/d total Jun 2025: 28.1 bbl/d total Jul 2025: 17.5 bbl/d total Aug 2025: 13.8 bbl/d total Sep 2025: 12.4 bbl/d total Oct 2025: 13.4 bbl/d total Nov 2025: 0 bbl/d total Dec 2025: 0 bbl/d total Jan 2026: 0 bbl/d total Feb 2026: 0 bbl/d total Mar 2026: 0 bbl/d total Apr 2026: 0 bbl/d total May 2026: 0 bbl/d total Jun 2026: 0 bbl/d total Jul 2026: 0 bbl/d total Aug 2026: 0 bbl/d total Sep 2026: 3.03 bbl/d total

Still arriving: Oct 2026 <1% filed.

All from what the source published. All held at well grain.

How the volume breaks down
  • 100% Reported by the official source by well

Every barrel here starts from what the official source published for the months measured. Measured over January 1958 to September 2026.

Pacific Canbriam Energy oil production (bbl/d, grouped by when each well first produced)
As reported. Reported data only.
Pacific Canbriam Energy oil production: barrels per day, by first-production vintage today 20406080 bbl/d 2017201820192020202120222023202420252026 Oct 2016: 4.19 bbl/d total Nov 2016: 10.1 bbl/d total Dec 2016: 16.2 bbl/d total Jan 2017: 10.1 bbl/d total Feb 2017: 15.7 bbl/d total Mar 2017: 11.9 bbl/d total Apr 2017: 9.87 bbl/d total May 2017: 18.9 bbl/d total Jun 2017: 12.5 bbl/d total Jul 2017: 0 bbl/d total Aug 2017: 2.81 bbl/d total Sep 2017: 10.6 bbl/d total Oct 2017: 23.3 bbl/d total Nov 2017: 19 bbl/d total Dec 2017: 17.5 bbl/d total Jan 2018: 21.7 bbl/d total Feb 2018: 16.3 bbl/d total Mar 2018: 22.4 bbl/d total Apr 2018: 8.4 bbl/d total May 2018: 7.74 bbl/d total Jun 2018: 18.6 bbl/d total Jul 2018: 13 bbl/d total Aug 2018: 11.2 bbl/d total Sep 2018: 8.9 bbl/d total Oct 2018: 8 bbl/d total Nov 2018: 7.93 bbl/d total Dec 2018: 6.16 bbl/d total Jan 2019: 7.26 bbl/d total Feb 2019: 5.5 bbl/d total Mar 2019: 5.58 bbl/d total Apr 2019: 18.4 bbl/d total May 2019: 1.87 bbl/d total Jun 2019: 4.1 bbl/d total Jul 2019: 8.03 bbl/d total Aug 2019: 9.58 bbl/d total Sep 2019: 11.2 bbl/d total Oct 2019: 7.13 bbl/d total Nov 2019: 8.5 bbl/d total Dec 2019: 5.13 bbl/d total Jan 2020: 6.58 bbl/d total Feb 2020: 2.59 bbl/d total Mar 2020: 3.9 bbl/d total Apr 2020: 0.53 bbl/d total May 2020: 0 bbl/d total Jun 2020: 4.77 bbl/d total Jul 2020: 7.42 bbl/d total Aug 2020: 8.03 bbl/d total Sep 2020: 8.63 bbl/d total Oct 2020: 6.71 bbl/d total Nov 2020: 15.3 bbl/d total Dec 2020: 8.39 bbl/d total Jan 2021: 6.94 bbl/d total Feb 2021: 10.7 bbl/d total Mar 2021: 9.9 bbl/d total Apr 2021: 17.6 bbl/d total May 2021: 36.6 bbl/d total Jun 2021: 46.2 bbl/d total Jul 2021: 36.7 bbl/d total Aug 2021: 28.4 bbl/d total Sep 2021: 22.3 bbl/d total Oct 2021: 2.45 bbl/d total Nov 2021: 22.6 bbl/d total Dec 2021: 21.7 bbl/d total Jan 2022: 22.9 bbl/d total Feb 2022: 32.3 bbl/d total Mar 2022: 70.6 bbl/d total Apr 2022: 74.8 bbl/d total May 2022: 65.6 bbl/d total Jun 2022: 49.2 bbl/d total Jul 2022: 46.9 bbl/d total Aug 2022: 13.5 bbl/d total Sep 2022: 25.8 bbl/d total Oct 2022: 13.8 bbl/d total Nov 2022: 62.3 bbl/d total Dec 2022: 51.1 bbl/d total Jan 2023: 23.8 bbl/d total Feb 2023: 9.79 bbl/d total Mar 2023: 75.7 bbl/d total Apr 2023: 62.8 bbl/d total May 2023: 48.1 bbl/d total Jun 2023: 49.6 bbl/d total Jul 2023: 43.7 bbl/d total Aug 2023: 34.3 bbl/d total Sep 2023: 42.6 bbl/d total Oct 2023: 28.4 bbl/d total Nov 2023: 4.27 bbl/d total Dec 2023: 0.03 bbl/d total Jan 2024: 0.32 bbl/d total Feb 2024: 0.69 bbl/d total Mar 2024: 0 bbl/d total Apr 2024: 2.9 bbl/d total May 2024: 0 bbl/d total Jun 2024: 0 bbl/d total Jul 2024: 1.26 bbl/d total Aug 2024: 46 bbl/d total Sep 2024: 42.6 bbl/d total Oct 2024: 21.5 bbl/d total Nov 2024: 42.6 bbl/d total Dec 2024: 31.3 bbl/d total Jan 2025: 23.8 bbl/d total Feb 2025: 55.8 bbl/d total Mar 2025: 46.4 bbl/d total Apr 2025: 36.9 bbl/d total May 2025: 32.3 bbl/d total Jun 2025: 28.1 bbl/d total Jul 2025: 17.5 bbl/d total Aug 2025: 13.8 bbl/d total Sep 2025: 12.4 bbl/d total Oct 2025: 13.4 bbl/d total Nov 2025: 0 bbl/d total Dec 2025: 0 bbl/d total Jan 2026: 0 bbl/d total Feb 2026: 0 bbl/d total Mar 2026: 0 bbl/d total Apr 2026: 0 bbl/d total May 2026: 0 bbl/d total Jun 2026: 0 bbl/d total Jul 2026: 0 bbl/d total Aug 2026: 0 bbl/d total Sep 2026: 3.03 bbl/d total

Still arriving: Oct 2026 <1% filed.

The bands group wells by when they first produced.

About this chart

The stack shows what is holding today's rate up and how much of it is new drilling. The bands draw the filings already in.

These volumes are the production from the wells and facilities this company operates. Ownership works differently: other parties hold interests in these wells, and this company holds interests in wells that other companies operate. How we attribute production to a company

Annual table (full history)
YearOil (MMbbl)Gas produced (Bcf)
2025<0.1161
2024<0.1141
2023<0.1118
2022<0.1111
2021<0.176
2020<0.179
2019<0.171
2018<0.169
2017<0.154
2016<0.157
2015<0.143
2014<0.127
2013<0.124
2012<0.118
20110.113
2010<0.110
2009<0.111
2008<0.110
2007<0.18
2006<0.17
2005<0.18
2004<0.19
2003<0.16
2002<0.14
2001<0.14
2000<0.14
19990.04
1998<0.13
1997<0.13
1996<0.13
1995<0.13
1994<0.13
1993<0.13
1992<0.13
1991<0.14
1990<0.13
1989<0.15
19880.03
19870.02
19860.02
19850.03
19840.02
19830.02
19820.02
19810.02
19800.03
19790.04
19780.02
19770.03
19760.04
19750.04
19740.04
19730.05
19720.04
19710.05
19700.06
19690.06
19680.06
19670.07
1966<0.17
1965<0.16
1964<0.17
1963<0.16
19620.07
1961<0.16
1960<0.16
1959<0.17
1958<0.12

Source: CommoVision (commovision.com)

Monthly table (last 24 months)
MonthOil (Mbbl)Gas produced (MMcf)
2026-090.112,898
2026-080.013,431
2026-070.011,562
2026-060.012,956
2026-050.013,760
2026-040.013,557
2026-030.013,952
2026-020.012,407
2026-010.013,942
2025-120.013,899
2025-110.013,046
2025-100.413,678
2025-090.411,720
2025-080.413,479
2025-070.513,880
2025-060.813,241
2025-051.014,133
2025-041.114,128
2025-031.414,583
2025-021.611,767
2025-010.713,572
2024-121.014,691
2024-111.313,309
2024-100.713,921

Source: CommoVision (commovision.com)

Source: CommoVision · Pacific Canbriam Energy, data through September 2026.

Well map

A map of 441 well locations operated by Pacific Canbriam Energy for which CommoVision holds a published surface coordinate, each drawn where it is and colored by its primary product (green for oil, red for natural gas, gray where undetermined; a spot shared by more than one product shows the one with the most wells there), on a ground of land and water over faint place names for orientation, with a small inset map locating this frame in Canada.
  • Oil 1
  • Natural gas 363
  • Undetermined 77
441 well locations operated by Pacific Canbriam Energy, colored by primary product.
About this map

Undetermined means not enough signal to settle it. Producing wells are the ones that reported oil or gas in the trailing 12 months per region.

3 bbl/d Sep 2026 oil production -75.5% vs Sep last year
429.9 MMcf/d Sep 2026 gas production +10% vs Sep last year
23.1 bbl/d 2025 oil production
441.4 MMcf/d 2025 gas production
261 wells Operated producing wells tracked trailing 12 months per region

Type curves

Pacific Canbriam Energy natural gas type curves (Mcf/d per well, log scale, against months on production; cohorts 2010–2026)
Pacific Canbriam Energy natural gas type curves: average thousand cubic feet per day per well on a log scale against months on production 2010-2014: 37 wells in curve; starts at 1,880 Mcf/d per well, 3.7 Bcf cumulative through month 143 (100% of its wells old enough at that month); the dashed curve runs through month 203, on our forecast where a well’s own record ends2015: 26 wells in curve; starts at 1,763 Mcf/d per well, 6.3 Bcf cumulative through month 130 (100% of its wells old enough at that month); the dashed curve runs through month 190, on our forecast where a well’s own record ends2016: 15 wells in curve; starts at 2,329 Mcf/d per well, 5.2 Bcf cumulative through month 121 (100% of its wells old enough at that month); the dashed curve runs through month 181, on our forecast where a well’s own record ends2017: 25 wells in curve; starts at 1,643 Mcf/d per well, 5.2 Bcf cumulative through month 106 (100% of its wells old enough at that month); the dashed curve runs through month 166, on our forecast where a well’s own record ends2018: 9 wells in curve; starts at 2,438 Mcf/d per well, 4.8 Bcf cumulative through month 95 (100% of its wells old enough at that month); the dashed curve runs through month 155, on our forecast where a well’s own record ends2019: 11 wells in curve; starts at 1,762 Mcf/d per well, 5.2 Bcf cumulative through month 86 (100% of its wells old enough at that month); the dashed curve runs through month 146, on our forecast where a well’s own record ends2020: 7 wells in curve; starts at 4,022 Mcf/d per well, 5.5 Bcf cumulative through month 74 (100% of its wells old enough at that month); the dashed curve runs through month 134, on our forecast where a well’s own record ends2021: 17 wells in curve; starts at 2,111 Mcf/d per well, 6.9 Bcf cumulative through month 62 (100% of its wells old enough at that month); the dashed curve runs through month 122, on our forecast where a well’s own record ends2022: 28 wells in curve; starts at 1,121 Mcf/d per well, 4.7 Bcf cumulative through month 47 (100% of its wells old enough at that month); the dashed curve runs through month 107, on our forecast where a well’s own record ends2023: 17 wells in curve; starts at 769 Mcf/d per well, 3.8 Bcf cumulative through month 36 (100% of its wells old enough at that month); the dashed curve runs through month 96, on our forecast where a well’s own record ends2024: 43 wells in curve; starts at 1,343 Mcf/d per well, 1.9 Bcf cumulative through month 22 (100% of its wells old enough at that month); the dashed curve runs through month 82, on our forecast where a well’s own record ends2025: 26 wells in curve; starts at 4,295 Mcf/d per well, 1.7 Bcf cumulative through month 13 (100% of its wells old enough at that month); the dashed curve runs through month 73, on our forecast where a well’s own record ends2026: 17 wells in curve; starts at 3,266 Mcf/d per well, 0.2 Bcf cumulative through month 2 (100% of its wells old enough at that month); the dashed curve runs through month 62, on our forecast where a well’s own record ends1502005001,0002,0005,0007,000Mcf/d24487296120144168192216Months on production
Pacific Canbriam Energy oil type curves (bbl/d per well, log scale, against months on production; cohorts 2010–2023)
Pacific Canbriam Energy oil type curves: average barrels per day per well on a log scale against months on production 2010-2014: 37 wells in curve; starts at 10.7 bbl/d per well, 5.2 Mbbl cumulative through month 143 (100% of its wells old enough at that month); the dashed curve runs through month 203, on our forecast where a well’s own record ends2015: 26 wells in curve; starts at 1.7 bbl/d per well, 0.3 Mbbl cumulative through month 125 (100% of its wells old enough at that month)2017: 25 wells in curve; starts at 0.1 bbl/d per well, 0.0 Mbbl cumulative through month 22 (100% of its wells old enough at that month)2019: 11 wells in curve; starts at 0.4 bbl/d per well, 0.0 Mbbl cumulative through month 30 (100% of its wells old enough at that month)2020: 7 wells in curve; starts at 0.5 bbl/d per well, 0.0 Mbbl cumulative through month 1 (100% of its wells old enough at that month)2021: 17 wells in curve; starts at 0.5 bbl/d per well, 0.0 Mbbl cumulative through month 24 (100% of its wells old enough at that month)2022: 28 wells in curve; starts at 0.3 bbl/d per well, 0.0 Mbbl cumulative through month 3 (100% of its wells old enough at that month)2023: 17 wells in curve; starts at 0.1 bbl/d per well, 0.0 Mbbl cumulative through month 2 (100% of its wells old enough at that month)0.10.20.51251015bbl/d24487296120144168192216Months on production

Horizontal wells only. Average production per well, for wells grouped by when they first produced.

How these curves are built

Horizontal wells only: 278 of the 282 wells in these cohorts. Average daily production per well, for wells grouped by when they first produced. Includes every well of the cohort that is old enough at each month. Wells that are shut in or have stopped producing count as zero, so the average reflects the full cohort, not just survivors. Rates are calendar-day (volume ÷ days in month). The cumulative axis accumulates those same monthly averages at the average month length. Months not yet fully reported are excluded. The 2010-2014 curve draws those years as one group. The chart opens on average daily rate against months on production, the rate on a log scale. The view control switches to rate against cumulative production per well, on the same log rate scale, or to cumulative production per well against months on production, on a linear scale. Every view draws the same cohorts from the same production history. Each cohort with a dashed curve is solid through the last month all the wells in its curve sit inside fully reported data. Past it the dashed curve carries the same wells forward, on our forecast where a well’s own record ends, for up to five years. A dashed curve runs as far as at least nine in ten of its wells are accounted for. A cohort with no dashed curve is drawn only through the months where at least 50% of its wells are old enough for the month to be fully reported. A well that is old enough but shut in still counts, as zero. The measured months are what these wells reported. In the forward months each well counts its own reported figure for each month it has one, our forecast for each month it has only that, and zero for the rest. The forward average counts every well in the curve. The drawn forecast runs up to five years past the measured months. Line thickness tracks how many wells each curve is drawn from.

Cohort summary table
First produced Wells in curve Peak oil (bbl/d per well) Month-12 oil (bbl/d per well) Cum oil in series (Mbbl per well) Peak gas (Mcf/d per well) Month-12 gas (Mcf/d per well) Cum gas in series (Bcf per well) Months in series Wells old enough at last month in series Forecast months drawn
2026 17 0 — 0.0 4,346 — 0.2 2 100% 60
2025 26 0 0 0.0 6,567 3,991 1.7 16 65% 60
2024 43 0 0 0.0 3,760 2,890 1.9 27 53% 60
2023 17 0.3 0 0.0 5,534 4,121 3.8 39 53% 60
2022 28 0.5 0 0.0 6,309 2,304 4.7 50 82% 60
2021 17 0.5 0 0.0 5,910 5,227 6.9 62 100% 60
2020 7 0.5 0 0.0 5,676 2,253 5.5 74 100% 60
2019 11 0.4 0 0.0 4,995 4,394 5.2 86 100% 60
2018 9 0 0 0.0 3,986 2,225 4.8 97 89% 60
2017 25 0.1 0 0.0 4,074 2,702 5.2 110 60% 60
2016 15 0 0 0.0 3,866 2,668 5.2 122 73% 60
2015 26 1.7 0 0.3 4,220 3,546 6.3 135 58% 60
2010-2014 37 14.4 3 5.2 2,672 2,343 3.7 143 100% 60

Source: CommoVision (commovision.com)

Source: CommoVision · Pacific Canbriam Energy type curves, per-well production by first-production cohort.

Recent permitting

22 permits approved in the 365 days to November 5, 2026
21 permits in the 90 days to November 5, 2026
21 new-well permits in the 90 days to November 5, 2026
November 5, 2026 latest approval on record
About this chart

Approvals of every permit type per month, the 24 months to Nov 2026. The last bar is Nov 2026 through November 5, 2026 (20 so far), drawn hatched. All 22 approved in the 365 days to November 5, 2026 are permits to drill a new well. Permits to drill a new well: 22 in the 365 days to November 5, 2026 and 21 in the last 90 days of that window. How permits are counted.

  • Pacific Canbriam Energy was granted 22 well permits in the 365 days to November 5, 2026. Of those, 21 came in the last 90 days of that window. The latest approval on record is dated November 5, 2026.
  • All 22 approved in the 365 days to November 5, 2026 are permits to drill a new well. Permits to drill a new well: 22 in the 365 days to November 5, 2026 and 21 in the last 90 days of that window.
Well permits approved per month: full table
MonthPermits approved
Nov 2026 (through November 5, 2026)20
Oct 20260
Sep 20260
Aug 20261
Jul 20260
Jun 20261
May 20260
Apr 20260
Mar 20260
Feb 20260
Jan 20260
Dec 20250
Nov 20250
Oct 20250
Sep 20250
Aug 20250
Jul 20250
Jun 20250
May 20252
Apr 202515
Mar 20250
Feb 20250
Jan 20251
Dec 20240

Source: CommoVision (commovision.com)

What we cover here

Each row names the grain a region’s production is held at. Where a source publishes at a coarser grain, the page says so.

DataGrainSinceBenchmark
British Columbia production well 1954-06 —

Coverage rows for Pacific Canbriam Energy are regenerated at every build from the same catalog of sources the data is built from.

Top regions by 2025 operated production

RegionOil (MMbbl)Gas produced (Bcf)Share of 2025 output
British Columbia0161.1100.0%

Share of output counts oil and gas together, gas at its market-value weight.

What the data shows

  • Pacific Canbriam Energy produced 8 Mbbl (thousand barrels) of oil and 161.1 Bcf of natural gas in 2025.
  • Pacific Canbriam Energy gas production reached its highest level on record in 2025 at 161.1 Bcf.
  • Pacific Canbriam Energy operated production in British Columbia in our coverage.
  • 261 operated producing wells tracked, trailing 12 months per region.

Corporate history

Start a free trial

Watch supply move as soon as its sources publish, with forecasts on 1.1+ million producing wells. A real API and MCP access for AI tools are live, and the Portal is open.

What the trial includes

Data use is subject to our Terms of Service.