CommoVision

See the future in real time

Expand Energy

Expand Energy produced 8.1 MMbbl of oil and 3.93 Tcf of natural gas in 2025. 5,763 operated producing wells tracked, trailing 12 months per region.

  • Largest operator by operated natural gas in Pennsylvania, 2025.
  • Operated 24.3% of the natural gas produced in Pennsylvania, 2025.
  • Natural gas production rose 46% in 2025 as wells changed hands.
Operator

Expand Energy's figures include production filed by its subsidiaries under their own names.

Expand Energy's figures include production filed by its subsidiaries under their own names. Under Current operator an old month can show a later company.
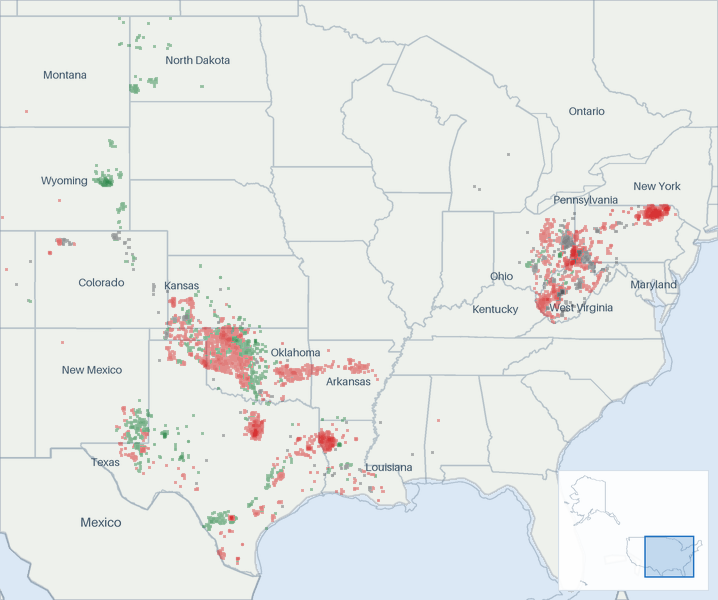
Well map of Expand Energy. The full map is further down this page.

Production

Expand Energy natural gas production (Bcf/d, grouped by when each well first produced)
As reported. Reported data only.
Expand Energy natural gas production: billion cubic feet per day, by first-production vintage as filed so far today 51015 Bcf/d 201620182020202220242026 Jan 2016: 4.58 Bcf/d total Feb 2016: 4.78 Bcf/d total Mar 2016: 4.44 Bcf/d total Apr 2016: 4.43 Bcf/d total May 2016: 4.53 Bcf/d total Jun 2016: 4.59 Bcf/d total Jul 2016: 4.55 Bcf/d total Aug 2016: 4.51 Bcf/d total Sep 2016: 4.27 Bcf/d total Oct 2016: 4.19 Bcf/d total Nov 2016: 4.47 Bcf/d total Dec 2016: 4.54 Bcf/d total Jan 2017: 4.49 Bcf/d total Feb 2017: 4.45 Bcf/d total Mar 2017: 4.45 Bcf/d total Apr 2017: 4.44 Bcf/d total May 2017: 4.45 Bcf/d total Jun 2017: 4.45 Bcf/d total Jul 2017: 4.43 Bcf/d total Aug 2017: 3.63 Bcf/d total Sep 2017: 3.67 Bcf/d total Oct 2017: 3.71 Bcf/d total Nov 2017: 4.11 Bcf/d total Dec 2017: 4.23 Bcf/d total Jan 2018: 3.94 Bcf/d total Feb 2018: 3.86 Bcf/d total Mar 2018: 3.77 Bcf/d total Apr 2018: 3.64 Bcf/d total May 2018: 3.63 Bcf/d total Jun 2018: 3.6 Bcf/d total Jul 2018: 3.75 Bcf/d total Aug 2018: 3.74 Bcf/d total Sep 2018: 3.56 Bcf/d total Oct 2018: 3.63 Bcf/d total Nov 2018: 3.74 Bcf/d total Dec 2018: 3.81 Bcf/d total Jan 2019: 4.1 Bcf/d total Feb 2019: 4.21 Bcf/d total Mar 2019: 4.05 Bcf/d total Apr 2019: 4.11 Bcf/d total May 2019: 4.08 Bcf/d total Jun 2019: 4.13 Bcf/d total Jul 2019: 4.26 Bcf/d total Aug 2019: 4.24 Bcf/d total Sep 2019: 4.2 Bcf/d total Oct 2019: 3.9 Bcf/d total Nov 2019: 4.23 Bcf/d total Dec 2019: 4.08 Bcf/d total Jan 2020: 3.94 Bcf/d total Feb 2020: 3.84 Bcf/d total Mar 2020: 3.9 Bcf/d total Apr 2020: 3.96 Bcf/d total May 2020: 3.75 Bcf/d total Jun 2020: 3.89 Bcf/d total Jul 2020: 4.06 Bcf/d total Aug 2020: 4.17 Bcf/d total Sep 2020: 3.95 Bcf/d total Oct 2020: 4.03 Bcf/d total Nov 2020: 4.12 Bcf/d total Dec 2020: 4.37 Bcf/d total Jan 2021: 4.46 Bcf/d total Feb 2021: 4.21 Bcf/d total Mar 2021: 4.53 Bcf/d total Apr 2021: 4.49 Bcf/d total May 2021: 4.34 Bcf/d total Jun 2021: 4.52 Bcf/d total Jul 2021: 4.51 Bcf/d total Aug 2021: 4.58 Bcf/d total Sep 2021: 4.7 Bcf/d total Oct 2021: 4.67 Bcf/d total Nov 2021: 5.98 Bcf/d total Dec 2021: 6.06 Bcf/d total Jan 2022: 5.86 Bcf/d total Feb 2022: 5.9 Bcf/d total Mar 2022: 7.04 Bcf/d total Apr 2022: 7.13 Bcf/d total May 2022: 7.01 Bcf/d total Jun 2022: 6.85 Bcf/d total Jul 2022: 7.01 Bcf/d total Aug 2022: 6.93 Bcf/d total Sep 2022: 6.88 Bcf/d total Oct 2022: 6.86 Bcf/d total Nov 2022: 6.86 Bcf/d total Dec 2022: 6.66 Bcf/d total Jan 2023: 6.88 Bcf/d total Feb 2023: 6.96 Bcf/d total Mar 2023: 7.02 Bcf/d total Apr 2023: 6.88 Bcf/d total May 2023: 6.64 Bcf/d total Jun 2023: 6.46 Bcf/d total Jul 2023: 6.54 Bcf/d total Aug 2023: 6.46 Bcf/d total Sep 2023: 6.23 Bcf/d total Oct 2023: 6.29 Bcf/d total Nov 2023: 6.43 Bcf/d total Dec 2023: 6.3 Bcf/d total Jan 2024: 7.53 Bcf/d total Feb 2024: 7.53 Bcf/d total Mar 2024: 6.61 Bcf/d total Apr 2024: 6.49 Bcf/d total May 2024: 6.35 Bcf/d total Jun 2024: 6.57 Bcf/d total Jul 2024: 6.81 Bcf/d total Aug 2024: 6.42 Bcf/d total Sep 2024: 5.78 Bcf/d total Oct 2024: 9.39 Bcf/d total Nov 2024: 9.26 Bcf/d total Dec 2024: 9.61 Bcf/d total Jan 2025: 9.98 Bcf/d total Feb 2025: 10.3 Bcf/d total Mar 2025: 10.6 Bcf/d total Apr 2025: 10.7 Bcf/d total May 2025: 10.8 Bcf/d total Jun 2025: 10.8 Bcf/d total Jul 2025: 11 Bcf/d total Aug 2025: 11.2 Bcf/d total Sep 2025: 10.4 Bcf/d total Oct 2025: 10.5 Bcf/d total Nov 2025: 11.5 Bcf/d total Dec 2025: 11.6 Bcf/d total Jan 2026: 11 Bcf/d as filed so far. Filings for this month are still arriving. The chart shows what has been filed. Feb 2026: 11.4 Bcf/d as filed so far. Filings for this month are still arriving. The chart shows what has been filed. Mar 2026: 11.3 Bcf/d as filed so far. Filings for this month are still arriving. The chart shows what has been filed. Apr 2026: 11.2 Bcf/d as filed so far. Filings for this month are still arriving. The chart shows what has been filed. May 2026: 11 Bcf/d as filed so far. Filings for this month are still arriving. The chart shows what has been filed. Jun 2026: 10.8 Bcf/d as filed so far. Filings for this month are still arriving. The chart shows what has been filed. Jul 2026: 9.19 Bcf/d as filed so far. Filings for this month are still arriving. The chart shows what has been filed. Aug 2026: 9.43 Bcf/d as filed so far. Filings for this month are still arriving. The chart shows what has been filed. Sep 2026: 0.01 Bcf/d as filed so far. Filings for this month are still arriving. The chart shows what has been filed.

Still arriving: Oct 2026 <1% filed.

All from what the source published. 99.76% held at well grain.

How the volume breaks down
  • 84.8% Reported by the official source by well
  • 0.24% Reported by the official source as a lease, facility, field or state total. Published without per-well detail.
  • 8.6% Reported by the official source as a lease total, split across the lease's wells. The regional total shown is the reported number, to rounding.
  • 6.1% Reported by the official source for a longer period, spread across its months. The period total is the reported number.
  • 0.07% A series adjusted to match official published figures: a well's cumulative, a later correction netted into the months before it, a field's oil volume from the royalty file for a month missing from the production report, or a state's yearly total from a second official source.
  • 0.11% The official source filed this volume for its reporting unit without naming the well. The well shown is our attribution, made only where a measured one-well ground identifies it; the volume itself is the source's own figure, untouched.

Every cubic foot here starts from what the official source published for the months measured. Measured over January 1987 to December 2025.

The gray “without per-well detail” band is volume the source reports above the well: fields, facilities, or leases the source publishes as one total. It is included so the stack still sums to the whole entity.

Expand Energy natural gas production (Bcf/d, grouped by when each well first produced)
As reported. Reported data only.
Expand Energy natural gas production: billion cubic feet per day, by first-production vintage as filed so far today 51015 Bcf/d 201620182020202220242026 Jan 2016: 5.94 Bcf/d total Feb 2016: 6.2 Bcf/d total Mar 2016: 5.91 Bcf/d total Apr 2016: 5.93 Bcf/d total May 2016: 5.96 Bcf/d total Jun 2016: 6.19 Bcf/d total Jul 2016: 6.27 Bcf/d total Aug 2016: 6.23 Bcf/d total Sep 2016: 5.89 Bcf/d total Oct 2016: 5.79 Bcf/d total Nov 2016: 6.2 Bcf/d total Dec 2016: 6.45 Bcf/d total Jan 2017: 6.52 Bcf/d total Feb 2017: 6.66 Bcf/d total Mar 2017: 6.78 Bcf/d total Apr 2017: 6.87 Bcf/d total May 2017: 6.98 Bcf/d total Jun 2017: 7.21 Bcf/d total Jul 2017: 7.47 Bcf/d total Aug 2017: 7.44 Bcf/d total Sep 2017: 7.67 Bcf/d total Oct 2017: 7.79 Bcf/d total Nov 2017: 8.49 Bcf/d total Dec 2017: 8.68 Bcf/d total Jan 2018: 8.52 Bcf/d total Feb 2018: 8.59 Bcf/d total Mar 2018: 8.53 Bcf/d total Apr 2018: 8.44 Bcf/d total May 2018: 8.55 Bcf/d total Jun 2018: 8.73 Bcf/d total Jul 2018: 9.18 Bcf/d total Aug 2018: 9.1 Bcf/d total Sep 2018: 9.01 Bcf/d total Oct 2018: 9.3 Bcf/d total Nov 2018: 9.64 Bcf/d total Dec 2018: 9.65 Bcf/d total Jan 2019: 9.95 Bcf/d total Feb 2019: 10 Bcf/d total Mar 2019: 9.82 Bcf/d total Apr 2019: 9.96 Bcf/d total May 2019: 9.89 Bcf/d total Jun 2019: 9.98 Bcf/d total Jul 2019: 10.3 Bcf/d total Aug 2019: 10.2 Bcf/d total Sep 2019: 10.3 Bcf/d total Oct 2019: 10.1 Bcf/d total Nov 2019: 10.6 Bcf/d total Dec 2019: 10.4 Bcf/d total Jan 2020: 10.2 Bcf/d total Feb 2020: 10.4 Bcf/d total Mar 2020: 10.4 Bcf/d total Apr 2020: 10.6 Bcf/d total May 2020: 10.7 Bcf/d total Jun 2020: 10.7 Bcf/d total Jul 2020: 10.9 Bcf/d total Aug 2020: 11 Bcf/d total Sep 2020: 10.9 Bcf/d total Oct 2020: 11 Bcf/d total Nov 2020: 11.2 Bcf/d total Dec 2020: 11.5 Bcf/d total Jan 2021: 11.6 Bcf/d total Feb 2021: 11.2 Bcf/d total Mar 2021: 11.8 Bcf/d total Apr 2021: 11.8 Bcf/d total May 2021: 11.7 Bcf/d total Jun 2021: 11.9 Bcf/d total Jul 2021: 12 Bcf/d total Aug 2021: 11.9 Bcf/d total Sep 2021: 12 Bcf/d total Oct 2021: 12.1 Bcf/d total Nov 2021: 12.5 Bcf/d total Dec 2021: 12.5 Bcf/d total Jan 2022: 12.2 Bcf/d total Feb 2022: 12.2 Bcf/d total Mar 2022: 12.4 Bcf/d total Apr 2022: 12.5 Bcf/d total May 2022: 12.4 Bcf/d total Jun 2022: 12.4 Bcf/d total Jul 2022: 12.5 Bcf/d total Aug 2022: 12.6 Bcf/d total Sep 2022: 12.4 Bcf/d total Oct 2022: 12.3 Bcf/d total Nov 2022: 12.4 Bcf/d total Dec 2022: 11.8 Bcf/d total Jan 2023: 12 Bcf/d total Feb 2023: 12.2 Bcf/d total Mar 2023: 12.2 Bcf/d total Apr 2023: 12.2 Bcf/d total May 2023: 12.1 Bcf/d total Jun 2023: 11.9 Bcf/d total Jul 2023: 12.1 Bcf/d total Aug 2023: 11.9 Bcf/d total Sep 2023: 11.5 Bcf/d total Oct 2023: 11.5 Bcf/d total Nov 2023: 11.7 Bcf/d total Dec 2023: 11.4 Bcf/d total Jan 2024: 11.3 Bcf/d total Feb 2024: 11.4 Bcf/d total Mar 2024: 10.4 Bcf/d total Apr 2024: 10.3 Bcf/d total May 2024: 10.1 Bcf/d total Jun 2024: 10.2 Bcf/d total Jul 2024: 10.5 Bcf/d total Aug 2024: 10.1 Bcf/d total Sep 2024: 9.33 Bcf/d total Oct 2024: 9.4 Bcf/d total Nov 2024: 9.26 Bcf/d total Dec 2024: 9.62 Bcf/d total Jan 2025: 9.98 Bcf/d total Feb 2025: 10.3 Bcf/d total Mar 2025: 10.6 Bcf/d total Apr 2025: 10.7 Bcf/d total May 2025: 10.8 Bcf/d total Jun 2025: 10.8 Bcf/d total Jul 2025: 11 Bcf/d total Aug 2025: 11.2 Bcf/d total Sep 2025: 10.4 Bcf/d total Oct 2025: 10.5 Bcf/d total Nov 2025: 11.5 Bcf/d total Dec 2025: 11.7 Bcf/d total Jan 2026: 11 Bcf/d as filed so far. Filings for this month are still arriving. The chart shows what has been filed. Feb 2026: 11.5 Bcf/d as filed so far. Filings for this month are still arriving. The chart shows what has been filed. Mar 2026: 11.3 Bcf/d as filed so far. Filings for this month are still arriving. The chart shows what has been filed. Apr 2026: 11.3 Bcf/d as filed so far. Filings for this month are still arriving. The chart shows what has been filed. May 2026: 11 Bcf/d as filed so far. Filings for this month are still arriving. The chart shows what has been filed. Jun 2026: 10.9 Bcf/d as filed so far. Filings for this month are still arriving. The chart shows what has been filed. Jul 2026: 9.2 Bcf/d as filed so far. Filings for this month are still arriving. The chart shows what has been filed. Aug 2026: 9.43 Bcf/d as filed so far. Filings for this month are still arriving. The chart shows what has been filed. Sep 2026: 0.01 Bcf/d as filed so far. Filings for this month are still arriving. The chart shows what has been filed.

Still arriving: Oct 2026 <1% filed.

The gray “without per-well detail” band is volume the source reports above the well: fields, facilities, or leases the source publishes as one total. It is included so the stack still sums to the whole entity.

Expand Energy oil production (Mbbl/d, grouped by when each well first produced)
As reported. Reported data only.
Expand Energy oil production: thousand barrels per day, by first-production vintage as filed so far today 50100150200 Mbbl/d 201620182020202220242026 Jan 2016: 160 Mbbl/d total Feb 2016: 134 Mbbl/d total Mar 2016: 131 Mbbl/d total Apr 2016: 151 Mbbl/d total May 2016: 147 Mbbl/d total Jun 2016: 155 Mbbl/d total Jul 2016: 157 Mbbl/d total Aug 2016: 157 Mbbl/d total Sep 2016: 165 Mbbl/d total Oct 2016: 167 Mbbl/d total Nov 2016: 167 Mbbl/d total Dec 2016: 161 Mbbl/d total Jan 2017: 154 Mbbl/d total Feb 2017: 152 Mbbl/d total Mar 2017: 147 Mbbl/d total Apr 2017: 145 Mbbl/d total May 2017: 146 Mbbl/d total Jun 2017: 142 Mbbl/d total Jul 2017: 132 Mbbl/d total Aug 2017: 128 Mbbl/d total Sep 2017: 132 Mbbl/d total Oct 2017: 139 Mbbl/d total Nov 2017: 154 Mbbl/d total Dec 2017: 161 Mbbl/d total Jan 2018: 134 Mbbl/d total Feb 2018: 124 Mbbl/d total Mar 2018: 135 Mbbl/d total Apr 2018: 134 Mbbl/d total May 2018: 135 Mbbl/d total Jun 2018: 132 Mbbl/d total Jul 2018: 129 Mbbl/d total Aug 2018: 127 Mbbl/d total Sep 2018: 122 Mbbl/d total Oct 2018: 123 Mbbl/d total Nov 2018: 133 Mbbl/d total Dec 2018: 136 Mbbl/d total Jan 2019: 135 Mbbl/d total Feb 2019: 165 Mbbl/d total Mar 2019: 171 Mbbl/d total Apr 2019: 179 Mbbl/d total May 2019: 183 Mbbl/d total Jun 2019: 172 Mbbl/d total Jul 2019: 170 Mbbl/d total Aug 2019: 166 Mbbl/d total Sep 2019: 174 Mbbl/d total Oct 2019: 174 Mbbl/d total Nov 2019: 170 Mbbl/d total Dec 2019: 178 Mbbl/d total Jan 2020: 181 Mbbl/d total Feb 2020: 179 Mbbl/d total Mar 2020: 183 Mbbl/d total Apr 2020: 173 Mbbl/d total May 2020: 85.1 Mbbl/d total Jun 2020: 128 Mbbl/d total Jul 2020: 142 Mbbl/d total Aug 2020: 157 Mbbl/d total Sep 2020: 150 Mbbl/d total Oct 2020: 135 Mbbl/d total Nov 2020: 136 Mbbl/d total Dec 2020: 130 Mbbl/d total Jan 2021: 130 Mbbl/d total Feb 2021: 104 Mbbl/d total Mar 2021: 121 Mbbl/d total Apr 2021: 116 Mbbl/d total May 2021: 111 Mbbl/d total Jun 2021: 106 Mbbl/d total Jul 2021: 102 Mbbl/d total Aug 2021: 99.5 Mbbl/d total Sep 2021: 97.1 Mbbl/d total Oct 2021: 93.3 Mbbl/d total Nov 2021: 94.6 Mbbl/d total Dec 2021: 94.4 Mbbl/d total Jan 2022: 92.6 Mbbl/d total Feb 2022: 90.3 Mbbl/d total Mar 2022: 92.2 Mbbl/d total Apr 2022: 90.4 Mbbl/d total May 2022: 88.7 Mbbl/d total Jun 2022: 74.2 Mbbl/d total Jul 2022: 74.1 Mbbl/d total Aug 2022: 73.6 Mbbl/d total Sep 2022: 75.9 Mbbl/d total Oct 2022: 79.9 Mbbl/d total Nov 2022: 78.9 Mbbl/d total Dec 2022: 76.4 Mbbl/d total Jan 2023: 76.6 Mbbl/d total Feb 2023: 77.9 Mbbl/d total Mar 2023: 55.1 Mbbl/d total Apr 2023: 14.2 Mbbl/d total May 2023: 17.2 Mbbl/d total Jun 2023: 14.5 Mbbl/d total Jul 2023: 15.2 Mbbl/d total Aug 2023: 15.9 Mbbl/d total Sep 2023: 15.1 Mbbl/d total Oct 2023: 16.2 Mbbl/d total Nov 2023: 0.36 Mbbl/d total Dec 2023: 0.39 Mbbl/d total Jan 2024: 16.6 Mbbl/d total Feb 2024: 15.9 Mbbl/d total Mar 2024: 14.8 Mbbl/d total Apr 2024: 18.6 Mbbl/d total May 2024: 16.9 Mbbl/d total Jun 2024: 14.5 Mbbl/d total Jul 2024: 13.7 Mbbl/d total Aug 2024: 13.8 Mbbl/d total Sep 2024: 12.2 Mbbl/d total Oct 2024: 19.2 Mbbl/d total Nov 2024: 17.1 Mbbl/d total Dec 2024: 15.9 Mbbl/d total Jan 2025: 18 Mbbl/d total Feb 2025: 19.6 Mbbl/d total Mar 2025: 17.7 Mbbl/d total Apr 2025: 23.4 Mbbl/d total May 2025: 23.8 Mbbl/d total Jun 2025: 23.8 Mbbl/d total Jul 2025: 24.2 Mbbl/d total Aug 2025: 25.3 Mbbl/d total Sep 2025: 23.2 Mbbl/d total Oct 2025: 23.9 Mbbl/d total Nov 2025: 20.4 Mbbl/d total Dec 2025: 22 Mbbl/d total Jan 2026: 19.2 Mbbl/d as filed so far. Filings for this month are still arriving. The chart shows what has been filed. Feb 2026: 20.3 Mbbl/d as filed so far. Filings for this month are still arriving. The chart shows what has been filed. Mar 2026: 22.7 Mbbl/d as filed so far. Filings for this month are still arriving. The chart shows what has been filed. Apr 2026: 21.7 Mbbl/d as filed so far. Filings for this month are still arriving. The chart shows what has been filed. May 2026: 19.9 Mbbl/d as filed so far. Filings for this month are still arriving. The chart shows what has been filed. Jun 2026: 17.9 Mbbl/d as filed so far. Filings for this month are still arriving. The chart shows what has been filed. Jul 2026: 0.25 Mbbl/d as filed so far. Filings for this month are still arriving. The chart shows what has been filed. Aug 2026: 0.27 Mbbl/d as filed so far. Filings for this month are still arriving. The chart shows what has been filed.

Still arriving: Sep 2026 <1% filed, Oct 2026 <1% filed.

All from what the source published. 99.86% held at well grain.

How the volume breaks down
  • 66.9% Reported by the official source by well
  • 0.14% Reported by the official source as a lease, facility, field or state total. Published without per-well detail.
  • 32.7% Reported by the official source as a lease total, split across the lease's wells. The regional total shown is the reported number, to rounding.
  • 0.28% Reported by the official source for a longer period, spread across its months. The period total is the reported number.
  • under 0.01% A series adjusted to match official published figures: a well's cumulative, a later correction netted into the months before it, a field's oil volume from the royalty file for a month missing from the production report, or a state's yearly total from a second official source.

Every barrel here starts from what the official source published for the months measured. Measured over January 1987 to December 2025.

The gray “without per-well detail” band is volume the source reports above the well: fields, facilities, or leases the source publishes as one total. It is included so the stack still sums to the whole entity.

Expand Energy oil production (Mbbl/d, grouped by when each well first produced)
As reported. Reported data only.
Expand Energy oil production: thousand barrels per day, by first-production vintage as filed so far today 204060 Mbbl/d 201620182020202220242026 Jan 2016: 21.6 Mbbl/d total Feb 2016: 18.9 Mbbl/d total Mar 2016: 17.7 Mbbl/d total Apr 2016: 18.4 Mbbl/d total May 2016: 18.6 Mbbl/d total Jun 2016: 19.1 Mbbl/d total Jul 2016: 19.5 Mbbl/d total Aug 2016: 19.1 Mbbl/d total Sep 2016: 20.1 Mbbl/d total Oct 2016: 21.6 Mbbl/d total Nov 2016: 23.3 Mbbl/d total Dec 2016: 21.1 Mbbl/d total Jan 2017: 21.7 Mbbl/d total Feb 2017: 25.1 Mbbl/d total Mar 2017: 21.6 Mbbl/d total Apr 2017: 21.6 Mbbl/d total May 2017: 20.1 Mbbl/d total Jun 2017: 20.2 Mbbl/d total Jul 2017: 20.7 Mbbl/d total Aug 2017: 21.1 Mbbl/d total Sep 2017: 21 Mbbl/d total Oct 2017: 22.3 Mbbl/d total Nov 2017: 27.2 Mbbl/d total Dec 2017: 25 Mbbl/d total Jan 2018: 25.3 Mbbl/d total Feb 2018: 27 Mbbl/d total Mar 2018: 28.9 Mbbl/d total Apr 2018: 27.7 Mbbl/d total May 2018: 29.2 Mbbl/d total Jun 2018: 32 Mbbl/d total Jul 2018: 34.1 Mbbl/d total Aug 2018: 37.2 Mbbl/d total Sep 2018: 43 Mbbl/d total Oct 2018: 45.1 Mbbl/d total Nov 2018: 44.3 Mbbl/d total Dec 2018: 40.5 Mbbl/d total Jan 2019: 37.7 Mbbl/d total Feb 2019: 34.6 Mbbl/d total Mar 2019: 30.3 Mbbl/d total Apr 2019: 32.1 Mbbl/d total May 2019: 28.5 Mbbl/d total Jun 2019: 37.8 Mbbl/d total Jul 2019: 45.8 Mbbl/d total Aug 2019: 46.9 Mbbl/d total Sep 2019: 47.7 Mbbl/d total Oct 2019: 47.1 Mbbl/d total Nov 2019: 46.6 Mbbl/d total Dec 2019: 41.5 Mbbl/d total Jan 2020: 43.1 Mbbl/d total Feb 2020: 41.3 Mbbl/d total Mar 2020: 34.7 Mbbl/d total Apr 2020: 30.4 Mbbl/d total May 2020: 28.1 Mbbl/d total Jun 2020: 30.5 Mbbl/d total Jul 2020: 32.4 Mbbl/d total Aug 2020: 37.1 Mbbl/d total Sep 2020: 34.2 Mbbl/d total Oct 2020: 29.8 Mbbl/d total Nov 2020: 26.4 Mbbl/d total Dec 2020: 27.8 Mbbl/d total Jan 2021: 29.9 Mbbl/d total Feb 2021: 27.8 Mbbl/d total Mar 2021: 30 Mbbl/d total Apr 2021: 31.7 Mbbl/d total May 2021: 28.8 Mbbl/d total Jun 2021: 29.2 Mbbl/d total Jul 2021: 26.8 Mbbl/d total Aug 2021: 28.6 Mbbl/d total Sep 2021: 28.9 Mbbl/d total Oct 2021: 25 Mbbl/d total Nov 2021: 21.2 Mbbl/d total Dec 2021: 19.9 Mbbl/d total Jan 2022: 23.1 Mbbl/d total Feb 2022: 21.7 Mbbl/d total Mar 2022: 21.5 Mbbl/d total Apr 2022: 24.2 Mbbl/d total May 2022: 22.6 Mbbl/d total Jun 2022: 21.3 Mbbl/d total Jul 2022: 19.7 Mbbl/d total Aug 2022: 19.2 Mbbl/d total Sep 2022: 19.7 Mbbl/d total Oct 2022: 19.8 Mbbl/d total Nov 2022: 20.3 Mbbl/d total Dec 2022: 20.2 Mbbl/d total Jan 2023: 23.9 Mbbl/d total Feb 2023: 26.6 Mbbl/d total Mar 2023: 25.5 Mbbl/d total Apr 2023: 22.7 Mbbl/d total May 2023: 23.9 Mbbl/d total Jun 2023: 25.2 Mbbl/d total Jul 2023: 22.4 Mbbl/d total Aug 2023: 22.4 Mbbl/d total Sep 2023: 20.6 Mbbl/d total Oct 2023: 23.8 Mbbl/d total Nov 2023: 24 Mbbl/d total Dec 2023: 23.6 Mbbl/d total Jan 2024: 22.3 Mbbl/d total Feb 2024: 21.1 Mbbl/d total Mar 2024: 19.2 Mbbl/d total Apr 2024: 23.1 Mbbl/d total May 2024: 21 Mbbl/d total Jun 2024: 19.1 Mbbl/d total Jul 2024: 20.1 Mbbl/d total Aug 2024: 20.7 Mbbl/d total Sep 2024: 18.3 Mbbl/d total Oct 2024: 19.2 Mbbl/d total Nov 2024: 17.1 Mbbl/d total Dec 2024: 15.9 Mbbl/d total Jan 2025: 18 Mbbl/d total Feb 2025: 19.6 Mbbl/d total Mar 2025: 17.7 Mbbl/d total Apr 2025: 23.4 Mbbl/d total May 2025: 23.8 Mbbl/d total Jun 2025: 23.8 Mbbl/d total Jul 2025: 24.2 Mbbl/d total Aug 2025: 25.3 Mbbl/d total Sep 2025: 23.2 Mbbl/d total Oct 2025: 23.9 Mbbl/d total Nov 2025: 20.4 Mbbl/d total Dec 2025: 22 Mbbl/d total Jan 2026: 19.2 Mbbl/d as filed so far. Filings for this month are still arriving. The chart shows what has been filed. Feb 2026: 20.3 Mbbl/d as filed so far. Filings for this month are still arriving. The chart shows what has been filed. Mar 2026: 22.7 Mbbl/d as filed so far. Filings for this month are still arriving. The chart shows what has been filed. Apr 2026: 21.7 Mbbl/d as filed so far. Filings for this month are still arriving. The chart shows what has been filed. May 2026: 19.9 Mbbl/d as filed so far. Filings for this month are still arriving. The chart shows what has been filed. Jun 2026: 17.9 Mbbl/d as filed so far. Filings for this month are still arriving. The chart shows what has been filed. Jul 2026: 0.25 Mbbl/d as filed so far. Filings for this month are still arriving. The chart shows what has been filed. Aug 2026: 0.27 Mbbl/d as filed so far. Filings for this month are still arriving. The chart shows what has been filed.

Still arriving: Sep 2026 <1% filed, Oct 2026 <1% filed.

The gray “without per-well detail” band is volume the source reports above the well: fields, facilities, or leases the source publishes as one total. It is included so the stack still sums to the whole entity.

The bands group wells by when they first produced.

About this chart

The stack shows what is holding today's rate up and how much of it is new drilling. The bands draw the filings already in.

These volumes are the production from the wells and facilities this company operates. Ownership works differently: other parties hold interests in these wells, and this company holds interests in wells that other companies operate. How we attribute production to a company

Annual table (full history)

best estimate incl. unsplit totals, allocated, adjusted and attributed

YearOil (MMbbl)Gas produced (Bcf)
20258.13,935
20245.82,695
20239.62,405
202230.02,465
202138.61,736
202054.31,464
201962.01,508
201847.61,359
201752.71,535
201656.51,643
201568.11,731
201473.91,932
201372.12,036
201249.22,040
201124.81,898
201015.11,525
200915.71,236
200813.81,101
200712.0908
200610.4714
20059.6617
20048.0474
20035.6339
20024.3237
20013.1198
20003.6192
19994.0176
19986.0142
19976.5159
19964.0171
19954.1132
19943.372
19931.739
19920.732
19910.933
19900.527
19890.312
19880.312
19870.39

Source: CommoVision (commovision.com)

Monthly table (last 24 months)
MonthOil (Mbbl)Gas produced (MMcf)
2025-12683.0359,891
2025-11612.1345,190
2025-10741.8325,336
2025-09696.2311,479
2025-08783.9346,894
2025-07749.9339,925
2025-06714.1324,464
2025-05738.4334,636
2025-04703.2320,662
2025-03548.6329,543
2025-02550.1287,239
2025-01559.2309,403
2024-12492.1298,034
2024-11513.5277,789
2024-10595.0291,227
2024-09366.2173,562
2024-08427.1198,844
2024-07423.7211,065
2024-06436.1196,989
2024-05524.4196,864
2024-04556.9194,617
2024-03457.4204,788
2024-02462.5218,252
2024-01513.4233,269

Source: CommoVision (commovision.com)

Source: CommoVision · Expand Energy, data through December 2025.

Well map

A map of 17,576 well locations operated by Expand Energy for which CommoVision holds a published surface coordinate, each drawn where it is and colored by its primary product (green for oil, red for natural gas, gray where undetermined; a spot shared by more than one product shows the one with the most wells there), on a ground of land and water over faint country, state and province outlines and place names for orientation, with a small inset map locating this frame in the United States.
  • Oil 1,746
  • Natural gas 14,074
  • Undetermined 1,756
17,576 well locations operated by Expand Energy, colored by primary product.
About this map

Undetermined means not enough signal to settle it. Producing wells are the ones that reported oil or gas in the trailing 12 months per region.

22 Mbbl/d Dec 2025 oil production +38.8% vs Dec last year best estimate incl. allocated
11.61 Bcf/d Dec 2025 gas production +20.8% vs Dec last year best estimate incl. allocated and attributed
22.1 Mbbl/d 2025 oil production best estimate incl. allocated
10.78 Bcf/d 2025 gas production best estimate incl. allocated and attributed
5,763 wells Operated producing wells tracked trailing 12 months per region

Type curves

Expand Energy natural gas type curves (Mcf/d per well, log scale, against months on production; cohorts 2010–2026)
Expand Energy natural gas type curves: average thousand cubic feet per day per well on a log scale against months on production 2010-2014: 3,048 wells in curve; starts at 3,291 Mcf/d per well, 4.8 Bcf cumulative through month 133 (100% of its wells old enough at that month); the dashed curve runs through month 193, on our forecast where a well’s own record ends2015: 319 wells in curve; starts at 4,256 Mcf/d per well, 7.0 Bcf cumulative through month 121 (100% of its wells old enough at that month); the dashed curve runs through month 181, on our forecast where a well’s own record ends2016: 209 wells in curve; starts at 6,961 Mcf/d per well, 7.8 Bcf cumulative through month 110 (100% of its wells old enough at that month); the dashed curve runs through month 170, on our forecast where a well’s own record ends2017: 377 wells in curve; starts at 6,693 Mcf/d per well, 9.3 Bcf cumulative through month 97 (100% of its wells old enough at that month); the dashed curve runs through month 157, on our forecast where a well’s own record ends2018: 415 wells in curve; starts at 6,552 Mcf/d per well, 8.6 Bcf cumulative through month 85 (100% of its wells old enough at that month); the dashed curve runs through month 145, on our forecast where a well’s own record ends2019: 354 wells in curve; starts at 7,389 Mcf/d per well, 10.0 Bcf cumulative through month 79 (100% of its wells old enough at that month); the dashed curve runs through month 139, on our forecast where a well’s own record ends2020: 335 wells in curve; starts at 9,686 Mcf/d per well, 11.2 Bcf cumulative through month 62 (100% of its wells old enough at that month); the dashed curve runs through month 122, on our forecast where a well’s own record ends2021: 294 wells in curve; starts at 9,741 Mcf/d per well, 11.2 Bcf cumulative through month 54 (100% of its wells old enough at that month); the dashed curve runs through month 114, on our forecast where a well’s own record ends2022: 308 wells in curve; starts at 12,602 Mcf/d per well, 9.9 Bcf cumulative through month 39 (100% of its wells old enough at that month); the dashed curve runs through month 99, on our forecast where a well’s own record ends2023: 265 wells in curve; starts at 11,861 Mcf/d per well, 8.0 Bcf cumulative through month 25 (100% of its wells old enough at that month); the dashed curve runs through month 85, on our forecast where a well’s own record ends2024: 140 wells in curve; starts at 13,757 Mcf/d per well, 8.4 Bcf cumulative through month 20 (100% of its wells old enough at that month); the dashed curve runs through month 80, on our forecast where a well’s own record ends2025: 279 wells in curve; starts at 14,108 Mcf/d per well, 4.7 Bcf cumulative through month 8 (100% of its wells old enough at that month); the dashed curve runs through month 68, on our forecast where a well’s own record ends2026: 115 wells in curve; starts at 14,315 Mcf/d per well, 0.4 Bcf cumulative through month 1 (100% of its wells old enough at that month); the dashed curve runs through month 61, on our forecast where a well’s own record ends2005001,0002,0005,00010,00020,00030,000Mcf/d24487296120144168192216Months on production
Expand Energy oil type curves (bbl/d per well, log scale, against months on production; cohorts 2010–2026)
Expand Energy oil type curves: average barrels per day per well on a log scale against months on production 2010-2014: 3,048 wells in curve; starts at 11.9 bbl/d per well, 13.4 Mbbl cumulative through month 133 (100% of its wells old enough at that month); the dashed curve runs through month 193, on our forecast where a well’s own record ends2015: 319 wells in curve; starts at 35.4 bbl/d per well, 24.2 Mbbl cumulative through month 121 (100% of its wells old enough at that month); the dashed curve runs through month 181, on our forecast where a well’s own record ends2016: 209 wells in curve; starts at 30.4 bbl/d per well, 18.3 Mbbl cumulative through month 110 (100% of its wells old enough at that month); the dashed curve runs through month 170, on our forecast where a well’s own record ends2017: 377 wells in curve; starts at 19 bbl/d per well, 22.1 Mbbl cumulative through month 97 (100% of its wells old enough at that month); the dashed curve runs through month 157, on our forecast where a well’s own record ends2018: 415 wells in curve; starts at 37.5 bbl/d per well, 40.1 Mbbl cumulative through month 85 (100% of its wells old enough at that month); the dashed curve runs through month 145, on our forecast where a well’s own record ends2019: 354 wells in curve; starts at 63.7 bbl/d per well, 47.6 Mbbl cumulative through month 79 (100% of its wells old enough at that month); the dashed curve runs through month 139, on our forecast where a well’s own record ends2020: 335 wells in curve; starts at 17.3 bbl/d per well, 22.1 Mbbl cumulative through month 62 (100% of its wells old enough at that month); the dashed curve runs through month 122, on our forecast where a well’s own record ends2021: 294 wells in curve; starts at 21 bbl/d per well, 23.2 Mbbl cumulative through month 54 (100% of its wells old enough at that month); the dashed curve runs through month 114, on our forecast where a well’s own record ends2022: 308 wells in curve; starts at 13.7 bbl/d per well, 14.0 Mbbl cumulative through month 39 (100% of its wells old enough at that month); the dashed curve runs through month 99, on our forecast where a well’s own record ends2023: 265 wells in curve; starts at 53.7 bbl/d per well, 23.4 Mbbl cumulative through month 25 (100% of its wells old enough at that month); the dashed curve runs through month 85, on our forecast where a well’s own record ends2024: 140 wells in curve; starts at 58.2 bbl/d per well, 14.5 Mbbl cumulative through month 20 (100% of its wells old enough at that month); the dashed curve runs through month 80, on our forecast where a well’s own record ends2025: 279 wells in curve; starts at 23.3 bbl/d per well, 13.6 Mbbl cumulative through month 8 (100% of its wells old enough at that month); the dashed curve runs through month 68, on our forecast where a well’s own record ends2026: 115 wells in curve; starts at 22.7 bbl/d per well, 0.7 Mbbl cumulative through month 1 (100% of its wells old enough at that month); the dashed curve runs through month 61, on our forecast where a well’s own record ends0.1110100150bbl/d24487296120144168192216Months on production

best estimate incl. allocated, adjusted and attributed

Horizontal wells only. Average production per well, for wells grouped by when they first produced.

How these curves are built

Horizontal wells only: 6,458 of the 6,645 wells in these cohorts. Average daily production per well, for wells grouped by when they first produced. Includes every well of the cohort that is old enough at each month. Wells that are shut in or have stopped producing count as zero, so the average reflects the full cohort, not just survivors. Rates are calendar-day (volume ÷ days in month). The cumulative axis accumulates those same monthly averages at the average month length. Months not yet fully reported are excluded. The 2010-2014 curve draws those years as one group. The chart opens on average daily rate against months on production, the rate on a log scale. The view control switches to rate against cumulative production per well, on the same log rate scale, or to cumulative production per well against months on production, on a linear scale. Every view draws the same cohorts from the same production history. Each cohort is solid through the last month all the wells in its curve sit inside fully reported data. Past it the dashed curve carries the same wells forward, on our forecast where a well’s own record ends, for up to five years. A dashed curve runs as far as at least nine in ten of its wells are accounted for. A well that is old enough but shut in still counts, as zero. The measured months are what these wells reported. In the forward months each well counts its own reported figure for each month it has one, our forecast for each month it has only that, and zero for the rest. The forward average counts every well in the curve. The drawn forecast runs up to five years past the measured months. Line thickness tracks the size of each cohort. 71 wells are counted here but not shown on the age axis: they started producing in 1995 or earlier, too close to the start of our records for their region to verify their true age.

Cohort summary table
First produced Wells in curve Peak oil (bbl/d per well) Month-12 oil (bbl/d per well) Cum oil in series (Mbbl per well) Peak gas (Mcf/d per well) Month-12 gas (Mcf/d per well) Cum gas in series (Bcf per well) Months in series Wells old enough at last month in series Forecast months drawn
2026 115 22.7 — 0.7 14,315 — 0.4 1 100% 60
2025 279 85.3 — 13.6 25,674 — 4.7 8 100% 60
2024 140 71.3 15.3 14.5 23,710 11,803 8.4 20 100% 60
2023 265 94.1 24.2 23.4 22,892 9,658 8.0 25 100% 60
2022 308 46.4 13.2 14.0 22,995 10,135 9.9 39 100% 60
2021 294 77.3 19 23.2 22,294 10,995 11.2 54 100% 60
2020 335 60.6 17.7 22.1 20,314 10,243 11.2 62 100% 60
2019 354 134 36.7 47.6 15,988 8,638 10.0 79 100% 60
2018 415 102 32.1 40.1 13,635 6,844 8.6 85 100% 60
2017 377 56.1 15.6 22.1 13,379 6,959 9.3 97 100% 60
2016 209 45.6 15.2 18.3 10,941 5,836 7.8 110 100% 60
2015 319 57.1 16.8 24.2 7,189 4,368 7.0 121 100% 60
2010-2014 3,048 22.4 10.5 13.4 5,325 2,905 4.8 133 100% 60

Source: CommoVision (commovision.com)

Source: CommoVision · Expand Energy type curves, per-well production by first-production cohort.

Recent permitting

221 permits approved in the 365 days to October 30, 2026
49 permits in the 90 days to October 30, 2026
49 new-well permits in the 90 days to October 30, 2026
October 30, 2026 latest approval on record
About this chart

Approvals of every permit type per month, the 24 months to Oct 2026. The last bar is Oct 2026 through October 30, 2026 (7 so far), drawn hatched. Of the 221 approved in the 365 days to October 30, 2026, 215 are permits to drill a new well and 6 are permits to plug wells. Permits to drill a new well: 215 in the 365 days to October 30, 2026 and 49 in the last 90 days of that window. How permits are counted.

  • Expand Energy was granted 221 well permits in the 365 days to October 30, 2026. Of those, 49 came in the last 90 days of that window. The latest approval on record is dated October 30, 2026.
  • Of the 221 approved in the 365 days to October 30, 2026, 215 are permits to drill a new well and 6 are permits to plug wells. Permits to drill a new well: 215 in the 365 days to October 30, 2026 and 49 in the last 90 days of that window.
  • Permits counted here come from Louisiana, Ohio, Pennsylvania, Texas and West Virginia.
Well permits approved per month: full table
MonthPermits approved
Oct 2026 (through October 30, 2026)7
Sep 202621
Aug 202621
Jul 202628
Jun 202619
May 202624
Apr 202612
Mar 202615
Feb 20267
Jan 202619
Dec 202531
Nov 202515
Oct 202537
Sep 20255
Aug 202512
Jul 202524
Jun 202515
May 202522
Apr 202530
Mar 202514
Feb 202521
Jan 20257
Dec 20248
Nov 202412

Source: CommoVision (commovision.com)

What we cover here

Each row names the grain a region’s production is held at. Where a source publishes at a coarser grain, the page says so.

DataGrainSinceBenchmark
Alberta production project + well 1962-01 ~100% of StatCan (oil)
Arkansas production well 1920-04 ~62–101% of EIA
Colorado production well 1999-01 ~100% of EIA
Kansas production well 1987-01 ~99% of EIA
Louisiana production well 1977-01 ~97–98% of EIA
Montana production well 1986-01 ~96–100% of EIA
North Dakota production well 1951-04 ~99–100% of EIA
New Mexico production well 1924-01 ~98–100% of EIA
Ohio production well 1955-08 ~99% of EIA
Oklahoma production lease + well 1990-07 ~99–100% of EIA
Pennsylvania production well 1980-01 ~100% of EIA
Texas production well 1993-01 ~100% of EIA
West Virginia production well 1985-01 ~99–100% of EIA
Wyoming production well 1978-01 ~100–101% of EIA

Where a row carries a Benchmark figure, the cell names the published estimate it compares against: the EIA’s for United States rows, Statistics Canada’s for Canadian rows.

About the benchmark comparisons

Where a row carries a Benchmark figure, it names the agency it compares against: the EIA for United States rows, Statistics Canada for Canadian rows. The compared series are produced differently from ours, so recent months can differ in either direction.

Coverage rows for Expand Energy are regenerated at every build from the same catalog of sources the data is built from.

Top regions by 2025 operated production best estimate incl. allocated and attributed

RegionOil (MMbbl)Gas produced (Bcf)Share of 2025 output
Pennsylvania0.21907.747.1%
Louisiana01461.536.0%
West Virginia6.8426.913.1%
Ohio1.1138.53.8%
Kansas000.0%
Oklahoma000.0%
Texas——0.0%

Share of output counts oil and gas together, gas at its market-value weight.

— means no figure is published for that period.

What the data shows

  • Expand Energy produced 8.1 MMbbl of oil and 3.93 Tcf of natural gas in 2025.
  • Expand Energy gas production reached its highest level on record in 2025 at 3.93 Tcf.
  • Expand Energy operated production across 14 reporting regions in 2 countries (Canada, United States) in our coverage.
  • 5,763 operated producing wells tracked, trailing 12 months per region.

Corporate history

  • October 2024 Chesapeake Energy continued as Expand Energy.
  • 2024 Expand Energy acquired Chesapeake Exploration.
  • 2024 Southwestern Energy merged into Expand Energy.
  • March 2023 Assets moved from Chesapeake Energy to Wildfire Energy Operating.
  • 2022 Chesapeake Energy acquired Chief Oil & Gas.
  • 2019 Chesapeake Energy acquired WildHorse Resource Development Corporation.
  • December 2016 WildHorse Resources II, LLC became part of WildHorse Resource Development Corporation.
  • June 2014 Wildhorse Resources Management Co, LLC became part of WildHorse Resources II, LLC.
  • October 2012 Wildhorse Resources Management Co, LLC became part of Wildhorse Resources, LLC.
  • November 2005 Chesapeake Energy acquired Columbia Natural Resources, Inc..
  • February 2005 Chesapeake Energy acquired BRG Petroleum Corporation.
  • 2002 Chesapeake Energy acquired Focus Energy.
  • 2002 Chesapeake Energy acquired Canaan Energy Corporation.
  • 1998 Chesapeake Energy acquired Hugoton Energy Corporation.

Start a free trial

Watch supply move as soon as its sources publish, with forecasts on 1.1+ million producing wells. A real API and MCP access for AI tools are live, and the Portal is open.

What the trial includes

Data use is subject to our Terms of Service.