CommoVision

See the future in real time

North Slope Borough, Alaska

North Slope Borough, Alaska produced 151.2 MMbbl of oil and 3.49 Tcf of natural gas in 2025. 1,942 producing wells tracked, 12 months to Jul 2026.

  • Largest gas-producing borough in Alaska, 2025.
  • 98.0% of the natural gas produced in Alaska, 2025.
  • Natural gas production changed less than 1% in 2025 from 2024.
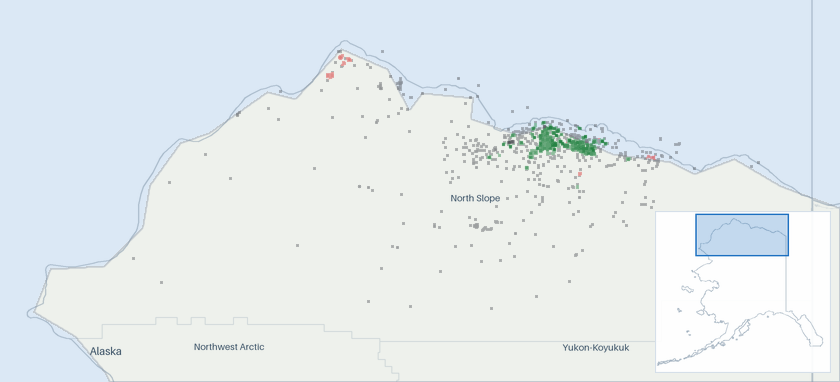
Well map of North Slope Borough, Alaska. The full map is further down this page.

Production

North Slope Borough, Alaska natural gas production (Bcf/d, grouped by when each well first produced)
  • filling in (est. · missed) . Hatching marks our estimate of the volume still to be filed. That estimate draws on our own production forecast. A check on the forecast behind this estimate measured a miss. It updates as filings arrive
North Slope Borough, Alaska natural gas production: billion cubic feet per day, by first-production vintage filed in full 51015 Bcf/d 2017201820192020202120222023202420252026 Oct 2016: 8.59 Bcf/d total Nov 2016: 9.6 Bcf/d total Dec 2016: 9.74 Bcf/d total Jan 2017: 9.52 Bcf/d total Feb 2017: 9.62 Bcf/d total Mar 2017: 9.74 Bcf/d total Apr 2017: 9.36 Bcf/d total May 2017: 9.04 Bcf/d total Jun 2017: 8.1 Bcf/d total Jul 2017: 6.43 Bcf/d total Aug 2017: 6.94 Bcf/d total Sep 2017: 8.31 Bcf/d total Oct 2017: 8.94 Bcf/d total Nov 2017: 9.22 Bcf/d total Dec 2017: 9.33 Bcf/d total Jan 2018: 9.39 Bcf/d total Feb 2018: 9.41 Bcf/d total Mar 2018: 9.37 Bcf/d total Apr 2018: 9.26 Bcf/d total May 2018: 8.96 Bcf/d total Jun 2018: 7.46 Bcf/d total Jul 2018: 7.37 Bcf/d total Aug 2018: 7.66 Bcf/d total Sep 2018: 8.34 Bcf/d total Oct 2018: 8.56 Bcf/d total Nov 2018: 9.49 Bcf/d total Dec 2018: 9.64 Bcf/d total Jan 2019: 9.85 Bcf/d total Feb 2019: 9.39 Bcf/d total Mar 2019: 9.04 Bcf/d total Apr 2019: 9.47 Bcf/d total May 2019: 9.05 Bcf/d total Jun 2019: 8.29 Bcf/d total Jul 2019: 7.4 Bcf/d total Aug 2019: 7.07 Bcf/d total Sep 2019: 7.92 Bcf/d total Oct 2019: 8.51 Bcf/d total Nov 2019: 9.41 Bcf/d total Dec 2019: 9.51 Bcf/d total Jan 2020: 9.83 Bcf/d total Feb 2020: 9.88 Bcf/d total Mar 2020: 9.35 Bcf/d total Apr 2020: 9.13 Bcf/d total May 2020: 8.94 Bcf/d total Jun 2020: 8.69 Bcf/d total Jul 2020: 8.57 Bcf/d total Aug 2020: 8.13 Bcf/d total Sep 2020: 8.83 Bcf/d total Oct 2020: 9.31 Bcf/d total Nov 2020: 9.58 Bcf/d total Dec 2020: 10.3 Bcf/d total Jan 2021: 10.1 Bcf/d total Feb 2021: 9.81 Bcf/d total Mar 2021: 9.88 Bcf/d total Apr 2021: 9.58 Bcf/d total May 2021: 9.36 Bcf/d total Jun 2021: 8.9 Bcf/d total Jul 2021: 7.91 Bcf/d total Aug 2021: 8.55 Bcf/d total Sep 2021: 9.14 Bcf/d total Oct 2021: 9.13 Bcf/d total Nov 2021: 10 Bcf/d total Dec 2021: 10.4 Bcf/d total Jan 2022: 10.3 Bcf/d total Feb 2022: 10.4 Bcf/d total Mar 2022: 10.1 Bcf/d total Apr 2022: 9.84 Bcf/d total May 2022: 9.49 Bcf/d total Jun 2022: 8.8 Bcf/d total Jul 2022: 9 Bcf/d total Aug 2022: 8.68 Bcf/d total Sep 2022: 9.24 Bcf/d total Oct 2022: 9.45 Bcf/d total Nov 2022: 10.3 Bcf/d total Dec 2022: 10.6 Bcf/d total Jan 2023: 10.4 Bcf/d total Feb 2023: 10.4 Bcf/d total Mar 2023: 10 Bcf/d total Apr 2023: 9.92 Bcf/d total May 2023: 9.49 Bcf/d total Jun 2023: 8.99 Bcf/d total Jul 2023: 8.27 Bcf/d total Aug 2023: 7.59 Bcf/d total Sep 2023: 8.63 Bcf/d total Oct 2023: 9.48 Bcf/d total Nov 2023: 9.85 Bcf/d total Dec 2023: 10.4 Bcf/d total Jan 2024: 10.3 Bcf/d total Feb 2024: 10.4 Bcf/d total Mar 2024: 10.2 Bcf/d total Apr 2024: 9.63 Bcf/d total May 2024: 9.47 Bcf/d total Jun 2024: 8.87 Bcf/d total Jul 2024: 8.75 Bcf/d total Aug 2024: 8.32 Bcf/d total Sep 2024: 8.75 Bcf/d total Oct 2024: 9.54 Bcf/d total Nov 2024: 10.1 Bcf/d total Dec 2024: 10.3 Bcf/d total Jan 2025: 10.3 Bcf/d total Feb 2025: 10.3 Bcf/d total Mar 2025: 10.3 Bcf/d total Apr 2025: 9.91 Bcf/d total May 2025: 9.77 Bcf/d total Jun 2025: 9.14 Bcf/d total Jul 2025: 7.77 Bcf/d total Aug 2025: 8.53 Bcf/d total Sep 2025: 8.93 Bcf/d total Oct 2025: 9.43 Bcf/d total Nov 2025: 9.92 Bcf/d total Dec 2025: 10.6 Bcf/d total Jan 2026: 10.4 Bcf/d total Feb 2026: 10.2 Bcf/d total Mar 2026: 10.5 Bcf/d total Apr 2026: 10.2 Bcf/d total May 2026: 9.42 Bcf/d total Jun 2026: 8.95 Bcf/d total Jul 2026: ≈9.3 Bcf/d total (95% arrived, remainder estimated) Aug 2026: ≈8.19 Bcf/d total (<1% arrived, remainder estimated) Sep 2026: ≈8.89 Bcf/d total (<1% arrived, remainder estimated)

All from what the source published. All held at well grain.

How the volume breaks down
  • 100% Reported by the official source by well

Every cubic foot through June 2026 starts from what the official source published for those months. Measured over January 1968 to June 2026.

North Slope Borough, Alaska oil production (Mbbl/d, grouped by when each well first produced)
  • filling in (est. · missed) . Hatching marks our estimate of the volume still to be filed. That estimate draws on our own production forecast. A check on the forecast behind this estimate measured a miss. It updates as filings arrive
North Slope Borough, Alaska oil production: thousand barrels per day, by first-production vintage filed in full 200400600 Mbbl/d 2017201820192020202120222023202420252026 Oct 2016: 481 Mbbl/d total Nov 2016: 500 Mbbl/d total Dec 2016: 506 Mbbl/d total Jan 2017: 504 Mbbl/d total Feb 2017: 501 Mbbl/d total Mar 2017: 513 Mbbl/d total Apr 2017: 514 Mbbl/d total May 2017: 495 Mbbl/d total Jun 2017: 448 Mbbl/d total Jul 2017: 407 Mbbl/d total Aug 2017: 436 Mbbl/d total Sep 2017: 466 Mbbl/d total Oct 2017: 491 Mbbl/d total Nov 2017: 494 Mbbl/d total Dec 2017: 497 Mbbl/d total Jan 2018: 492 Mbbl/d total Feb 2018: 497 Mbbl/d total Mar 2018: 497 Mbbl/d total Apr 2018: 482 Mbbl/d total May 2018: 480 Mbbl/d total Jun 2018: 436 Mbbl/d total Jul 2018: 380 Mbbl/d total Aug 2018: 413 Mbbl/d total Sep 2018: 457 Mbbl/d total Oct 2018: 472 Mbbl/d total Nov 2018: 482 Mbbl/d total Dec 2018: 479 Mbbl/d total Jan 2019: 481 Mbbl/d total Feb 2019: 472 Mbbl/d total Mar 2019: 466 Mbbl/d total Apr 2019: 460 Mbbl/d total May 2019: 461 Mbbl/d total Jun 2019: 442 Mbbl/d total Jul 2019: 436 Mbbl/d total Aug 2019: 369 Mbbl/d total Sep 2019: 436 Mbbl/d total Oct 2019: 461 Mbbl/d total Nov 2019: 470 Mbbl/d total Dec 2019: 467 Mbbl/d total Jan 2020: 468 Mbbl/d total Feb 2020: 463 Mbbl/d total Mar 2020: 456 Mbbl/d total Apr 2020: 449 Mbbl/d total May 2020: 393 Mbbl/d total Jun 2020: 350 Mbbl/d total Jul 2020: 433 Mbbl/d total Aug 2020: 432 Mbbl/d total Sep 2020: 430 Mbbl/d total Oct 2020: 448 Mbbl/d total Nov 2020: 453 Mbbl/d total Dec 2020: 452 Mbbl/d total Jan 2021: 447 Mbbl/d total Feb 2021: 446 Mbbl/d total Mar 2021: 444 Mbbl/d total Apr 2021: 438 Mbbl/d total May 2021: 435 Mbbl/d total Jun 2021: 431 Mbbl/d total Jul 2021: 371 Mbbl/d total Aug 2021: 400 Mbbl/d total Sep 2021: 421 Mbbl/d total Oct 2021: 428 Mbbl/d total Nov 2021: 436 Mbbl/d total Dec 2021: 442 Mbbl/d total Jan 2022: 440 Mbbl/d total Feb 2022: 441 Mbbl/d total Mar 2022: 431 Mbbl/d total Apr 2022: 432 Mbbl/d total May 2022: 438 Mbbl/d total Jun 2022: 410 Mbbl/d total Jul 2022: 422 Mbbl/d total Aug 2022: 404 Mbbl/d total Sep 2022: 421 Mbbl/d total Oct 2022: 426 Mbbl/d total Nov 2022: 437 Mbbl/d total Dec 2022: 439 Mbbl/d total Jan 2023: 441 Mbbl/d total Feb 2023: 438 Mbbl/d total Mar 2023: 427 Mbbl/d total Apr 2023: 427 Mbbl/d total May 2023: 422 Mbbl/d total Jun 2023: 416 Mbbl/d total Jul 2023: 392 Mbbl/d total Aug 2023: 389 Mbbl/d total Sep 2023: 408 Mbbl/d total Oct 2023: 418 Mbbl/d total Nov 2023: 420 Mbbl/d total Dec 2023: 425 Mbbl/d total Jan 2024: 419 Mbbl/d total Feb 2024: 424 Mbbl/d total Mar 2024: 425 Mbbl/d total Apr 2024: 422 Mbbl/d total May 2024: 409 Mbbl/d total Jun 2024: 393 Mbbl/d total Jul 2024: 400 Mbbl/d total Aug 2024: 388 Mbbl/d total Sep 2024: 401 Mbbl/d total Oct 2024: 420 Mbbl/d total Nov 2024: 431 Mbbl/d total Dec 2024: 427 Mbbl/d total Jan 2025: 433 Mbbl/d total Feb 2025: 431 Mbbl/d total Mar 2025: 429 Mbbl/d total Apr 2025: 428 Mbbl/d total May 2025: 427 Mbbl/d total Jun 2025: 416 Mbbl/d total Jul 2025: 350 Mbbl/d total Aug 2025: 380 Mbbl/d total Sep 2025: 411 Mbbl/d total Oct 2025: 421 Mbbl/d total Nov 2025: 422 Mbbl/d total Dec 2025: 426 Mbbl/d total Jan 2026: 422 Mbbl/d total Feb 2026: 409 Mbbl/d total Mar 2026: 411 Mbbl/d total Apr 2026: 415 Mbbl/d total May 2026: 409 Mbbl/d total Jun 2026: 405 Mbbl/d total Jul 2026: ≈423 Mbbl/d total (95% arrived, remainder estimated) Aug 2026: ≈400 Mbbl/d total (<1% arrived, remainder estimated) Sep 2026: ≈429 Mbbl/d total (<1% arrived, remainder estimated)

All from what the source published. All held at well grain.

How the volume breaks down
  • 100% Reported by the official source by well

Every barrel through June 2026 starts from what the official source published for those months. Measured over January 1968 to June 2026.

The bands group wells by when they first produced.

About this chart

The stack shows what is holding today's rate up and how much of it is new drilling. In the reported months the bands draw the filings already in. The months still filling in are marked.

Annual table (full history)
YearOil (MMbbl)Gas produced (Bcf)
2025151.23,493
2024151.23,497
2023152.73,448
2022156.33,529
2021156.23,428
2020159.43,371
2019164.83,189
2018169.23,189
2017175.33,177
2016173.73,157
2015169.73,090
2014174.93,076
2013182.63,137
2012188.43,072
2011200.93,066
2010215.23,086
2009232.83,191
2008245.13,281
2007258.13,330
2006264.33,027
2005308.33,451
2004324.23,455
2003345.53,388
2002348.13,287
2001343.23,216
2000344.43,334
1999372.33,160
1998417.43,171
1997460.83,160
1996496.23,126
1995526.13,101
1994553.42,792
1993564.12,501
1992612.22,331
1991641.02,084
1990636.41,753
1989669.31,669
1988722.81,656
1987699.51,428
1986664.11,097
1985649.61,044
1984608.5906
1983600.8865
1982591.5781
1981556.3649
1980555.4598
1979468.4433
1978397.7309
1977115.396
19764.66
19752.94
19742.23
19730.91
19720.91
19711.22
19701.22
19690.31
19680.01

Source: CommoVision (commovision.com)

Monthly table (last 24 months)
MonthOil (Mbbl)Gas produced (MMcf)
2026-0712,836.9273,084
2026-0612,164.5268,506
2026-0512,668.0291,971
2026-0412,441.4304,962
2026-0312,738.4324,406
2026-0211,458.1286,357
2026-0113,070.0322,692
2025-1213,208.5328,574
2025-1112,660.3297,498
2025-1013,062.6292,374
2025-0912,344.2267,673
2025-0811,768.2264,497
2025-0710,858.3240,896
2025-0612,468.6274,240
2025-0513,246.8302,894
2025-0412,840.9297,296
2025-0313,290.4319,383
2025-0212,058.8288,937
2025-0113,427.9318,497
2024-1213,226.1318,985
2024-1112,931.8304,334
2024-1013,018.0295,715
2024-0912,016.7262,392
2024-0812,022.5257,895

Source: CommoVision (commovision.com)

Source: CommoVision · North Slope Borough, Alaska, data through July 2026.

Well map

A map of 5,096 well locations in North Slope Borough, Alaska for which CommoVision holds a published surface coordinate, each drawn where it is and colored by its primary product (green for oil, red for natural gas, gray where undetermined; a spot shared by more than one product shows the one with the most wells there), on a ground of land and water over faint state, province, county and census-division outlines and place names for orientation, with a small inset map locating this frame in Alaska.
  • Oil 3,385
  • Natural gas 233
  • Undetermined 1,478
5,096 well locations in North Slope Borough, Alaska, colored by primary product.
About this map

Undetermined means not enough signal to settle it. Producing wells are the ones that reported oil or gas in the 12 months to Jul 2026.

423.2 Mbbl/d (est.) Jul 2026 oil production Jul 2026 is still filling in. The figure is the filings already in plus an estimate of the part not yet filed. The change compares this estimate with the same month last year. +20.8% vs Jul last year
9.3 Bcf/d (est.) Jul 2026 gas production Jul 2026 is still filling in. The figure is the filings already in plus an estimate of the part not yet filed. The change compares this estimate with the same month last year. +19.7% vs Jul last year
414.3 Mbbl/d 2025 oil production
9.57 Bcf/d 2025 gas production
1,942 wells Producing wells tracked 12 months to Jul 2026

Type curves

North Slope Borough, Alaska natural gas type curves (Mcf/d per well, log scale, against months on production; cohorts 2010–2026)
North Slope Borough, Alaska natural gas type curves: average thousand cubic feet per day per well on a log scale against months on production 2010-2014: 112 wells; starts at 389 Mcf/d per well, 1.4 Bcf cumulative through month 140 (100% of its wells old enough at that month); the dashed curve runs through month 200, on our forecast where a well’s own record ends2015: 41 wells; starts at 1,086 Mcf/d per well, 3.9 Bcf cumulative through month 128 (100% of its wells old enough at that month); the dashed curve runs through month 188, on our forecast where a well’s own record ends2016: 32 wells; starts at 1,168 Mcf/d per well, 4.4 Bcf cumulative through month 116 (100% of its wells old enough at that month); the dashed curve runs through month 176, on our forecast where a well’s own record ends2017: 18 wells; starts at 578 Mcf/d per well, 2.3 Bcf cumulative through month 104 (100% of its wells old enough at that month); the dashed curve runs through month 164, on our forecast where a well’s own record ends2018: 19 wells; starts at 263 Mcf/d per well, 8.8 Bcf cumulative through month 93 (100% of its wells old enough at that month); the dashed curve runs through month 153, on our forecast where a well’s own record ends2019: 32 wells; starts at 446 Mcf/d per well, 3.3 Bcf cumulative through month 80 (100% of its wells old enough at that month); the dashed curve runs through month 140, on our forecast where a well’s own record ends2020: 23 wells; starts at 634 Mcf/d per well, 4.0 Bcf cumulative through month 68 (100% of its wells old enough at that month); the dashed curve runs through month 128, on our forecast where a well’s own record ends2021: 11 wells; starts at 2,458 Mcf/d per well, 2.7 Bcf cumulative through month 56 (100% of its wells old enough at that month); the dashed curve runs through month 116, on our forecast where a well’s own record ends2022: 31 wells; starts at 1,529 Mcf/d per well, 2.2 Bcf cumulative through month 44 (100% of its wells old enough at that month); the dashed curve runs through month 104, on our forecast where a well’s own record ends2023: 42 wells; starts at 480 Mcf/d per well, 0.5 Bcf cumulative through month 32 (100% of its wells old enough at that month); the dashed curve runs through month 92, on our forecast where a well’s own record ends2024: 52 wells; starts at 1,097 Mcf/d per well, 0.8 Bcf cumulative through month 20 (100% of its wells old enough at that month); the dashed curve runs through month 80, on our forecast where a well’s own record ends2025: 50 wells; starts at 329 Mcf/d per well, 0.2 Bcf cumulative through month 8 (100% of its wells old enough at that month); the dashed curve runs through month 16, on our forecast where a well’s own record ends2026: 18 wells; starts at 173 Mcf/d per well, 0.0 Bcf cumulative through month 1 (100% of its wells old enough at that month); the dashed curve runs through month 61, on our forecast where a well’s own record ends1002005001,0002,0005,0007,000Mcf/d24487296120144168192216Months on production
North Slope Borough, Alaska oil type curves (bbl/d per well, log scale, against months on production; cohorts 2010–2026)
North Slope Borough, Alaska oil type curves: average barrels per day per well on a log scale against months on production 2010-2014: 112 wells; starts at 587 bbl/d per well, 1,560 Mbbl cumulative through month 140 (100% of its wells old enough at that month); the dashed curve runs through month 200, on our forecast where a well’s own record ends2015: 41 wells; starts at 571 bbl/d per well, 1,352 Mbbl cumulative through month 128 (100% of its wells old enough at that month); the dashed curve runs through month 188, on our forecast where a well’s own record ends2016: 32 wells; starts at 1,118 bbl/d per well, 1,745 Mbbl cumulative through month 116 (100% of its wells old enough at that month); the dashed curve runs through month 176, on our forecast where a well’s own record ends2017: 18 wells; starts at 901 bbl/d per well, 2,370 Mbbl cumulative through month 104 (100% of its wells old enough at that month); the dashed curve runs through month 164, on our forecast where a well’s own record ends2018: 19 wells; starts at 396 bbl/d per well, 1,858 Mbbl cumulative through month 93 (100% of its wells old enough at that month); the dashed curve runs through month 153, on our forecast where a well’s own record ends2019: 32 wells; starts at 726 bbl/d per well, 1,303 Mbbl cumulative through month 80 (100% of its wells old enough at that month); the dashed curve runs through month 140, on our forecast where a well’s own record ends2020: 23 wells; starts at 423 bbl/d per well, 947 Mbbl cumulative through month 68 (100% of its wells old enough at that month); the dashed curve runs through month 128, on our forecast where a well’s own record ends2021: 11 wells; starts at 695 bbl/d per well, 1,001 Mbbl cumulative through month 56 (100% of its wells old enough at that month); the dashed curve runs through month 116, on our forecast where a well’s own record ends2022: 31 wells; starts at 1,068 bbl/d per well, 880 Mbbl cumulative through month 44 (100% of its wells old enough at that month); the dashed curve runs through month 104, on our forecast where a well’s own record ends2023: 42 wells; starts at 678 bbl/d per well, 469 Mbbl cumulative through month 32 (100% of its wells old enough at that month); the dashed curve runs through month 92, on our forecast where a well’s own record ends2024: 52 wells; starts at 785 bbl/d per well, 408 Mbbl cumulative through month 20 (100% of its wells old enough at that month); the dashed curve runs through month 80, on our forecast where a well’s own record ends2025: 50 wells; starts at 499 bbl/d per well, 158 Mbbl cumulative through month 8 (100% of its wells old enough at that month); the dashed curve runs through month 16, on our forecast where a well’s own record ends2026: 18 wells; starts at 413 bbl/d per well, 12.6 Mbbl cumulative through month 1 (100% of its wells old enough at that month); the dashed curve runs through month 61, on our forecast where a well’s own record ends701002005001,0002,0003,000bbl/d24487296120144168192216Months on production

Horizontal wells only. Average production per well, for wells grouped by when they first produced.

How these curves are built

Horizontal wells only: 481 of the 538 wells in these cohorts. Average daily production per well, for wells grouped by when they first produced. Includes every well of the cohort that is old enough at each month. Wells that are shut in or have stopped producing count as zero, so the average reflects the full cohort, not just survivors. Rates are calendar-day (volume ÷ days in month). The cumulative axis accumulates those same monthly averages at the average month length. Months not yet fully reported are excluded. The 2010-2014 curve draws those years as one group. The chart opens on average daily rate against months on production, the rate on a log scale. The view control switches to rate against cumulative production per well, on the same log rate scale, or to cumulative production per well against months on production, on a linear scale. Every view draws the same cohorts from the same production history. Each cohort is solid through the last month all of its wells sit inside fully reported data. Past it the dashed curve carries the same wells forward, on our forecast where a well’s own record ends, for up to five years. A dashed curve runs as far as at least nine in ten of its wells are accounted for. A well that is old enough but shut in still counts, as zero. The measured months are what these wells reported. In the forward months each well counts its own reported figure for each month it has one, our forecast for each month it has only that, and zero for the rest. The forward average counts every well of the cohort. The drawn forecast runs up to five years past the measured months. Line thickness tracks the size of each cohort.

Cohort summary table
First produced Wells Peak oil (bbl/d per well) Month-12 oil (bbl/d per well) Cum oil in series (Mbbl per well) Peak gas (Mcf/d per well) Month-12 gas (Mcf/d per well) Cum gas in series (Bcf per well) Months in series Wells old enough at last month in series Forecast months drawn
2026 18 413 12.6 173 0.0 1 100% 60
2025 50 1,009 158 991 0.2 8 100% 8
2024 52 1,035 594 408 2,114 1,091 0.8 20 100% 60
2023 42 1,213 430 469 1,391 334 0.5 32 100% 60
2022 31 1,716 539 880 4,365 1,115 2.2 44 100% 60
2021 11 1,878 764 1,001 4,865 2,984 2.7 56 100% 60
2020 23 1,060 553 947 2,614 2,137 4.0 68 100% 60
2019 32 1,321 645 1,303 1,966 1,301 3.3 80 100% 60
2018 19 1,550 1,345 1,858 5,664 3,860 8.8 93 100% 60
2017 18 2,120 1,281 2,370 1,887 958 2.3 104 100% 60
2016 32 1,370 815 1,745 2,337 1,824 4.4 116 100% 60
2015 41 1,036 655 1,352 2,026 1,206 3.9 128 100% 60
2010-2014 112 962 560 1,560 736 538 1.4 140 100% 60

Source: CommoVision (commovision.com)

Source: CommoVision · North Slope Borough, Alaska type curves, per-well production by first-production cohort.

Top operators in North Slope Borough, Alaska, 2025

  1. Hilcorp Energy 71.0%
  2. ConocoPhillips 14.6%
  3. Hilcorp Alaska 14.0%
  4. Glacier Oil & Gas 0.2%
  5. Mustang Holding, LLC 0.1%
  6. Oil Search (Alaska), LLC 0.1%
  7. North Slope Borough 0.0%
  8. BP 0.0%
  9. Caelus Natural Resources Alaska, LLC 0.0%
  10. ExxonMobil 0.0%
Top operators in North Slope Borough, Alaska, 2025: full table
OperatorOil (Mbbl/d, 2025)Gas produced (MMcf/d, 2025)Share of output
Hilcorp Energy 198.28,236.071.0%
ConocoPhillips 133.2307.214.6%
Hilcorp Alaska 79.51,019.614.0%
Glacier Oil & Gas 2.11.10.2%
Mustang Holding, LLC 0.71.00.1%
Oil Search (Alaska), LLC 0.60.30.1%
North Slope Borough 0.04.00.0%
BP 0.00.00.0%
Caelus Natural Resources Alaska, LLC 0.00.00.0%
ExxonMobil (January to September) 0.00.00.0%

Mbbl/d = thousand barrels per day · MMcf/d = million cubic feet per day (units).

Source: CommoVision (commovision.com)

Active drilling rigs

1 rigs active in the week to September 11, 2026
−5 rigs vs the same week a year earlier
12 rigs peak week, Feb 2019 (since Sep 2016)
Active drilling rigs by rig type (rigs, weekly count)Source: Baker Hughes rig count
Oil
Active drilling rigs by rig type: rigs, weekly count 5 10 15 rigs 2017201820192020202120222023202420252026 Week to Sep 16, 2016: 5 rigs total (Oil 5) Week to Sep 23, 2016: 6 rigs total (Oil 6) Week to Sep 30, 2016: 6 rigs total (Oil 6) Week to Oct 7, 2016: 6 rigs total (Oil 6) Week to Oct 14, 2016: 6 rigs total (Oil 6) Week to Oct 21, 2016: 7 rigs total (Oil 7) Week to Oct 28, 2016: 7 rigs total (Oil 7) Week to Nov 4, 2016: 6 rigs total (Oil 6) Week to Nov 11, 2016: 5 rigs total (Oil 5) Week to Nov 18, 2016: 5 rigs total (Oil 5) Week to Nov 23, 2016: 5 rigs total (Oil 5) Week to Dec 2, 2016: 5 rigs total (Oil 5) Week to Dec 9, 2016: 5 rigs total (Oil 5) Week to Dec 16, 2016: 5 rigs total (Oil 5) Week to Dec 23, 2016: 6 rigs total (Oil 6) Week to Dec 30, 2016: 6 rigs total (Oil 6) Week to Jan 6, 2017: 5 rigs total (Oil 5) Week to Jan 13, 2017: 5 rigs total (Oil 5) Week to Jan 20, 2017: 5 rigs total (Oil 5) Week to Jan 27, 2017: 6 rigs total (Oil 6) Week to Feb 3, 2017: 7 rigs total (Oil 7) Week to Feb 10, 2017: 7 rigs total (Oil 7) Week to Feb 17, 2017: 6 rigs total (Oil 6) Week to Feb 24, 2017: 5 rigs total (Oil 5) Week to Mar 3, 2017: 6 rigs total (Oil 6) Week to Mar 10, 2017: 3 rigs total (Oil 3) Week to Mar 17, 2017: 4 rigs total (Oil 4) Week to Mar 24, 2017: 3 rigs total (Oil 3) Week to Mar 31, 2017: 5 rigs total (Oil 5) Week to Apr 7, 2017: 3 rigs total (Oil 3) Week to Apr 13, 2017: 3 rigs total (Oil 3) Week to Apr 21, 2017: 4 rigs total (Oil 4) Week to Apr 28, 2017: 4 rigs total (Oil 4) Week to May 5, 2017: 4 rigs total (Oil 4) Week to May 12, 2017: 4 rigs total (Oil 4) Week to May 19, 2017: 5 rigs total (Oil 5) Week to May 26, 2017: 5 rigs total (Oil 5) Week to Jun 2, 2017: 5 rigs total (Oil 5) Week to Jun 9, 2017: 3 rigs total (Oil 3) Week to Jun 16, 2017: 4 rigs total (Oil 4) Week to Jun 23, 2017: 4 rigs total (Oil 4) Week to Jun 30, 2017: 4 rigs total (Oil 4) Week to Jul 7, 2017: 6 rigs total (Oil 6) Week to Jul 14, 2017: 4 rigs total (Oil 4) Week to Jul 21, 2017: 3 rigs total (Oil 3) Week to Jul 28, 2017: 3 rigs total (Oil 3) Week to Aug 4, 2017: 4 rigs total (Oil 4) Week to Aug 11, 2017: 4 rigs total (Oil 4) Week to Aug 18, 2017: 5 rigs total (Oil 5) Week to Aug 25, 2017: 3 rigs total (Oil 3) Week to Sep 1, 2017: 5 rigs total (Oil 5) Week to Sep 8, 2017: 3 rigs total (Oil 3) Week to Sep 15, 2017: 3 rigs total (Oil 3) Week to Sep 22, 2017: 4 rigs total (Oil 4) Week to Sep 29, 2017: 4 rigs total (Oil 4) Week to Oct 6, 2017: 4 rigs total (Oil 4) Week to Oct 13, 2017: 5 rigs total (Oil 5) Week to Oct 20, 2017: 3 rigs total (Oil 3) Week to Oct 27, 2017: 3 rigs total (Oil 3) Week to Nov 3, 2017: 5 rigs total (Oil 5) Week to Nov 10, 2017: 6 rigs total (Oil 6) Week to Nov 17, 2017: 4 rigs total (Oil 4) Week to Nov 22, 2017: 4 rigs total (Oil 4) Week to Dec 1, 2017: 4 rigs total (Oil 4) Week to Dec 8, 2017: 5 rigs total (Oil 5) Week to Dec 15, 2017: 5 rigs total (Oil 5) Week to Dec 22, 2017: 5 rigs total (Oil 5) Week to Dec 29, 2017: 5 rigs total (Oil 5) Week to Jan 5, 2018: 5 rigs total (Oil 5) Week to Jan 12, 2018: 6 rigs total (Oil 6) Week to Jan 19, 2018: 5 rigs total (Oil 5) Week to Jan 26, 2018: 5 rigs total (Oil 5) Week to Feb 2, 2018: 5 rigs total (Oil 5) Week to Feb 9, 2018: 5 rigs total (Oil 5) Week to Feb 16, 2018: 9 rigs total (Oil 9) Week to Feb 23, 2018: 9 rigs total (Oil 9) Week to Mar 2, 2018: 11 rigs total (Oil 11) Week to Mar 9, 2018: 9 rigs total (Oil 9) Week to Mar 16, 2018: 7 rigs total (Oil 7) Week to Mar 23, 2018: 9 rigs total (Oil 9) Week to Mar 29, 2018: 9 rigs total (Oil 9) Week to Apr 6, 2018: 8 rigs total (Oil 8) Week to Apr 13, 2018: 8 rigs total (Oil 8) Week to Apr 20, 2018: 8 rigs total (Oil 8) Week to Apr 27, 2018: 5 rigs total (Oil 5) Week to May 4, 2018: 6 rigs total (Oil 6) Week to May 11, 2018: 7 rigs total (Oil 7) Week to May 18, 2018: 5 rigs total (Oil 5) Week to May 25, 2018: 7 rigs total (Oil 7) Week to Jun 1, 2018: 7 rigs total (Oil 7) Week to Jun 8, 2018: 6 rigs total (Oil 6) Week to Jun 15, 2018: 4 rigs total (Oil 4) Week to Jun 22, 2018: 7 rigs total (Oil 7) Week to Jun 29, 2018: 6 rigs total (Oil 6) Week to Jul 6, 2018: 4 rigs total (Oil 4) Week to Jul 13, 2018: 3 rigs total (Oil 3) Week to Jul 20, 2018: 4 rigs total (Oil 4) Week to Jul 27, 2018: 4 rigs total (Oil 4) Week to Aug 3, 2018: 3 rigs total (Oil 3) Week to Aug 10, 2018: 4 rigs total (Oil 4) Week to Aug 17, 2018: 4 rigs total (Oil 4) Week to Aug 24, 2018: 3 rigs total (Oil 3) Week to Aug 31, 2018: 3 rigs total (Oil 3) Week to Sep 7, 2018: 3 rigs total (Oil 3) Week to Sep 14, 2018: 4 rigs total (Oil 4) Week to Sep 21, 2018: 3 rigs total (Oil 3) Week to Sep 28, 2018: 4 rigs total (Oil 4) Week to Oct 5, 2018: 4 rigs total (Oil 4) Week to Oct 12, 2018: 4 rigs total (Oil 4) Week to Oct 19, 2018: 2 rigs total (Oil 2) Week to Oct 26, 2018: 4 rigs total (Oil 4) Week to Nov 2, 2018: 4 rigs total (Oil 4) Week to Nov 9, 2018: 4 rigs total (Oil 4) Week to Nov 16, 2018: 4 rigs total (Oil 4) Week to Nov 21, 2018: 4 rigs total (Oil 4) Week to Nov 30, 2018: 5 rigs total (Oil 5) Week to Dec 7, 2018: 6 rigs total (Oil 6) Week to Dec 14, 2018: 5 rigs total (Oil 5) Week to Dec 21, 2018: 5 rigs total (Oil 5) Week to Dec 28, 2018: 7 rigs total (Oil 7) Week to Jan 4, 2019: 8 rigs total (Oil 8) Week to Jan 11, 2019: 8 rigs total (Oil 8) Week to Jan 18, 2019: 9 rigs total (Oil 9) Week to Jan 25, 2019: 10 rigs total (Oil 10) Week to Feb 1, 2019: 6 rigs total (Oil 6) Week to Feb 8, 2019: 10 rigs total (Oil 10) Week to Feb 15, 2019: 11 rigs total (Oil 11) Week to Feb 22, 2019: 12 rigs total (Oil 12) Week to Mar 1, 2019: 11 rigs total (Oil 11) Week to Mar 8, 2019: 6 rigs total (Oil 6) Week to Mar 15, 2019: 9 rigs total (Oil 9) Week to Mar 22, 2019: 8 rigs total (Oil 8) Week to Mar 29, 2019: 5 rigs total (Oil 5) Week to Apr 5, 2019: 7 rigs total (Oil 7) Week to Apr 12, 2019: 7 rigs total (Oil 7) Week to Apr 18, 2019: 6 rigs total (Oil 6) Week to Apr 26, 2019: 5 rigs total (Oil 5) Week to May 3, 2019: 8 rigs total (Oil 8) Week to May 10, 2019: 8 rigs total (Oil 8) Week to May 17, 2019: 6 rigs total (Oil 6) Week to May 24, 2019: 7 rigs total (Oil 7) Week to May 31, 2019: 7 rigs total (Oil 7) Week to Jun 7, 2019: 6 rigs total (Oil 6) Week to Jun 14, 2019: 5 rigs total (Oil 5) Week to Jun 21, 2019: 9 rigs total (Oil 9) Week to Jun 28, 2019: 7 rigs total (Oil 7) Week to Jul 3, 2019: 8 rigs total (Oil 8) Week to Jul 12, 2019: 7 rigs total (Oil 7) Week to Jul 19, 2019: 8 rigs total (Oil 8) Week to Jul 26, 2019: 7 rigs total (Oil 7) Week to Aug 2, 2019: 8 rigs total (Oil 8) Week to Aug 9, 2019: 4 rigs total (Oil 4) Week to Aug 16, 2019: 6 rigs total (Oil 6) Week to Aug 23, 2019: 5 rigs total (Oil 5) Week to Aug 30, 2019: 6 rigs total (Oil 6) Week to Sep 6, 2019: 6 rigs total (Oil 6) Week to Sep 13, 2019: 6 rigs total (Oil 6) Week to Sep 20, 2019: 6 rigs total (Oil 6) Week to Sep 27, 2019: 5 rigs total (Oil 5) Week to Oct 4, 2019: 7 rigs total (Oil 7) Week to Oct 11, 2019: 7 rigs total (Oil 7) Week to Oct 18, 2019: 7 rigs total (Oil 7) Week to Oct 25, 2019: 7 rigs total (Oil 7) Week to Nov 1, 2019: 6 rigs total (Oil 6) Week to Nov 8, 2019: 7 rigs total (Oil 7) Week to Nov 15, 2019: 8 rigs total (Oil 8) Week to Nov 22, 2019: 5 rigs total (Oil 5) Week to Nov 27, 2019: 7 rigs total (Oil 7) Week to Dec 6, 2019: 7 rigs total (Oil 7) Week to Dec 13, 2019: 6 rigs total (Oil 6) Week to Dec 20, 2019: 6 rigs total (Oil 6) Week to Dec 27, 2019: 7 rigs total (Oil 7) Week to Jan 3, 2020: 8 rigs total (Oil 8) Week to Jan 10, 2020: 7 rigs total (Oil 7) Week to Jan 17, 2020: 10 rigs total (Oil 10) Week to Jan 24, 2020: 10 rigs total (Oil 10) Week to Jan 31, 2020: 9 rigs total (Oil 9) Week to Feb 7, 2020: 10 rigs total (Oil 10) Week to Feb 14, 2020: 8 rigs total (Oil 8) Week to Feb 21, 2020: 11 rigs total (Oil 11) Week to Feb 28, 2020: 9 rigs total (Oil 9) Week to Mar 6, 2020: 9 rigs total (Oil 9) Week to Mar 13, 2020: 9 rigs total (Oil 9) Week to Mar 20, 2020: 9 rigs total (Oil 9) Week to Mar 27, 2020: 8 rigs total (Oil 8) Week to Apr 3, 2020: 6 rigs total (Oil 6) Week to Apr 9, 2020: 5 rigs total (Oil 5) Week to Apr 17, 2020: 2 rigs total (Oil 2) Week to Apr 24, 2020: 2 rigs total (Oil 2) Week to May 1, 2020: 2 rigs total (Oil 2) Week to May 8, 2020: 2 rigs total (Oil 2) Week to May 15, 2020: 2 rigs total (Oil 2) Week to May 22, 2020: 2 rigs total (Oil 2) Week to May 29, 2020: 2 rigs total (Oil 2) Week to Jun 5, 2020: 2 rigs total (Oil 2) Week to Jun 12, 2020: 2 rigs total (Oil 2) Week to Jun 19, 2020: 2 rigs total (Oil 2) Week to Jun 26, 2020: 2 rigs total (Oil 2) Week to Jul 2, 2020: 2 rigs total (Oil 2) Week to Jul 10, 2020: 2 rigs total (Oil 2) Week to Jul 17, 2020: 2 rigs total (Oil 2) Week to Jul 24, 2020: 2 rigs total (Oil 2) Week to Jul 31, 2020: 2 rigs total (Oil 2) Week to Aug 7, 2020: 2 rigs total (Oil 2) Week to Aug 14, 2020: 2 rigs total (Oil 2) Week to Aug 21, 2020: 2 rigs total (Oil 2) Week to Aug 28, 2020: 2 rigs total (Oil 2) Week to Sep 4, 2020: 2 rigs total (Oil 2) Week to Sep 11, 2020: 2 rigs total (Oil 2) Week to Sep 18, 2020: 2 rigs total (Oil 2) Week to Sep 25, 2020: 1 rig total (Oil 1) Week to Oct 2, 2020: 1 rig total (Oil 1) Week to Oct 9, 2020: 1 rig total (Oil 1) Week to Oct 16, 2020: 1 rig total (Oil 1) Week to Oct 23, 2020: 1 rig total (Oil 1) Week to Oct 30, 2020: 1 rig total (Oil 1) Week to Nov 6, 2020: 1 rig total (Oil 1) Week to Nov 13, 2020: 1 rig total (Oil 1) Week to Nov 20, 2020: 1 rig total (Oil 1) Week to Nov 25, 2020: 1 rig total (Oil 1) Week to Dec 4, 2020: 1 rig total (Oil 1) Week to Dec 11, 2020: 1 rig total (Oil 1) Week to Dec 18, 2020: 1 rig total (Oil 1) Week to Dec 23, 2020: 1 rig total (Oil 1) Week to Dec 31, 2020: 1 rig total (Oil 1) Week to Jan 8, 2021: 2 rigs total (Oil 2) Week to Jan 15, 2021: 2 rigs total (Oil 2) Week to Jan 22, 2021: 4 rigs total (Oil 4) Week to Jan 29, 2021: 4 rigs total (Oil 4) Week to Feb 5, 2021: 4 rigs total (Oil 4) Week to Feb 12, 2021: 4 rigs total (Oil 4) Week to Feb 19, 2021: 3 rigs total (Oil 3) Week to Feb 26, 2021: 3 rigs total (Oil 3) Week to Mar 5, 2021: 3 rigs total (Oil 3) Week to Mar 12, 2021: 3 rigs total (Oil 3) Week to Mar 19, 2021: 3 rigs total (Oil 3) Week to Mar 26, 2021: 3 rigs total (Oil 3) Week to Apr 1, 2021: 3 rigs total (Oil 3) Week to Apr 9, 2021: 3 rigs total (Oil 3) Week to Apr 16, 2021: 3 rigs total (Oil 3) Week to Apr 23, 2021: 3 rigs total (Oil 3) Week to Apr 30, 2021: 3 rigs total (Oil 3) Week to May 7, 2021: 3 rigs total (Oil 3) Week to May 14, 2021: 4 rigs total (Oil 4) Week to May 21, 2021: 4 rigs total (Oil 4) Week to May 28, 2021: 4 rigs total (Oil 4) Week to Jun 4, 2021: 4 rigs total (Oil 4) Week to Jun 11, 2021: 3 rigs total (Oil 3) Week to Jun 18, 2021: 3 rigs total (Oil 3) Week to Jun 25, 2021: 3 rigs total (Oil 3) Week to Jul 2, 2021: 3 rigs total (Oil 3) Week to Jul 9, 2021: 3 rigs total (Oil 3) Week to Jul 16, 2021: 3 rigs total (Oil 3) Week to Jul 23, 2021: 3 rigs total (Oil 3) Week to Jul 30, 2021: 3 rigs total (Oil 3) Week to Aug 6, 2021: 3 rigs total (Oil 3) Week to Aug 13, 2021: 3 rigs total (Oil 3) Week to Aug 20, 2021: 3 rigs total (Oil 3) Week to Aug 27, 2021: 3 rigs total (Oil 3) Week to Sep 3, 2021: 3 rigs total (Oil 3) Week to Sep 10, 2021: 3 rigs total (Oil 3) Week to Sep 17, 2021: 3 rigs total (Oil 3) Week to Sep 24, 2021: 3 rigs total (Oil 3) Week to Oct 1, 2021: 3 rigs total (Oil 3) Week to Oct 8, 2021: 4 rigs total (Oil 4) Week to Oct 15, 2021: 5 rigs total (Oil 5) Week to Oct 22, 2021: 5 rigs total (Oil 5) Week to Oct 29, 2021: 5 rigs total (Oil 5) Week to Nov 5, 2021: 5 rigs total (Oil 5) Week to Nov 12, 2021: 5 rigs total (Oil 5) Week to Nov 19, 2021: 5 rigs total (Oil 5) Week to Nov 24, 2021: 5 rigs total (Oil 5) Week to Dec 3, 2021: 5 rigs total (Oil 5) Week to Dec 10, 2021: 5 rigs total (Oil 5) Week to Dec 17, 2021: 5 rigs total (Oil 5) Week to Dec 23, 2021: 5 rigs total (Oil 5) Week to Dec 31, 2021: 5 rigs total (Oil 5) Week to Jan 7, 2022: 5 rigs total (Oil 5) Week to Jan 14, 2022: 6 rigs total (Oil 6) Week to Jan 21, 2022: 6 rigs total (Oil 6) Week to Jan 28, 2022: 6 rigs total (Oil 6) Week to Feb 4, 2022: 7 rigs total (Oil 7) Week to Feb 11, 2022: 7 rigs total (Oil 7) Week to Feb 18, 2022: 7 rigs total (Oil 7) Week to Feb 25, 2022: 7 rigs total (Oil 7) Week to Mar 4, 2022: 7 rigs total (Oil 7) Week to Mar 11, 2022: 7 rigs total (Oil 7) Week to Mar 18, 2022: 7 rigs total (Oil 7) Week to Mar 25, 2022: 6 rigs total (Oil 6) Week to Apr 1, 2022: 6 rigs total (Oil 6) Week to Apr 8, 2022: 6 rigs total (Oil 6) Week to Apr 14, 2022: 7 rigs total (Oil 7) Week to Apr 22, 2022: 7 rigs total (Oil 7) Week to Apr 29, 2022: 7 rigs total (Oil 7) Week to May 6, 2022: 6 rigs total (Oil 6) Week to May 13, 2022: 6 rigs total (Oil 6) Week to May 20, 2022: 6 rigs total (Oil 6) Week to May 27, 2022: 6 rigs total (Oil 6) Week to Jun 3, 2022: 6 rigs total (Oil 6) Week to Jun 10, 2022: 6 rigs total (Oil 6) Week to Jun 17, 2022: 6 rigs total (Oil 6) Week to Jun 24, 2022: 6 rigs total (Oil 6) Week to Jul 1, 2022: 6 rigs total (Oil 6) Week to Jul 8, 2022: 6 rigs total (Oil 6) Week to Jul 15, 2022: 6 rigs total (Oil 6) Week to Jul 22, 2022: 6 rigs total (Oil 6) Week to Jul 29, 2022: 6 rigs total (Oil 6) Week to Aug 5, 2022: 6 rigs total (Oil 6) Week to Aug 12, 2022: 6 rigs total (Oil 6) Week to Aug 19, 2022: 6 rigs total (Oil 6) Week to Aug 26, 2022: 6 rigs total (Oil 6) Week to Sep 2, 2022: 6 rigs total (Oil 6) Week to Sep 9, 2022: 7 rigs total (Oil 7) Week to Sep 16, 2022: 8 rigs total (Oil 8) Week to Sep 23, 2022: 8 rigs total (Oil 8) Week to Sep 30, 2022: 8 rigs total (Oil 8) Week to Oct 7, 2022: 8 rigs total (Oil 8) Week to Oct 14, 2022: 8 rigs total (Oil 8) Week to Oct 21, 2022: 8 rigs total (Oil 8) Week to Oct 28, 2022: 9 rigs total (Oil 9) Week to Nov 4, 2022: 9 rigs total (Oil 9) Week to Nov 10, 2022: 9 rigs total (Oil 9) Week to Nov 18, 2022: 9 rigs total (Oil 9) Week to Nov 23, 2022: 9 rigs total (Oil 9) Week to Dec 2, 2022: 9 rigs total (Oil 9) Week to Dec 9, 2022: 8 rigs total (Oil 8) Week to Dec 16, 2022: 9 rigs total (Oil 9) Week to Dec 22, 2022: 9 rigs total (Oil 9) Week to Dec 30, 2022: 9 rigs total (Oil 9) Week to Jan 6, 2023: 9 rigs total (Oil 9) Week to Jan 13, 2023: 9 rigs total (Oil 9) Week to Jan 20, 2023: 8 rigs total (Oil 8) Week to Jan 27, 2023: 8 rigs total (Oil 8) Week to Feb 3, 2023: 7 rigs total (Oil 7) Week to Feb 10, 2023: 7 rigs total (Oil 7) Week to Feb 17, 2023: 7 rigs total (Oil 7) Week to Feb 24, 2023: 7 rigs total (Oil 7) Week to Mar 3, 2023: 7 rigs total (Oil 7) Week to Mar 10, 2023: 7 rigs total (Oil 7) Week to Mar 17, 2023: 7 rigs total (Oil 7) Week to Mar 24, 2023: 7 rigs total (Oil 7) Week to Mar 31, 2023: 7 rigs total (Oil 7) Week to Apr 6, 2023: 7 rigs total (Oil 7) Week to Apr 14, 2023: 7 rigs total (Oil 7) Week to Apr 21, 2023: 7 rigs total (Oil 7) Week to Apr 28, 2023: 7 rigs total (Oil 7) Week to May 5, 2023: 7 rigs total (Oil 7) Week to May 12, 2023: 8 rigs total (Oil 8) Week to May 19, 2023: 8 rigs total (Oil 8) Week to May 26, 2023: 7 rigs total (Oil 7) Week to Jun 2, 2023: 7 rigs total (Oil 7) Week to Jun 9, 2023: 7 rigs total (Oil 7) Week to Jun 16, 2023: 8 rigs total (Oil 8) Week to Jun 23, 2023: 7 rigs total (Oil 7) Week to Jun 30, 2023: 7 rigs total (Oil 7) Week to Jul 7, 2023: 7 rigs total (Oil 7) Week to Jul 14, 2023: 7 rigs total (Oil 7) Week to Jul 21, 2023: 7 rigs total (Oil 7) Week to Jul 28, 2023: 7 rigs total (Oil 7) Week to Aug 4, 2023: 7 rigs total (Oil 7) Week to Aug 11, 2023: 7 rigs total (Oil 7) Week to Aug 18, 2023: 7 rigs total (Oil 7) Week to Aug 25, 2023: 7 rigs total (Oil 7) Week to Sep 1, 2023: 7 rigs total (Oil 7) Week to Sep 8, 2023: 7 rigs total (Oil 7) Week to Sep 15, 2023: 7 rigs total (Oil 7) Week to Sep 22, 2023: 7 rigs total (Oil 7) Week to Sep 29, 2023: 7 rigs total (Oil 7) Week to Oct 6, 2023: 7 rigs total (Oil 7) Week to Oct 13, 2023: 7 rigs total (Oil 7) Week to Oct 20, 2023: 7 rigs total (Oil 7) Week to Oct 27, 2023: 7 rigs total (Oil 7) Week to Nov 3, 2023: 7 rigs total (Oil 7) Week to Nov 10, 2023: 7 rigs total (Oil 7) Week to Nov 17, 2023: 7 rigs total (Oil 7) Week to Nov 22, 2023: 8 rigs total (Oil 8) Week to Dec 1, 2023: 8 rigs total (Oil 8) Week to Dec 8, 2023: 8 rigs total (Oil 8) Week to Dec 15, 2023: 8 rigs total (Oil 8) Week to Dec 21, 2023: 8 rigs total (Oil 8) Week to Dec 29, 2023: 8 rigs total (Oil 8) Week to Jan 5, 2024: 8 rigs total (Oil 8) Week to Jan 12, 2024: 8 rigs total (Oil 8) Week to Jan 19, 2024: 8 rigs total (Oil 8) Week to Jan 26, 2024: 8 rigs total (Oil 8) Week to Feb 2, 2024: 8 rigs total (Oil 8) Week to Feb 9, 2024: 8 rigs total (Oil 8) Week to Feb 16, 2024: 8 rigs total (Oil 8) Week to Feb 23, 2024: 9 rigs total (Oil 9) Week to Mar 1, 2024: 11 rigs total (Oil 11) Week to Mar 8, 2024: 11 rigs total (Oil 11) Week to Mar 15, 2024: 11 rigs total (Oil 11) Week to Mar 22, 2024: 12 rigs total (Oil 12) Week to Mar 28, 2024: 12 rigs total (Oil 12) Week to Apr 5, 2024: 12 rigs total (Oil 12) Week to Apr 12, 2024: 12 rigs total (Oil 12) Week to Apr 19, 2024: 12 rigs total (Oil 12) Week to Apr 26, 2024: 12 rigs total (Oil 12) Week to May 3, 2024: 8 rigs total (Oil 8) Week to May 10, 2024: 8 rigs total (Oil 8) Week to May 17, 2024: 8 rigs total (Oil 8) Week to May 24, 2024: 8 rigs total (Oil 8) Week to May 31, 2024: 8 rigs total (Oil 8) Week to Jun 7, 2024: 8 rigs total (Oil 8) Week to Jun 14, 2024: 8 rigs total (Oil 8) Week to Jun 21, 2024: 8 rigs total (Oil 8) Week to Jun 28, 2024: 8 rigs total (Oil 8) Week to Jul 5, 2024: 8 rigs total (Oil 8) Week to Jul 12, 2024: 8 rigs total (Oil 8) Week to Jul 19, 2024: 8 rigs total (Oil 8) Week to Jul 26, 2024: 9 rigs total (Oil 9) Week to Aug 2, 2024: 9 rigs total (Oil 9) Week to Aug 9, 2024: 9 rigs total (Oil 9) Week to Aug 16, 2024: 9 rigs total (Oil 9) Week to Aug 23, 2024: 9 rigs total (Oil 9) Week to Aug 30, 2024: 9 rigs total (Oil 9) Week to Sep 6, 2024: 9 rigs total (Oil 9) Week to Sep 13, 2024: 9 rigs total (Oil 9) Week to Sep 20, 2024: 9 rigs total (Oil 9) Week to Sep 27, 2024: 9 rigs total (Oil 9) Week to Oct 4, 2024: 9 rigs total (Oil 9) Week to Oct 11, 2024: 9 rigs total (Oil 9) Week to Oct 18, 2024: 9 rigs total (Oil 9) Week to Oct 25, 2024: 9 rigs total (Oil 9) Week to Nov 1, 2024: 9 rigs total (Oil 9) Week to Nov 8, 2024: 9 rigs total (Oil 9) Week to Nov 15, 2024: 9 rigs total (Oil 9) Week to Nov 22, 2024: 9 rigs total (Oil 9) Week to Nov 27, 2024: 9 rigs total (Oil 9) Week to Dec 6, 2024: 9 rigs total (Oil 9) Week to Dec 13, 2024: 9 rigs total (Oil 9) Week to Dec 20, 2024: 9 rigs total (Oil 9) Week to Dec 27, 2024: 9 rigs total (Oil 9) Week to Jan 3, 2025: 9 rigs total (Oil 9) Week to Jan 10, 2025: 9 rigs total (Oil 9) Week to Jan 17, 2025: 9 rigs total (Oil 9) Week to Jan 24, 2025: 9 rigs total (Oil 9) Week to Jan 31, 2025: 9 rigs total (Oil 9) Week to Feb 7, 2025: 9 rigs total (Oil 9) Week to Feb 14, 2025: 9 rigs total (Oil 9) Week to Feb 21, 2025: 9 rigs total (Oil 9) Week to Feb 28, 2025: 9 rigs total (Oil 9) Week to Mar 7, 2025: 9 rigs total (Oil 9) Week to Mar 14, 2025: 9 rigs total (Oil 9) Week to Mar 21, 2025: 9 rigs total (Oil 9) Week to Mar 28, 2025: 9 rigs total (Oil 9) Week to Apr 4, 2025: 9 rigs total (Oil 9) Week to Apr 11, 2025: 9 rigs total (Oil 9) Week to Apr 17, 2025: 9 rigs total (Oil 9) Week to Apr 25, 2025: 9 rigs total (Oil 9) Week to May 2, 2025: 9 rigs total (Oil 9) Week to May 9, 2025: 9 rigs total (Oil 9) Week to May 16, 2025: 9 rigs total (Oil 9) Week to May 23, 2025: 9 rigs total (Oil 9) Week to May 30, 2025: 7 rigs total (Oil 7) Week to Jun 6, 2025: 7 rigs total (Oil 7) Week to Jun 13, 2025: 7 rigs total (Oil 7) Week to Jun 20, 2025: 7 rigs total (Oil 7) Week to Jun 27, 2025: 9 rigs total (Oil 9) Week to Jul 3, 2025: 8 rigs total (Oil 8) Week to Jul 11, 2025: 8 rigs total (Oil 8) Week to Jul 18, 2025: 8 rigs total (Oil 8) Week to Jul 25, 2025: 7 rigs total (Oil 7) Week to Aug 1, 2025: 7 rigs total (Oil 7) Week to Aug 8, 2025: 7 rigs total (Oil 7) Week to Aug 15, 2025: 7 rigs total (Oil 7) Week to Aug 22, 2025: 6 rigs total (Oil 6) Week to Aug 29, 2025: 6 rigs total (Oil 6) Week to Sep 5, 2025: 6 rigs total (Oil 6) Week to Sep 12, 2025: 6 rigs total (Oil 6) Week to Sep 19, 2025: 6 rigs total (Oil 6) Week to Sep 26, 2025: 4 rigs total (Oil 4) Week to Oct 3, 2025: 4 rigs total (Oil 4) Week to Oct 10, 2025: 4 rigs total (Oil 4) Week to Oct 17, 2025: 0 rigs total (Oil 0) Week to Oct 24, 2025: 0 rigs total (Oil 0) Week to Oct 31, 2025: 1 rig total (Oil 1) Week to Nov 6, 2025: 3 rigs total (Oil 3) Week to Nov 14, 2025: 3 rigs total (Oil 3) Week to Nov 21, 2025: 1 rig total (Oil 1) Week to Nov 26, 2025: 1 rig total (Oil 1) Week to Dec 4, 2025: 1 rig total (Oil 1) Week to Dec 12, 2025: 1 rig total (Oil 1) Week to Dec 19, 2025: 1 rig total (Oil 1) Week to Dec 24, 2025: 1 rig total (Oil 1) Week to Dec 30, 2025: 1 rig total (Oil 1) Week to Jan 9, 2026: 1 rig total (Oil 1) Week to Jan 16, 2026: 1 rig total (Oil 1) Week to Jan 23, 2026: 1 rig total (Oil 1) Week to Jan 30, 2026: 1 rig total (Oil 1) Week to Feb 6, 2026: 1 rig total (Oil 1) Week to Feb 13, 2026: 1 rig total (Oil 1) Week to Feb 20, 2026: 1 rig total (Oil 1) Week to Feb 27, 2026: 1 rig total (Oil 1) Week to Mar 6, 2026: 1 rig total (Oil 1) Week to Mar 13, 2026: 1 rig total (Oil 1) Week to Mar 20, 2026: 1 rig total (Oil 1) Week to Mar 27, 2026: 1 rig total (Oil 1) Week to Apr 2, 2026: 1 rig total (Oil 1) Week to Apr 10, 2026: 1 rig total (Oil 1) Week to Apr 17, 2026: 1 rig total (Oil 1) Week to Apr 24, 2026: 1 rig total (Oil 1) Week to May 1, 2026: 1 rig total (Oil 1) Week to May 8, 2026: 1 rig total (Oil 1) Week to May 15, 2026: 1 rig total (Oil 1) Week to May 22, 2026: 1 rig total (Oil 1) Week to May 29, 2026: 1 rig total (Oil 1) Week to Jun 5, 2026: 1 rig total (Oil 1) Week to Jun 12, 2026: 1 rig total (Oil 1) Week to Jun 18, 2026: 1 rig total (Oil 1) Week to Jun 26, 2026: 1 rig total (Oil 1) Week to Jul 2, 2026: 1 rig total (Oil 1) Week to Jul 10, 2026: 1 rig total (Oil 1) Week to Jul 17, 2026: 1 rig total (Oil 1) Week to Jul 24, 2026: 1 rig total (Oil 1) Week to Jul 31, 2026: 1 rig total (Oil 1) Week to Aug 7, 2026: 1 rig total (Oil 1) Week to Aug 14, 2026: 1 rig total (Oil 1) Week to Aug 21, 2026: 1 rig total (Oil 1) Week to Aug 28, 2026: 1 rig total (Oil 1) Week to Sep 4, 2026: 1 rig total (Oil 1) Week to Sep 11, 2026: 1 rig total (Oil 1)

Interactive chart. Focus it and use the left and right arrow keys to read each week, Page Up and Page Down to move a year, Home and End for the ends of the series. The full figures are also in the table below.

  • In North Slope Borough, Alaska, 1 drilling rig was active in the week to September 11, 2026 (5 fewer than a year earlier).
  • Since Sep 2016, the weekly count peaked at 12 in Feb 2019.
  • The count covers land and inland-water rigs; rigs in US federal offshore waters are counted on the Gulf of Mexico page.
Average active rigs per month: full table
Month Oil-directedAll rigs
Sep 2026 (through September 11, 2026)11
Aug 202611
Jul 202611
Jun 202611
May 202611
Apr 202611
Mar 202611
Feb 202611
Jan 202611
Dec 202511
Nov 202522
Oct 20251.21.2
Sep 20255.25.2
Aug 20256.56.5
Jul 20257.57.5
Jun 20257.67.6
May 20258.58.5
Apr 202599
Mar 202599
Feb 202599
Jan 202599
Dec 202499
Nov 202499
Oct 202499

Source: CommoVision (commovision.com)

What we cover here

Each row names the grain a region’s production is held at. Where a source publishes at a coarser grain, the page says so.

DataGrainSinceBenchmark
Alaska production well 1919-12 ~100–101% of EIA

Benchmark cells compare our series with the EIA’s published estimates.

About the EIA comparison

The two are produced differently: the EIA estimates from a survey of the largest operators and a model built to anticipate late filings, while the series compared here are rebuilt from the source’s own records as they arrive. Recent months can differ without either being wrong; the methodology page explains both methods.

Coverage rows for North Slope Borough, Alaska are regenerated at every build from the same catalog of sources the data is built from.

What the data shows

  • North Slope Borough, Alaska produced 151.2 MMbbl of oil and 3.49 Tcf of natural gas in 2025.
  • North Slope Borough, Alaska gas production peaked in 2022 at 3.53 Tcf; 2025 output of 3.49 Tcf ran at 99% of that peak.
  • 1,942 producing wells tracked, 12 months to Jul 2026.

Get early access

Watch supply move as soon as its sources publish, with forecasts on 1.1+ million producing wells. The portal, an API and MCP access for AI tools open on October 1, 2026.

Data use is subject to our Terms of Service.